


 Inglês (pdf)
 Artigo em XML
 Referências do artigo
 Enviar este artigo por email
 Citado por SciELO
  Similares em
SciELO
Similares em
SciELO 
 Permalink
1. Introduction
In the EU (European Union) the annual expenditure in food supplements was estimated to be EUR 7 billion in 2018 (Czepielewska, Makarewicz-Wujec, Różewski, Wojtasik, & Kozłowska-Wojciechowska, 2018). The people use these food supplements for many purposes including healthy maintenance, preventing diseases, balancing diets, improve appearance, etc. (Czepielewska et al., 2018). Sometimes food supplements did not need to be submitted to regulatory pre approval requirements before the commercialization and that procedure can cause some harm, because of the presence of some contaminated, faked, or ineffective supplements that might affect the health of consumers (Garrido, Souza, Lourenço, & Fasciotti, 2016), sometimes leading until to death (Lohumi, Lee, Lee, & Cho, 2015; Zhang,Yang, Lin, & Ying, 2021).
Food adulteration is common and a very investigated problem. As an example, in the EU notifications on an online platform about adulteration have increased in last years (Czepielewska et al., 2018). Milk products are target of this practice, mainly the powdered ones, as whey protein. Since it is a fraction of soluble protein in milk serum obtained during cheese and casein production (Garrido et al., 2016) a previous work reported in literature points out that whey protein supplements are very susceptible to adulteration (Garrido et al., 2016; Lukacs et al., 2018; Pereira et al., 2018).
In whey protein samples, the adulteration can occur with carbohydrates, amino acids derivatives and thermogenic substances, like caffeine, creatine and lactose (Pereira et al., 2018) or namely urea, L-histidine, L-taurine (Lukacs et al., 2018).
Pereira et al. (2018) studied the adulteration of whey protein with three different compounds using stationary and time resolved fluorescence spectroscopy. When they used Hierarchical Cluster Analysis (HCA), was possible to obtain 3 different clusters with stationary fluorescence spectroscopy data. Other work developed by Garrido et al. (2016) cites rice and soybean as a cheap adulterating agent in whey protein supplements.
Vibrational spectroscopic techniques, as Near Infrared (NIR), Mid Infrared (MIR), Raman spectroscopy and Hyperspectral Imaging (HIS), have already been used as fast and sensitive analytical techniques for a variety of agro-food products (Lohumi et al., 2015), similar to whey protein. These techniques are non-destructive, chemical-free and require minimal sample preparation. Also, Attenuated Total Reflectance (ATR) associated MIR (ATR-FT-MIR) requires a very small quantity of sample and none or little sample pretreatment is needed with high accuracy and excellent reproducibility (Gorla et al., 2020; Tondi & Petutschnigg, 2015) for the purposes.
The Fourier Transform Mid Infrared (FT-MIR) spectroscopy has also been reported as useful tool to determine: adulteration in virgin coconut oil (Rohman & Che Man, 2011), protein quantification in whey protein (Andrade et al., 2019), adulteration in edible oil (Jamwal et al., 2021), Radix Astragali-herbal medicine analyzes (Yang et al., 2021), even as 5-(hydroxymethyl) furfural quantification in honey (Stöbener, Naefken, Kleber, & Liese, 2019).
Given the main features of the spectra obtained by ATR-FT-MIR spectroscopy they can be coupled to chemometric methods, like HCA, Principal Component Analysis (PCA), Partial Least Squares (PLS) and Interval Partial Least Squares (iPLS). PLS is a regression technique that models the relation between response variables and predictor variables by means of latent variables, reducing the variables dimension (Wang, Gu, Wang, & Saporta, 2019). The iPLS is usually used to select variables and involves subdividing the spectra into non-overlapping intervals and modeling each one with PLS. The intervals that provide the lowest values of Root Mean Squared Error of Cross-Validation (RMSECV) or higher correlation coefficients (R) are used in the prediction model (Nespeca, Pavini, & de Oliveira, 2019).
In this context, this work shows the use of ATR-FT-MIR coupled with iPLS to quantify rice flour as adulterant content in vanilla flavor whey protein supplement.
2. Materials and methods
2.1 Sample preparation
In this work, commercial rice flour was used to adulterate original commercial vanilla flavor whey protein supplement samples. For the whey protein supplement, the sample considered as not adulterated was the vanilla whey Gold Standard 100% whey protein isolate (Optimum Nutrition). The whey was adulterated using a commercial rice flour, obtained in local market. The adulterated samples were prepared with ten different concentrations of rice flour between 11.49%, 12.99%, 16.78%, 17.08%, 17.89%, 21.03%, 23.45%, 24.50%, 27.75 and 29.14% (w/w) in triplicate.
The range of adulterant concentration (11% - 30%) was established following a similar approach as proposed by Pereira et al. (2018), when analyzing whey protein adulteration with caffeine, lactose and creatin.
The mass of whey protein supplement and rice flour for each sample were measured using an analytical balance, put inside clean commercial small (5 cm × 7 cm) zip lock plastic bags and the solid mixtures were homogenized manually by 10 min. These samples were conditioned in bags and stored at room temperature (~24 ºC) in a cabinet until the analysis by ATR-FT-MIR.
2.2 Sample Analysis by ATR-FT-MIR
The analyzes were carried out without sample preparation (pure rice, pure whey protein supplement and adulterated whey protein samples). A Cary 630 spectrometer (Agilent Technologies) was used, and the wave numbers varied from 4000 to 650 cm−1, with a 2 cm−1 resolution. The samples were placed directly in the ZnSe Crystal of ATR accessory and analyzed at room temperature (~24 ºC) in the reflectance mode. All the spectra obtained were exported in txt format to be used at PLS and iPLS analyses conducted in Rstudio software.
2.3 Chemometric Analysis
The chemometric analyses were conducted in RStudio software (R foundation), using the package mdatools (Kucheryavskiy, 2020) to perform the PLS and iPLS methods.
The PLS method was done with the entire spectrum and many preprocessing procedures were tested: no pre-processing, normalization, Standard Normal Variate (SNV), Multiplicative Scatter Correction (MSC), Savitzky-Golay and some combination between these techniques. The calibration and cross-validation errors for each one were performed.
In iPLS methodology, the model was done with the best preprocessing method obtained for PLS. The best size of scanned windows determined under the consideration of four different sizes of wavenumbers that were tested: 12, 18, 36 and 72 cm-1. The best one was chosen by comparing the calibration and cross-validation errors for each one.
3. Results and discussion
First of all, the pure commercial vanilla flavor whey protein supplement and the pure commercial rice flour were analyzed by ATR-FT-MIR separately. The obtained spectra for each of the pure samples are shown in Figure 1.
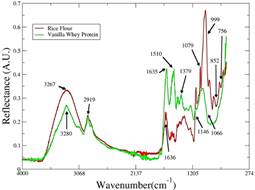
Figure 1 ATR-FT-MIR spectra of pure whey protein supplement Gold standard vanilla - Optimum Nutrition (green line) and rice flour -local trade (red line) used in development of this work.
In the whey protein supplement spectrum several bands can be observed. The band at 3280 cm-1 cans be associate to N-H and O-H stretching vibration and the O-H in plane band is visible at 1379 cm-1 (Pavia, Lampman, Kriz, & Vyvyan, 2010). In 1144 cm-1 the C-N stretch band can be observed. In 1066 cm-1 the band associate with C-O stretching is shown, as the band at 2919 cm-1 is attributed to C-H stretching vibration. The band at 1635 cm-1 is associate to the C=O stretching as the one at 1510 cm-1 is attributed to C=C stretching of ring stretch (Pavia et al., 2010). As the whey protein used had 85% of protein, then the bands containing N-H, C-N, C=O bonds were expected to be so explicit.
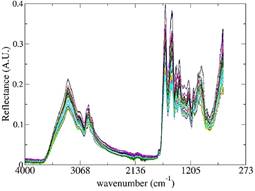
Figure 2 ATR-FT-MIR spectra of whey protein supplement samples adulterated with rice flour for all concentrations.
On the other hand, the rice flour spectrum exhibits the bands of O-H stretching vibration (3267 cm-1), C-O-C stretching (1079 cm-1) and C-O stretching (999 cm-1). The 852 and 756 cm-1 bands are associate to C-H out-of-plane, while the C-H stretching vibration is showed at 2919 cm-1. The band at 1636 cm-1 can be associate to C=C stretching (Pavia et al., 2010). As the majority compound in rice flour is starch, the bands related to O-H chemical bond are easily explained. In the Whey protein, this band can be explained by proteins and carbohydrates content.
When the two spectra are compared, the differences between them are in the bands 1510 cm-1, in whey protein spectra, and 1146, 1079, 921, 852, 756 cm-1 in rice flour spectra. In addition, the spectral region between 3600 and 3100 cm-1 has visible different intensities.
Also, all the adulterated samples were analyzed by ATR-FT-MIR and all the spectra obtained are showed in Figure 2.
As a first intent to quantify the concentration of rice flour present inside the produced adulterated mixture, the PLS with several preprocessing methods were tested: no pre-processing, MSC + SNV, MSC + normalization, MSC, SNV + normalization, Normalization, Savitzky-Golay and Savitzky-Golay + normalization. The model using Savitzkv-Golay showed the best results for PLS. Also, the model was developed using the whey concentrations, because PLS response obtained was better.
The error in calibration data set (RMSEC) was 4.632 and the determination coefficient R2= 0.372, insofar the cross-validation error (RMSECV) was 5.444. The X variance explained was 96.07 % and for Y this value was equal 37.19%, with 4 latent variables. Table 1 show the parameters obtained for all the preprocessing methods tested for PLS.
Table 1 Model parameters obtained for all the preprocessing methods tested for PLS
| Preprocessing method | RMSEC | RMSECV | Calibration R2 |
| No preprocessing | 4.626 | 5.441 | 0.374 |
| MSC | 5.675 | 6.215 | 0.057 |
| Savitzky-Golay | 4.632 | 5.444 | 0.372 |
| Normalization | 4.969 | 6.013 | 0.277 |
| SNV + Normalization | 5.674 | 6.218 | 0.058 |
| MSC + SNV | 5.673 | 6.213 | 0.058 |
| MSC + Normalization | 5.675 | 6.215 | 0.057 |
| Savitzky-Golay + Normalization | 5.006 | 6.017 | 0.266 |
As the values for the errors were not satisfactory, the iPLS method was done to improve the results. As the Savitzky-Golay method showed the best results in PLS, the iPLS was done with this preprocessing method. The set of samples was split in two groups: calibration (24 samples) and validation (5 samples). A leave one out cross-validation was performed, with whey concentrations between 70.86% to 88.51%. Here, when the whey protein supplement concentrations were used a better fit of the model occurred instead the use of rice flour concentrations.
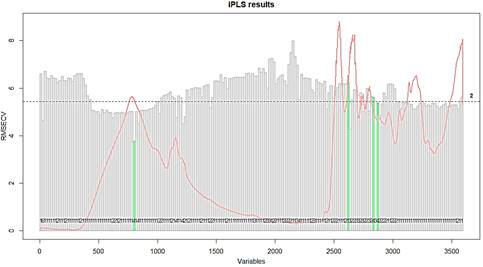
Figure 3 In green are showed the RMSECV of the four intervals selected in iPLS model developed to quantify whey protein adulterated with rice flour. In grey are showed the RMSECV for each one of the intervals.
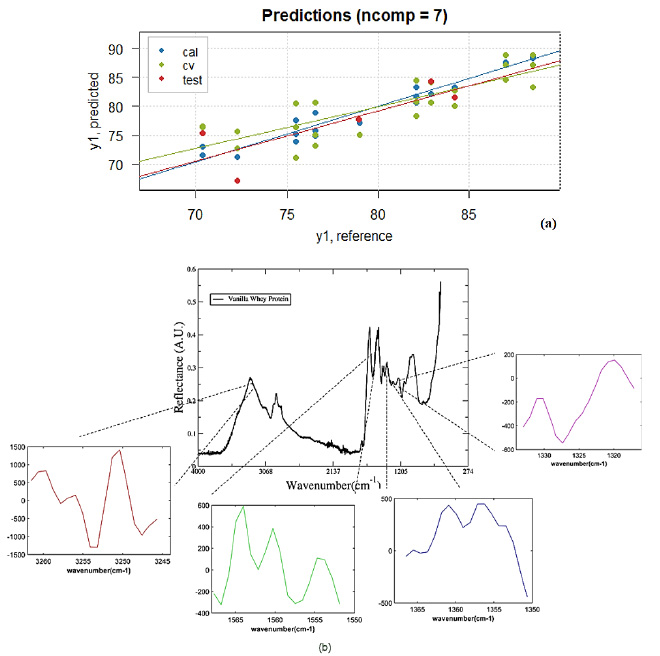
Figure 4 (a)Reference versus Predicted whey protein contend values of samples in the calibration (blue - cal) and cross-validation (green - cv) model and validation set (red - test). (b) Whey protein spectra showing the wavenumber position related to their values for iPLS model (7 LV's) versus wavenumber (cm-1).
Four sizes of scanned windows were tested with wavenumbers size equal 12, 18, 36 and 72 cm-1, to improve the iPLS results. The best one was observed for 18 cm-1, when all the variables were split in 200 intervals and the forward model was performed. A minor error in calibration, cross-validation and validation were found for the samples when those conditions were used. The model explained 99.97% and 94.95% of X (mixtures of whey protein supplement and rice flour spectra) and Y (concentration of whey protein supplement) variances when four intervals were selected and 7 Latent Variables (LV's) were used. These intervals are shown in Figure 3.
The first interval is in the OH- and N-H stretch bands. The second interval selected by the iPLS model is in the 1510 cm-1, one of the bands that are different between the whey and rice flour spectra. The third and fourth intervals are in the 1330 cm-1 band for the rice flour spectra that is in minor size in whey protein spectrum.
The error in calibration data set (RMSEC) was 1.26 and the determination coefficient R2= 0.954, insofar the cross-validation error (RMSECV) was 3.31. The prediction error (RMSEP) for the validation set was equal 3.48 and the determination coefficient was R2= 0.610. These values for errors and the determination coefficient show that the model can predict new samples with good confidence. In Figure 4 (a) can be observed the whey contend values of samples in the calibration (blue), cross-validation model (green) and validation set (red). Also, in Figure 4 (b), is shown the Regression coefficients for iPLS model when 7 LV’s were selected.
With the methodology proposed here is possible to quantify the whey protein supplement contend with rice flour adulteration using a fast protocol based on ATR-FT-MIR spectroscopy coupled with an iPLS model (entire analysis - spectroscopic data collection and chemometric model analysis, would spend ~10 min) without sample preparation process.
Given the characteristics of the ATR-FT-MIR used it also allows the sample recovery after the analysis, that can be used for other investigations if necessary.
4. Conclusions
In this work we demonstrated that the proposed protocol using iPLS as chemometric tool with ATR-FT-MIR is an alternative to analyze adulteration of vanilla flavor whey protein supplement with rice flour. The model obtained showed good predictability when the four selected intervals of spectra were used with 7 LV’s. As observed, maybe the proposed method can be also used to quantify other flavors whey protein supplement adulterated with rice flour. But more experiments are required to demonstrate it. The analytical process is easy, fast, and does not require a large amount of sample or even complex storage protocol, been highly recommended for control agencies, and quality protocols within industry or commerce.

