


 English (pdf)
 Article in xml format
 Article references
 Send this article by e-mail
 Cited by SciELO
  Similars in
SciELO
Similars in
SciELO 
 Permalink
1. Introduction
Currently, non-destructive characterization of food is a necessity in the food industry. Several technologies are being developed to overcome this, among them, THz technology is projected as a promising alternative. The re search carried out involves studies in liquid biomolecules, pharmaceuticals, chemical materials and quality control of food and agricultural products (Li et al., 2017).
The THz spectral band has a longer wavelength that causes less dispersion and higher resolution (Lu et al., 2016), as well as high penetration, spectral fingerprints, and safety (Sun &Liu, 2020), which would allow the characterization of various types of food in larger sizes compared to other technologies such as near-infrared spectroscopy (NIR) (Badaró et al., 2019; Firmani et al., 2020; Sun et al., 2021) or hyperspectral images (Castro et al., 2019).
In biological applications, there are three reasons for its use: (1) strong absorbance by water; (2) predicted resonances in biomolecules; and (3) low possibility of tissue damage by interaction with low-energy photons (Dhillon et al., 2017). It has advantages, such as being non-invasive, transparency and deep penetration in various materials (Jiang et al., 2019), including those opaque to the light such as plastic, paper or fabrics (Karaliūnas et al., 2018).
On the other hand, THz spectroscopy combined with chemometric represents a potential strategy for qualitative and quantitative analysis of chemical and biological molecules (Wang et al., 2020; Yan et al., 2018); reported optical parameters are used to discriminate low density materials in food products (Shin et al., 2018), for example, in flour, it was possible to establish prediction models with high precision of the concentration of additives (Sun et al., 2019). For their part, Ren et al. (2020) combined THz spectroscopy with machine learning to classify apple and mango slices based on their moisture, resulting that the support vector machine showed the highest classification accuracy compared to K-nearest neighbors and D-tree classification. Therefore, developing specific libraries and chemometrics algorithm for different food compounds represents a sequence of tasks to be completed (Feng & Otani, 2021).
Water, having a high permittivity in the THz range, can be used as a contrast image in food (Han, 2020; Dominguez et al., 2018; Salén et al., 2019). Food, being composed of water, fats, carbohydrates, and proteins, absorb radiation in decreasing order by these compounds (Domínguez et al., 2018; Shin et al., 2018). All of them are associated with rotational and vibrational energy in the THz band, which allows to evaluate their intermolecular and intramo lecular behavior of compounds involved in biological activities (Li et al., 2020), being able to adapt to a wide range of applications (Singh et al., 2020) which include the identification of compounds by association with their THz spectral fingerprint, such as myricetin, quercetin and kaempferol (Flavonoids) (Yan et al., 2018), pesticides and gases produced by microorganisms in food deterioration (Cheng et al., 2020; Hindle et al., 2018; Wang et al., 2020; Wang et al., 2020); even there are already studies focused on identifying microorganisms (Yoon et al., 2019), being necessary to extend the use of this technology to various types of food in composition, degradation, adulteration, chemical and microbial contamination.
An important aspect to evaluate is how the water composition of food interferes in the identification of other compounds, a view that little or nothing has been considered in the studies carried out so far. For this reason, the objective of this review is to give a first report about the interaction of the frequency ranges used in THz spectroscopy with the water content of food according to its category, to find certain standards in which the physico-chemical characterization of food samples is more effective.
2. Principle of THz technology
Terahertz spectroscopy (THz) emerged as a suitable methodology for investigating dynamic properties of organic molecules relevant to life sciences because it can detect the low-frequency collective vibrational modes of biomolecules (Wilke, 2017). This technology has been widely used to study the spectroscopic characteristics of a variety of food and non-food products (Wu & Khan, 2012).
THz radiation covers a frequency range from 0.1 to 30 THz located between the mid-infrared and microwave of the electromagnetic spectrum (Tonouchi, 2007), However, there is no consensus on the range spanning the terahertz band, with some authors reporting the range from 0.1 to 10 THz (Catapano & Soldovieri, 2019; Jiang et al., 2019; Li et al., 2020). Meanwhile Maamar et al. (2020) reports the frequency range from 300 GHz to 10 THz with a wavelength from 30 µm to 1000 µm, wavenumber from 10 cm-1 to 300 cm-1 and an energy of 1 THz that is 6.6x10²² J or 1.4 meV that represents a non-ionizing energy, because, to ionize an atom, 1000 times more than this energy is needed.
THz pulses can be generated and detected by using short pulse lasers with pulse widths ranging from 100 to 10 femtoseconds (Malcolm et al., 2014), a range that allows exploring applications in the far infrared. During the spectroscopic measurement of THz, the transient electric field is measured, which determines the amplitude and phase of each of the spectral components that make up the pulse (Wang et al., 2017), and, since amplitude and phase are directly related to the absorption coefficient and refractive index of the sample, these useful indicators can be obtained for the classification or characterization of samples.
The optical parameters of THz, refractive index and absorption coefficient from a sample can be obtained by using the mathematical model proposed by Dorney et al. (2001). Likewise, to obtain the amplitude and wave phase that is in time domain, a Fourier transform is performed to pass it to the frequency domain according to the Equation (1)
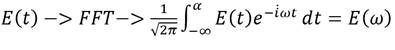 ()1
()1
After the Fourier transform, the spectral signal in time domain obtained, the spectral function in the frequency domain is obtained, namely E (ω). Eref (𝜔) and Es (𝜔) are the signals in the frequency domain of the reference and the sample, respectively, and H (𝜔) is the transmission function, which is given by Equation (2), where 𝑛 𝑠 (𝜔) is the refractive index, Ks (𝜔) is the extinction coefficient, 𝜔 is the frequency, 𝑐 is the speed of light, 𝑙 is the thickness of the sample, 𝑛 0 is the refractive index of nitrogen and 𝛼 𝑠 𝜔 is the coefficient of absorption. Calculation formulas for the extinction coefficient, refractive index and absorption coefficient of the sample are presented in equations (3) (4) and(5), respectively:
 (2)
(2)
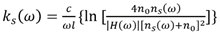 (3)
(3)
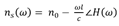 (4)
(4)
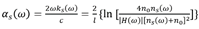 (5)
(5)THz time-domain spectroscopy (THz-TDS), both in transmission and reflection mode (Ung et al., 2007; Wang et al., 2020), are the most applied techniques for the study of the structure and interactions of chemical materials (Sun &Liu, 2020; Wang et al., 2019; Wang et al., 2020; Wang et al., 2020; Yan et al., 2018; Zhong et al., 2021), of phase transitions and associated changes in material properties and to study rotations and vibrations in molecular systems (Salén et al., 2019).
3. Application of THz technology in food
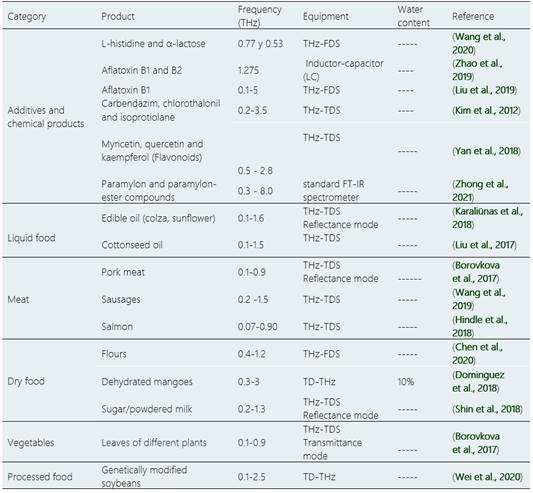
In food it is important to quantify the water content, dehydration and hydration of food are two very common processes in the food industry that must be investigated by using THz technology. However, Gowen et al. (2012) and Afsah‐Hejri et al. (2019) suggest that the high absorption of THz radiation by water represents a limitation of this technology for the accurate detection of water content when products have high water content or a thickness greater than 1 mm. Therefore, a critical analysis of what has been reported to date regarding the frequency ranges applied in THz technology associated with the water content of the samples should be carried out. In Tables 1 and 2, six categories of food are grouped according to their nature and the frequencies at which the research has been carried out, considering the frequency range of 0.2-1.0 THz in which the Rapid Relaxation (RR) process occurs (Smolyanskaya et al., 2018) and above 1.0 THz, as High Frequency (HF) in which vibration, libration and intermolecular stretching processes dominate in the total spectra (Yada et al., 2008).
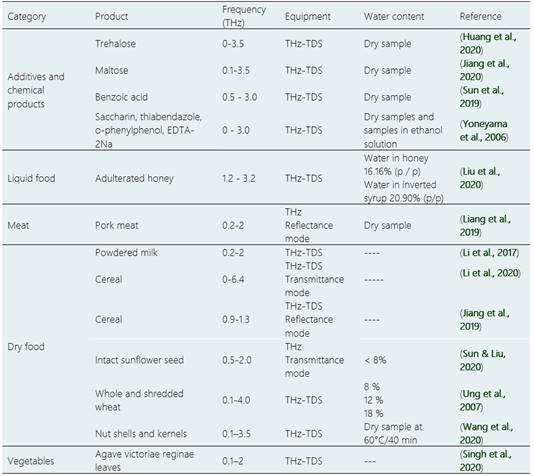
In Table 1 and 2, according to the categories identified for the food groups, for RR frequency range, sixteen (16) articles published from 2017 to 2020 are observed, and for HF range, thirteen (13) articles published from 2006 to 2020 are observed. This shows that THz technology has been applied in multiple food products, mainly to detect moisture in dry samples {Formatting Citation}, to measure the water content in biological samples such as pork (Borovkova et al., 2017), to identify and detect foreign bodies in food matrices (Jiang et al., 2019; Wang et al., 2019; Wang et al., 2020; Sun &Liu, 2020), to detect harmful food additives (Yoneyama et al., 2006), for the detection of genetically modified agricultural products (Wei et al., 2020), to measure the water content of plant leaves (Afsah-Hejri et al., 2020), adulteration of honey (Liu et al., 2020), thus becoming a recommended tool for the inspection and quality control of food, such as fruit and vegetables (Ren, Zahid, Ali Imran, et al., 2019; Ren, Zahid, Imran, et al., 2019), and, in some cases, combining images with spectra have made it possible to predict the concentration of certain compounds such as maltose (Jiang et al., 2020).
Terahertz pulses are suitable for examining components with crystalline structure and low water content; in materials with high water content, THz waves are strongly absorbed by water (Khaliduzzaman et al., 2020). Domínguez et al. (2018) in his study evaluates the water content in slices of mangos by THz pulses, according to their dielectric properties, resulting that, when water content is reduced to 9% two phenomena occur in the behavior of the THz wave, which is the phase change and wave attenuation, the former associated with the dielectric properties of the sample and its thickness, and the latter is associated with the water content.
Table 1. Food category in the Rapid Relaxation (RR) frequency range of 0.2 - 1.0 THz
Meanwhile, Borovkova et al. (2017) refers that in biological samples, such as leaves, the optical properties of the samples move from dispersion of pure water to dispersion of the dry tissue, which is reflected in the decrease in the refractive index as water content is reduced.
On the other hand, THz spectrum combined with chemometrics is the strategy used to estimate compounds in the same sample (Yan et al., 2018), e.g., adulterant content in different quality material or compounds from different samples (Li et al., 2020; Liu et al., 2020). Liu et al. (2020) used the absorption coefficient, the slope of the absorption coefficient spectra and the area of the absorption coefficient spectra to find the differences between adulterant concentration in acacia honey with simple linear regression (SLR) and multiple linear regression (MLR), resulting that MLR with the area of the absorption coefficient spectra proved to be the best model for prediction. In turn, Liu et al. (2019), to identify aflatoxin B1 in soybean oil and to find the best determination model with THz spectra, included least-squares support-vector machines (LS-SVM), back-propagation neural networks (BPNN), random forests (RF) and partial least squares (PLS), resulting neural networks as the best alternative.
Table 3 shows processes of dehydration, hydration, fermentation, enzyme activity, drying kinetics, water content monitoring, water diffusion, in articles published from 2016 to 2020 which use RR and HF frequencies.
One of the properties of Terahertz waves is the high absorption by polar substances, such as water, ethanol and sugar. (Fawole & Tabib-Azar, 2016). This property can be used to obtain more detailed intermolecular information on water behavior in various fruits and vegetables (Ren, Zahid, Ali Imran, et al., 2019), due to its high resolution and sensitivity to molecular vibration (Ren, Zahid, Imran, et al., 2019). Thus, the amount of water in materials can be determined, with high sensitivity, since recombination and breaking motions of water clusters occur within a period of picoseconds corresponding to THz range (Shin et al., 2019). Then, Ren et al. (2020) was able to follow the dehydration of apple and mango slices for four days, in which the transmission spectrum for both products was clearly differentiated, being this associated with their different composition. Likewise, transmission response in both samples was always lower the higher the water content of the sample, achieving better differentiation in the frequency range of 0.8 to 1.05 THz.
The refractive index, absorption coefficient and dielectric properties of samples can be measured by using THz spectroscopy (Fan et al., 2018; Fawole & Tabib-Azar, 2016; Ren, Zahid, Imran, et al., 2019), as well as the structural properties of proteins (Cheng et al., 2020). In addition to the nature of the components in the sample, their physical structures and crystalline states always show different responses to THz radiation (Zhang et al., 2018). In gallic acid monohydrate compared to gallic acid, intramolecular and intermolecular interactions change due to water molecules bonding with each other through bifurcated hydrogen bonds, which causes intermolecular motions in THz region, considered as liberational, rotational and translational vibrations, being that the direction of vibrations in each molecular layer is different. (Zhang et al., 2018). Oh et al. (2020) monitored water diffusion in basswood which was achieved by relating changes in THz pulse intensity to water content. Thus, they reported that there is an inverse relationship between normalized pulse intensity and water content.
4. Meta-analysis: THz spectral differences based on water content and wave frequency
For meta-analysis, a grouping of foods (6 categories) was made according to type (nature) and water content, from which a descriptive analysis was performed involving the report of the average and standard deviation of the frequencies used in each of the categories. Additionally, a multidimensional scaling was performed, which allowed finding groupings based on both the water content and the THz frequency used, making it possible to find the relationships inherent to the interaction of THz waves with the matrices of the food samples.
4.1 Water and THz
The energy of hydrogen bonds, which are the basis of all biological systems, is comparable THz quantum energy. Therefore, a water molecule by itself can be considered as a universal marker of the THz frequency range, which is sensitive to various vital processes taking place in cells and tissues. Compared to what is traditionally described in dielectric spectroscopy in the THz frequency range, water as a marker allows us to obtain new information about biological systems. Moving from gigahertz (GHz) range to THz range, we gradually approach various oscillation processes, which are determined by the interaction of water molecules with the surrounding molecular systems.
Most researchers identified two modes of water relaxation: one is in the range of GHz to 0.1 THz, called slow relaxation water on a time scale of ≃10PD. Another one is beginning to be seen in THz region, called rapid relaxation water on a sub-picoseconds time scale (Møller et al., 2009). Terahertz spectroscopy allows the observation of water dynamics, due to its sensitivity to dielectric relaxation processes associated with water reorientation (Tielrooij et al., 2009), and this gives the option for THz spectroscopy technology to characterize strong water absorption, allowing to use this frequency as a sensitive, non-invasive, hydration probe (Borovkova et al., 2017).
4.2 Evaluation of the use of THz spectroscopy for the water content of food
The high-water content in tissues and biological liquids determines the nature of their dielectric response in THz frequency range (Smolyanskaya et al., 2018). This is the case for many food products ranging from dry products to products with high water content. There are two types of water presence in the composition of products, one is free water and the second refers to bound water, making valuable but different contributions to the THz response of biological objects (Cherkasova et al., 2020).
When carrying out the meta-analysis of the documents reviewed, they were grouped into 6 categories: additives, liquid foods, meat, foods involved in processes (dehydration, hydration, etc.), dry and vegetable, from which it was observed that the frequency range for each food group is different. The average and standard deviation used in each type of food can be observed in Figure 1.
Table 3 Processes in food at Rapid Relaxation (RR) frequency and High Frequency (HF)
| Process | Frequency (THz) | Equipment | Water content | Reference |
| Enzyme activity | 0.4-1.8 | THz-TDS | ---- | (Cheng et al., 2020) |
| Hydration | 0.2-1.0 | THz-TDS Reflectance mode | 66.67-99% (by difference) | (Fan et al., 2018) |
| Fermentation | 0.75-1.1 | Vector network analyzer (VNA) in reflectance mode | 0-100% (ethanol) 55-100% (sugar) | (Fawole & Tabib-Azar, 2016) |
| Monitoring of fruit water content | 0.75-1.1 | Vector network analyzer In reflectance and transmittance mode | 0-95.47% | (Ren, Zahid, Ali Imran, et al., 2019) |
| Detection of sugar and salt contamination in the frozen state | 0.75-1.1 | Vector network analyzer In reflectance and transmittance mode | 80.65-100% | (Ren, Zahid, Fan, et al., 2019) |
| Monitoring of fruit water content | 0.75-1.1 | Vector network analyzer In reflectance and transmittance mode | ----- | (Ren, Zahid, Imran, et al., 2019) |
| Quality control, compound detection. | 0.23-1.92 | THz-TDS | ----- | (Yi̇Yen, 2018) |
| Drying kinetics | 0.2-1.5 | THz-TDS System | HR<1% (Chamber of | (Shin et al., 2019) |
| Water diffusion | 0.1-3.0 | THz-TDS Reflectance mode | 5 - 30% | (Oh et al., 2020) |
| Dehydration | 0.5-4.5 | THz-TDS | HR<1% | (Zhang et al., 2018) |
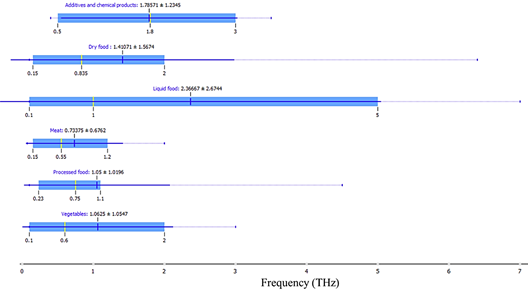
From Figure 1 it can be determined that liquid products use wider ranges and, according to the documents reviewed, they state that the spectra in THz range are not very clear. This may be due to the high absorption of THz radiation that water-rich matrices have. In this context Heugen et al. (2006) determined that the properties of water molecules near the surface of a biomolecule, such as proteins or carbohydrates, which is the case for food, can have intense absorption readings that are explained in terms of hydration water and solute oscillations, which can be useful to directly investigate hydration layers, but can cause errors in the interpretation of results if the level of water-solute interaction is unclear.
The approach of THz spectroscopy technology to food science in recent years is since technology has been improved in the emission level (Afsah‐Hejri et al., 2019), and emphasis has been placed on its discrimination potential, compared to other types of spectroscopies. In the authors' opinion, we consider that emphasis is not being placed on one of the greatest potentials of this type of spectroscopy and it can be very useful to study the structure and dynamics of water within food, and this lies in the fact that dielectric response in the THz region directly reflects the reorientation of water dipoles occurring on picosecond time scales. However, considering their level of penetration, it is imperative to separate the behavior of dynamics of free and bound water, whose relaxation responses are influenced by molecular bonds associated with other composition molecules. It will be necessary to explore this proposition to find the answers to the stated hypotheses.
According to Heugen et al. (2006), the transition of water from its free state to a bound state and vice versa is the reason for changes in the THz response of biological objects. In this context, two relaxation processes are known, the first called Rapid Relaxation (RR) and the second, using spectra greater than 1.5 THz, called High Frequency (HF) (Cherkasova et al., 2020).
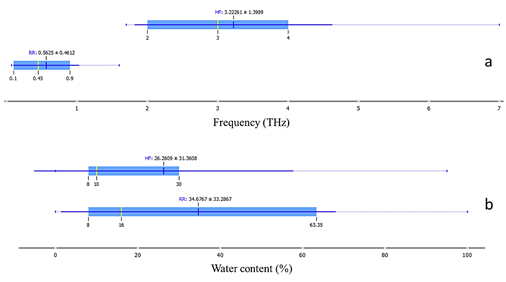
By using the concept of these two types of relationship, the different types of food treated in the literature review were grouped according to the frequency as seen in Figure 2 (a). The documents reviewed in this paper referring to the use of THz technology in food do not refer to this differentiation. As most of them were experimental processes, they reported the most relevant results, but it obviously follows a pattern based on the water content of the samples. This was plotted on Figure 2(b), which allows us to contrast and draw some conclusions.
It is clearly seen in Figure 2 that Rapid Relaxation (RR) type tests cover the analysis of food with high water content. This is attributed to the fact that this type of relaxation represents the interaction of THz radiation with free water molecules and hydrogen bonds in food, this type of interaction has been confirmed by multiple investigations (Jeong et al., 2017; Smolyanskaya et al., 2018; Zhao et al., 2020). It is evident that, in wet foods there are differences in this THz frequency range, since there is a lot of free water. Therefore, a first valid conclusion is that this range of 0.1 to 1.5 THz gives us better data for differentiation or characterization processes in wet foods.
Likewise, it is observed in Figure 2 that foods using High Frequency range (HF) made their observations in foods with medium to dry water content (<5%), due to the high contrast between dry matter and liquid water that the food sample still contains, which makes spectra in THz range clearer at high frequency values, basically due to the polarity of water molecules and the transition of water from its free state to a bound state and vice versa (Ma et al., 2019).
4.3 THz multidimensional scaling with respect to the water content of the sample
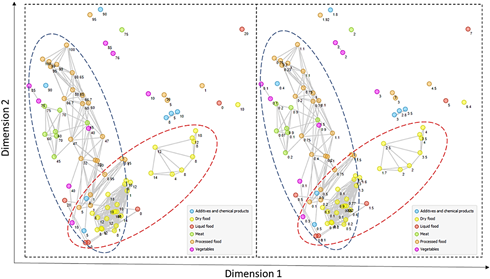
This meta-analysis was performed to find food groupings based on water content and frequency, for which the multidimensional scale (MDS) was used. It is a nonlinear unsupervised feature extraction algorithm that focuses on relationships (similarities or differences) between data in a multidimensional space (Anowar et al., 2021).
To perform the analysis based on water content, the values not recorded in the articles were completed with reference values according to product category, thus completing the database for the use of MDS. Figure 3 shows the MDS performed with the values found in the review, from which two large groupings can be clearly observed: those included in the red loop, which includes dry foods, a single category of high-frequency analysis, and a blue loop involving processed foods, meat, and vegetables, which is mostly analyzed in fast-relaxation values.
Differentiating these 3 groups allows us to suggest that, currently, the use of THz spectroscopy in food is performed as black box experiments, and that it is necessary to consider not only the polarity of water molecules but also the other molecules under study in the planning of experiments in food. This is important to understand, at a molecular level, the mechanisms resulting from the interaction of THz waves with the various food matrices, to concretize the physical explanation of changes in the spectral signatures and indices generated therein, allowing to focus this technology not only for non-invasive characterization but also for using it in the development of products according to the demands of today's market.
It is also important to note that most of the papers reviewed seek to use THz technology as a method of nondestructive control of the quality or purity of a food, especially because of penetration characteristics of THz spectroscopy, but by not considering the relationship with water content and the strong absorption of THz radiation by aqueous systems, its efficiency in measuring quality by depth layers is limited.
5. Conclusions
THz spectroscopy is increasingly being used in food area, mainly at the laboratory level. The development of spectroscopy in THz region has allowed the evaluation of continuous dielectric spectra, especially in the frequency range around 0.1 to 10 THz. However, the physical significance of these spectra when applied to food is still unclear, since they are closely related to the water content of the samples. Water content in food samples must be measured to report and interpret the interactions of THz radiation on free and bound water in food. This is important because the various investigations on food seek to determine relationships with the composition or physicochemical characteristics of food samples, and if the interaction with water is not considered, it is possible that physicochemical changes are not reported, but the interaction of THz radiation with free or bound water molecules, hence the importance of considering water content before planning any research using this technology.
Finally, it can be said that terahertz (THz) spectroscopy has emerged as a powerful tool to investigate biological systems, such as food; even the investigations only report superficial results relating certain physicochemical changes in response to the interaction of THz radiation, but, in the future, it will be necessary to take into account the interaction with water, since the advantage of using THz spectroscopy lies in the fact that dielectric response in THz region directly reflects the reorientation of water dipoles that occur on picosecond time scales, a characteristic axis of this type of radiation and crucial to complete the understanding of the complex molecular dynamics in foods, both at the physiological (fresh foods) and processing (processed foods) levels, and, thus, to follow up their changes in quality characteristics by using this non-invasive technology.

