


 Inglês (pdf)
 Artigo em XML
 Referências do artigo
 Enviar este artigo por email
 Citado por SciELO
  Similares em
SciELO
Similares em
SciELO 
 Permalink
1. Introduction
Chia (Salvia hispanica) seeds are valuable super food, because seeds have a high content of polyunsaturated fatty acids (PUFAs) (mainly α-linolenic acid (ω-3), 59.9 - 63.2%) (Oliveira-Alves et al., 2017; Salvatierra-Pajuelo et al., 2019), protein (19.0 - 26.5%) (Grancieri et al., 2019), dietary fibre (47.1 - 59.8%), phenolic compounds (mainly caffeic, rosmarinic and gallic acids) (De Falco et al., 2017; Oliveira-Alves et al., 2017) and mucilage (Muñoz et al., 2012). Consequently, chia seeds crop, originating in southern Mexico and northern Guatemala, has spread to countries such as Peru, Colombia, Argentina, Ecuador, Bolivia, Paraguay and Australia (Busilacchi et al., 2013).
Fatty acid profile of chia seeds is a routine analysis to determine the quality of seeds and to drive seeds for specifical applications in food and pharmaceuticals (Giaretta et al., 2018; Knez Hrnčič et al., 2019). For example, it is necessary to quantify the amount of omega-3 and omega-6 present in chia seeds, because its positive effect on human body by lowering the content of triglycerides and cholesterol levels, have anti-inflammatory, cardioprotective and hepatoprotective activity, antidiabetic action, and offers protection against cancer, arthritis and autoimmune diseases (de Falco et al., 2018; Grancieri et al., 2019; Mohd Ali et al., 2012; Ullah et al., 2016). Traditionally, gas chromatography (GC) alone or coupled to mass spectrometry (GC- MS) is used to quantify fatty acids in oils. Lipids are extracted from seeds by Bligh - Dyer method using methanol/chloroform mixture (Hartman, 1973). Next, lipids are esterified, added with internal standard, then injected into a GC or GC-MS (Joseph & Ackman, 1992). In addition, the free fatty acids (FFA) value is a quality parameter that allows for determining if samples were submitted to abusive storage conditions (i.e. high temperatures), which could cause nutritional and energy losses (Mata et al., 2017). For quantifying FFA in oils, samples are titrated by KOH (AOCS, 2003). Despite the high precision of GC to quantify fatty acids and the AOCS method to access FFA value, these methods are expensive and/or generate polluting chemical residues.
Currently, the food industry is modernizing, and implementing spectroscopy and imaging systems for better control of its processes and products, moving towards the well-known Industry 4.0. In this context, hyperspectral imaging (HSI) shows up with a powerful imaging technique for on-line, in-line and at-line food quality control (Caballero et al., 2020). Near-infrared hyperspectral imaging (NIR-HSI) allows simultaneously collected spectral (related to chemical composition) and spatial (related to physical properties) samples (Cruz-Tirado et al., 2020; Mendez et al., 2019). Coupled with chemometrics, NIR-HSI can be used to develop predictive models to authenticate seeds (Choi et al., 2021; Yu et al., 2021) and to estimate seed composition (da Silva Medeiros et al., 2022; Wang et al., 2021). In our previous work, we used NIR-HSI to estimate kinetic parameters and shelf-life of chia seeds by applying Multivariate Accelerated Shelf Life Testing (MASLT) (Cruz-Tirado et al., 2021). Results showed that NIR-HSI collected relevant spectral information about chemical compounds’ degradation/transformation over time under controlled storage temperature. For this reason, it is possible to estimate that NIR-HSI could be used to develop predictive models to estimate fatty acid concentrations and FFA value in chia seeds.
Thus, this work aimed to develop prediction models to quantify FFA value and fatty acids concentrations directly in chia seeds by hyperspectral imaging coupled with chemometrics. This work is a complement to our previous work, so the FFA and fatty acid profile results can be accessed in Cruz-Tirado et al. (2021), while here we basically present the predictive quantification models for FFA and fatty acids.
2. Materials and methods
2.1. Samples preparation
Chia (Salvia hispanica) seeds were donated by R&S BLUMOS Industrial e Comercial Ltda (São Paulo, Brazil) in 2019. The proximal composition declared by the producer was 31 g lipids (3.4 g saturated lipids, 19.72 g alfa-linolenic acid and 5.44 g linolenic acid), 21 g proteins, 38 g dietary fiber, < 1 g carbohydrates and 9 g moisture for 100 g of seeds. 250 g of chia seeds were stored at 25, 35 and 45 °C for 180 days in a BOD TECNAL TE-371 climatic chamber, without light incidence on the samples (Cruz-Tirado et al., 2021).
2.2. Fatty acid profile and FFA analysis
Approximately 10 g of chia seeds stored at days 0, 30, 60, 90 and 180 days were collected for fatty acid profile and FFA analysis. Chia seed lipids were extracted by Bligh-Dyer method (Hartman, 1973). Then, lipids were esterified as reported by Joseph & Ackman (1992), and the chromatographic conditions were based on Ballus et al. (2014). The separation of methyl esters was performed on a 7890A gas chromatograph (GC-Agilent, Germany) equipped with a flame ionization detector (FID). Correction factors and fatty acid concentration (mg/g oil) were calculated according to Joseph & Ackman (1992). For more details on equipment and methodology, the readers can access Cruz-Tirado et al. (2021). All samples were analyzed in triplicate.
FFA value was performed according to Ca 5a-40 (AOCS, 2003). All samples were analyzed in triplicate.
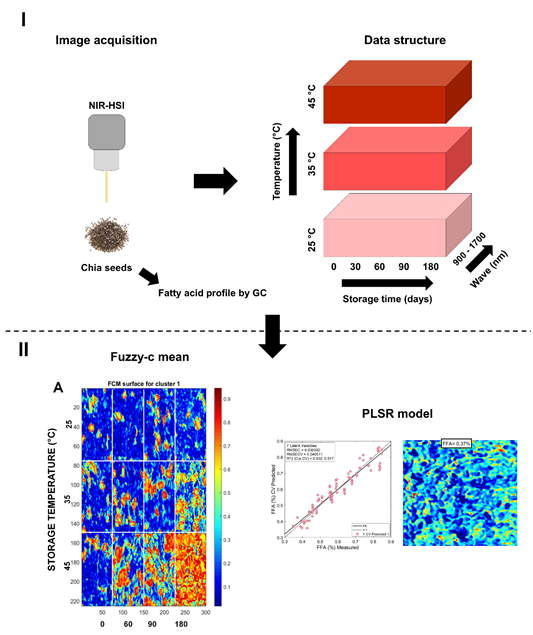
2.3. Hyperspectral imaging acquisition
Chia seeds samples collected at 0, 30, 60, 90 and 180 days of storage were dispersed on Teflon plate (~5 mm thickness) (Figure 1). Then, hyperspectral images were acquired using a SisuCHEMA SWIR hyperspectral camera (Specim Spectral Imaging Ltd, FIN-90571 Oulu, Finland), at 6.23 nm intervals in the NIR range 928-2524 nm (256 waves) with a spatial resolution of 320 pixels per line scan and spectral resolution of 10 nm. Image correction was performed using two-dimensional reference images: the dark (0% reflectance) and the white (~99% reflectance). Then, the Evince software (UmBio AB, Sweden) automatically subtracted the white and dark references from subsequently acquired images (Cruz-Tirado et al., 2021). Six samples for each time storage at each storage temperature were scanned by hyperspectral imaging (90 images). For extracted mean spectra, a self-developed code in Matlab R2016a software (The Mathworks Inc., Natick, MA, USA) was used. Standard Normal Variate (SNV) was used to correct the base line drift and light scattering, producing one mean spectrum per replicate (one spectrum per image).
2.4. Data processing
2.4.1. Fuzzy c-means analysis (FCM)
The fuzzy c-means (FCM) algorithm is well-known centroid based clustering algorithm (Bezdek, 2013), which is a generalization of hard c-means (HCM) algorithm (Hartigan, 1975). Unlike HCM, which assigns each data (each individual pixel) to a single group, FCM can assign each pixel to different groups with a certain degree of belongings called membership. FCM defines an objective function, whose objective is to minimize the objective function by minimizing the closeness between the clusters, taking into account the distance to the cluster’s centroid and the similarity of the data (spectrum of each pixel) to define the degree of membership (Verma et al., 2021). For this reason, FCM is a powerful alternative to pattern recognition, machine learning, and data mining for image analysis. In this case, we applied FCM to chia seeds hyperspectral images to explore the degradation/transformation of chemical compounds in chia seeds during storage. Chia seeds hyperspectral images were analyzed by FCM algorithm was carried out in Hypertools v.3.0 free software (Mobaraki & Amigo, 2018), available at www.hypertools.org, installed in MATLAB 2020a (Mathworks, Natick, USA) environment.
2.4.2. Partial Least Square Regression (PLSR)
PLSR was used to develop regression models to estimate FFA value and fatty acids concentrations in chia seeds hyperspectral images. The spectra of chia seeds samples were used as training set. Internal cross-validation was carried out using a leave-one-out methodology. PLSR models were developed in full spectral range (928 - 2524 nm) and in reduced spectral range based on important variables. For variable selection, interval partial least squares (iPLS) were used, which divides the spectra into variable intervals, then build PLS model for each interval, selecting the best interval (Cruz-Tirado et al., 2021;Nørgaard et al., 2000). PLSR performance was evaluated by the coefficient of determination (R2), and root mean square error (RMSE) for calibration (RMSEC) and cross-validation (RMSECV). In addition, the ratio of the standard deviation of the prediction data set to RMSECV (RPD, Residual Prediction Deviation) was evaluated. Predictive ability can be evaluated by RPD values: when RPD < 1.5 the model is not suitable for prediction, 1.5 - 2.0 means that the model can distinguish between high and low values, 2.0 - 2.5 means a model with approximate prediction ability, 2.5 - 3.0 indicates a good model for prediction and RPD > 3 suggest an excellent predictive ability (Brasil et al., 2022; Saeys et al., 2005). PLSR analysis was carried out using the PLS Toolbox from Eigenvector Research, Inc. (Manson, WA, USA), installed in MATLAB 2020a (Mathworks, Natick, USA) environment.
2.4.3. Chemical maps
To visualize the distribution of the studied chemical components (fatty acids and FFA) using the PLSR models, as well as the chemical evolution of chia seeds during storage using FCM, distribution maps or chemical maps were created. The split images were used for pixel-by-pixel prediction using the FCM and PLSR models. Then, the hyperspectral images were reconstructed to show the distribution of the components. For the prediction of fatty acids and FFA, the mean of the prediction of each pixel contained in the image was calculated.
3. Results and discussion
3.1. FCM results
FCM analysis assigned one pixel for diverse clusters (Figure 2A) based on the similarity of spectra and the distance to the center of the cluster (Figure 2B). In Figure 1, we can see the surface for the three first clusters obtained from FCM analysis. One image for each time and temperature of storage was analyzed by FCM, and the results showed the variability in pixel-to-pixel influenced by storage conditions. It is possible to observe how some chemical components degrade or transform during storage. This mainly occurs when the storage temperature is 45 °C.
In Figure 1B, the center of cluster 1 shows a peak in the spectral region 1200 - 1250 nm, related to C-H stretching second overtone (Osborne, 2006), probably associated with the presence of lipid components. Surface scores for cluster 1 show how rapidly the seeds degrade while giving way to new chemical components (Figure 1A). The components that are formed are probably glycerol and free fatty acids, which are the result of oxidation and hydrolysis reactions of polyunsaturated fatty acids (omega-3 and omega-6) (1700 - 1800 nm) (Wang et al., 2012). In the center of clusters 2 and 3, the peak around 1000 nm, associated with O-H stretching second overtone (ArOH) (Osborne, 2006), is probably associated with the degradation of phenolic components in chia seeds (caffeic, rosmarinic and gallic acids) (de Falco et al., 2018; Oliveira-Alves et al., 2017), as well as tocopherols, carotenoids and chlorophyl consumed to counteracting the oxidative reactions motivated by temperature and time storage (Cruz-Tirado et al., 2021; Mannucci et al., 2019).
Finally, during storage, the transpiration process moti vates the volatilization of free water and the availability of water for biological degradation/transformation processes. The high temperatures motivate the separation of the bound water, motivating greater mobility of the chemical components, favoring pro-oxidant reactions (Escalona-García et al., 2016).
This is observed in cluster 1, where it is possible to observe how oxidizing chemical components appear rapidly at 45 °C (red pixels), while the water volatilizes (blue pixels). In addition, it is possible to observe that the pixels assigned to cluster 1 were not assigned to cluster 2, which indicates that each cluster is capturing relevant information associated with different chemical components (cluster 1 >> pro-oxidant components; cluster 2 >> phenolic components).
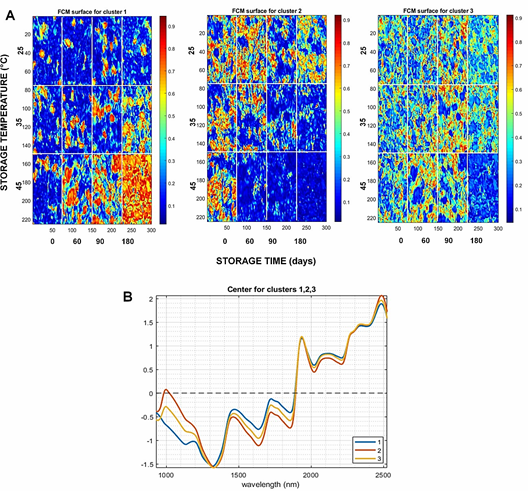
Figure 2 FCM cluster analysis: A) surface for the three first FCM cluster for chia seeds hyperspectral images; B) Centre for clusters.
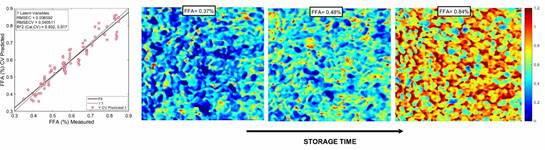
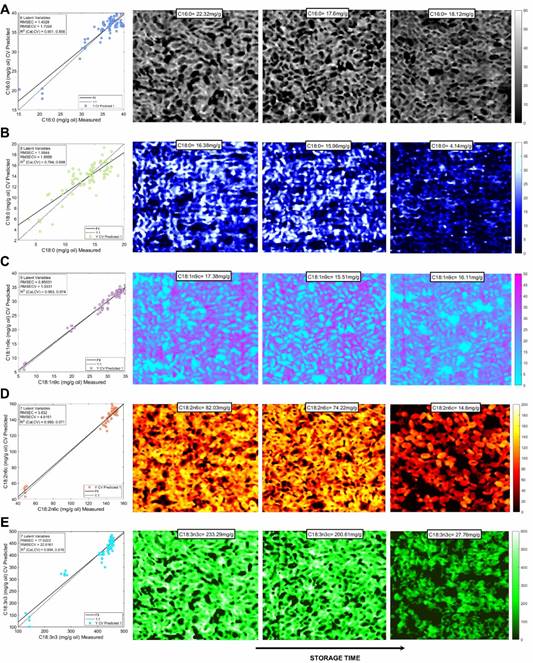
Figure 4 PLSR results and chemical maps for A) palmitic acid, B) stearic acid, C) oleic acid, D) linoleic acid, E) α-linolenic acid.
3.2. Regression models
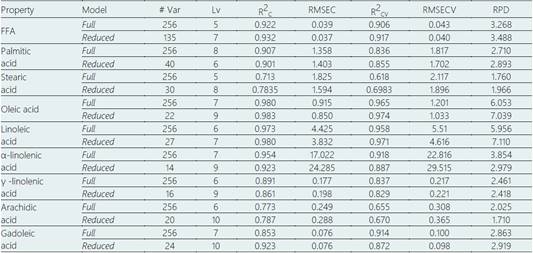
Based on spectral data, PLSR models to predict FFA value and fatty acids concentrations were calibrated and internally validate, and the results are shown in Table 1 and Figure 3 and Figure 4.
Table 1 shows the statistics for PLSR models developed to quantify FFA value and fatty acids concentrations using full spectral range and selected variables by iPLS. The performance of PLSR model to predict FFA value reached > 0.9 and RPD >3, indicating a good ability to predict FFA (Saeys et al., 2005). The chemical maps showed as FFA increased (Figure 3) in chia seeds during storage, due to oxidative reactions (Mannucci et al., 2019). In a similar way, PLSR models to predict oleic acid, linoleic acid and linolenic acid showed the best performance in both the full and reduced model. By applying iPLS, variable reduction reached 91, 89 and 94%, respectively. For oleic acid, linolenic acid (omega-6) and α-linolenic (omega-3), the PLSR models showed the highest RPD value, reflecting the great potential of hyperspectral imaging to estimate these fatty acids’ composition. Likely, this behavior is due to the high content of oleic, linolenic and α-linolenic acid in chia seeds (Cruz-Tirado et al., 2021; De Falco et al., 2017). In addition, chemical maps (Figure 4C-E) show as these fatty acids are degraded during storage by oxidative and hydrolytic reactions (Escalona-García et al., 2016).
For palmitic acid, stearic acid, and gadoleic acid, the PLSR models based on selected variables were higher than models based on the full spectra range (Table 1). The variable reduction and the increase in RPD value were 84% and 6.8%, 88% and 11.7% and, 91% and 2% for palmitic acid, stearic acid, and gadoleic acid, respectively. Based on the RPD scale proposed by Saeys et al. (2005), PLSR model on the selected variable is a good prediction of palmitic acid, stearic acid, and gadoleic acid concentration. The chemical maps for the distribution of palmitic acid and stearic acid in chia seeds are displayed in Figures 4Aand4B. Finally, the prediction of γ -linolenic acid and arachidic acid concentrations required a full spectra range (Table 1). The PLSR models reached RPD values between 2.0 - 2.5, indicating an approximate prediction ability.
4. Conclusions
Chia seeds are a valuable superfood because they have high concentrations of polyunsaturated fatty acids omega-3 and omega-6. We developed a new methodology for fast quantification of free fatty acids (FFA) and fatty acids concentration by using NIR-hyperspectral imaging and chemometrics. Fuzzy c-means (FCM) assigned the pixels in hyperspectral images to different clusters and displayed the chemical compound variations in chia seeds during storage. It was possible to observe how chemical components are degraded (i.e. phenolic compounds) and others are generated (i.e. free fatty acids) during the storage of chia seeds at different temperatures. PLSR models satisfactory estimate FFA value (= 0.917) and oleic acid (= 0.974), linoleic acid (= 0.971) and α-linolenic acid (= 0.887) concentration, reached RPD values higher than 2.0. PLSR models to predict oleic acid, linoleic acid and α-linolenic acid had the best performance. Finally, we demonstrated that NIR-hyperspectral imaging can be used as fast technology to predict FFA and fatty acids concentrations in chia seeds. Future works could study other components such as amino acids and phenolics of chia seeds during storage to verify the results obtained using NIR-HSI.

