


 English (pdf)
 Article in xml format
 Article references
 Send this article by e-mail
 Cited by SciELO
  Similars in
SciELO
Similars in
SciELO 
 Permalink
1. Introduction
Tejada (2020) indicates that quinoa (Chenopodium quinoa Wild.) is possible to be produced in the five continents due to its diversity and adaptability (i.e., able to grow from sea level to 4000 meters above sea level). Quinoa is cultivated along the whole Andes, with the center for the highest diversity of Chenopodiaceae in the Peruvian-Bolivian Altiplano region (Mujica & Jacobsen, 2006). According to Gamboa et al. (2020a), the interest in quinoa is changing the way production and consumption are done among small farmers in the Andes of Peru. Pinedo-Taco et al. (2018) indicate that recent production models are accen tuating conventional and organic options, relegating the use of mixed and traditional production systems.
Thus, in the last 10 years, because of growing international demand, cultivated areas have increased in Peru - moving from diversified production systems for self-consumption in the Andean region, to monoculture farming of improved varieties on the coast, to meet the characteristics demanded by the market (Pinedo-Taco et al., 2021) for exportation (Gamboa et al., 2018;2020a;2020b). Increases in yields are the result of the intensification of small-scale production as well as greater use of fertilizers, pesticides, and mechanization (MIDAGRI, 2021; Gamboa et al., 2020b).
Accordingly, Pando & Aguilar (2016) reported that the systems with the highest quinoa production in Peru are found in two agroecological zones: the Inter-Andean valleys (between 2500 to 3500 masl) and, the Altiplano zones (3600 to 4000 masl). In the Puno region, traditional systems of diversified and multi-varietal production for this crop are still found (Pinedo-Taco et al., 2021; Pinedo-Taco et al. 2018; and Pando& Aguilar, 2016) which take place under adverse conditions caused by high elevations (3850 meters above sea level) and the extreme climatic variations of the Peruvian Altiplano.
Jacobsen (2003); Jacobsen et al. (2003) and Ruiz et al. (2014) indicated that in the traditional quinoa producing regions of Peru, yield is limited by climatic and agroecological conditions like drought, frost, wind, hail, soil salinity and soils with low fertility. FAO (2018) pointed out that quinoa is an alternative to climate change because of its adaptability to diverse ecological levels, efficiency in the use of water and tolerance to drought. However, in the Puno region, considered the major place for quinoa production in Peru, there is limited knowledge about characterizing quinoa producers. This lack of knowledge includes insights on agricultural yields, in connection to technical efficiency in the use of productive inputs and economic performance (Khanal et al., 2018; Tenaye, 2019; Soares & Spolador, 2019, Färe et al., 1994). All applied to family farming which contributes to the preservation of ecosystems and conservation of local varieties using agroecological and traditional techniques (Zebeiro & Aguirre, 2014) coupled with difficult access to technical services (Minaya & Chinguel, 2021). This also reveals the risks of food insecurity even with respect to goods that are produced and consumed locally (Rosales &Mercado, 2020), and finally, the articulation of the local economy with market products and factors (Escobal et al., 2015).
Therefore, the objective of this study was to characterize and classify quinoa producers in the Puno region in relation to their productive, economic, and social characteristics, and to assess technical efficiency and economic performance in each of the identified groups.
2. Materials and methods
The study was non-experimental using primary and secondary sources of information. The study area was the Puno region, located in the eastern part of Peru near the border with Bolivia. Puno includes 13 provinces and 110 districts and covers an area of 71,999 km2 which represents about 6.0% of the Peruvian territory. This region consists of highlands in 61.0% of its territory, rainforest in 32.1% with widespread population groups and limited road infrastructure, an insular region of about 0.02% and the Peruvian part of Lake Titicaca in 6.9% (BCRP, 2021). The population size in 2017 was 1’172,697 people, being the urban population the majority (53.8%). The agricultural area is 4’464,473 ha (BCRP, 2021). The cultivated area of quinoa in the growing season of August 2020 - July 2021 was 36,868 hectares, and in 2020 it corresponded to 39.6% of the national quinoa production (MIDAGRI, 2021).
The declaration of the International Year of Quinoa by FAO (2015) made this grain to be considered a "superfood" because of its nutritional qualities that include good levels of proteins and micronutrients. That classification has generated growing interest in consumers in high-income countries (Escuredo et al., 2014; Nowak & Charrondière, 2016; Nowak & Charrondière, 2016; Simnadis et al., 2015). Quinoa is considered a strategic food for world food security and an income opportunity for small farmers in the Andean region (FAO & CIRAD, 2015).
The International Year also had a significant impact on na tional production as the numbers increased from 33,000 tons in 2005 to 100,000 tons in 2020. In Puno, quinoa production went from 28,000 t in 2005 to 40,000 t in 2020. For the period 2005-2020, the growth rate nationwide in quinoa production was 11.0% per year with a coefficient of variation (CV) of 0.47. In Puno, the produc tion grows at an annual rate of 3.1% with a CV of 0.17. The producer’s price, from 2005 to 2020, grew at an annual rate of 13.9%, with a CV of 0.48. This increased gradually until 2012, reaching the maximum during the quinoa boom in 2013 and 2014, and then declined (Figure 1) due to the excess of production and the reduction of the demand caused by poor production practices (Higuchi & Mercado, 2021). National production responded to price from the previous year (P-1) with a positive correlation of +0.85. In Puno, that value was found to be lower, + 0.73, because producers there reacted less to market trends and kept production more stable. Production and performance had a strong stagnation in Peru, so much so that only in the period 2005-2010 was possible to recover the dynamism of the 1950s (FAO, 2018).
The study population included 67,574 quinoa producers in Puno (CENAGRO, 2012) (Table 1). The sample size applied a design effect for the correspondence between the variance of the sampling design and random sampling. The layers were the provinces and, the districts, with a probability proportional to production and greater variability of production were selected as samples by applying formula 1 (Cochran, 2000).
 …(1)
…(1)Where: N = population size (67,574); Nh = Size of the layer h; σh = Standard deviation of production in layer h; e = Estimate error (0.03782 ha); Z = Normal distribution (1.96, 95% confidence level). With this, 409 surveys were conducted which were proportionally distributed in the provinces, according to Table 1. The surveys used (see Supplemental material 2) in the classification of the Two-Stage cluster, the technical efficiency and the economic performance analysis were 361 and they enabled to improve the database to an estimation error e = 0.04027 ha.
To classify quinoa producers of Puno in groups, with characteristics like the inside of their own groups and different from those found in other groups, the typologies of family farming described by CENAGRO (1994), and the National Strategy for Family Farming (MINAGRI, 2015) were used. They apply productive, economic, and social variables described by the Commission for the Typology of Agriculture of the International Geographical Union, prioritized by Mercado et al. (2020).
In Peru, MINAGRI (2015) classifies family agriculture as: (i) Subsistence family agriculture, more oriented towards self-consumption, availability of land but with insufficient production to guarantee family sustainability, which leads members to look for work outside their place or within agriculture; (ii) Intermediate family agriculture, with greater dependence on own production, has better land and resources that allow them to achieve family support, but has difficulties in generating surpluses; and (iii) Con solidated family agriculture, based on its own production, uses resources with greater potential, has access to markets, generates surpluses which are capitalized. In relation to these economies, Liceaga (2021) and Landini (2011), described, among their main characteristics -- the adoption of family or community work, the difficulties in accumulation, a significant agricultural input in income, limited availability of technology, the search of reducing risks before maximizing profitability, and the sale of agricultural products or labor. Mercado et al. (2020) emphasize the need of setting up typologies given the heterogeneity that they present in the territory and the double economic estimate that comes from family units of production and of consumption.
Thus, a Two-Stage cluster method was used to group the data and generate an optimal number of clusters. Euclidean distances allow us to identify to what degree each pair of observations have a greater similarity and belong to the same group, given the objects I1, I2… In; measured according to variables x1, x2..., xn, their distance was obtained according to equation 2.
 …(2)
…(2)The determining variables for the classification of homogeneous clusters were: Productive: use of organic fertilizer (island guano, manure, compost, etc.); weeding, use of fertilizers (ammonium nitrate, ammonium sulfate, urea, etc.), application of fungicides or insecticides; total area of all crops in ha; total area of quinoa cultivation in ha; quinoa yield quantity expressed in t; use of equipment in hours/ha; labor in hours/ha. Economic: Quantity of quinoa production destined for self-consumption in t; quantity of quinoa production destined for sales in t; source of income of the head of household; net economic benefit in Peruvian soles. Social: Spoken language; the age of the head of household.
The evaluation of the cluster analysis considered multicollinearity between cluster variables and, the multivariate classification model was estimated in two phases (Rubio-Hurtado & Baños, 2017). The statistical software SPSS validated the precision of the clusters, and the silhouette measures of cohesion and separation, and determined the importance of the variables for each group. The continuous variables assumed a normal distribution, the categorical variables were multinomial and independent. The variables were subjected to an ANOVA test to determine the difference in efficiencies between the groups, test the variances between them, and estimation of p-values at a significance level of 0.05 for each one of them.
Technical efficiency is commonly assessed using Data Envelopment Analysis (DEA) and Stochastic Frontier Analysis (SFA) (Nguyen et al., 2019; Guesmi et al., 2015) to verify the use of the least inputs to produce, given technology, the greatest quantity of products within a frontier of efficient production. Inefficient producers would be unable to find that frontier (Mamiit et al., 2020).
This study used a Stochastic Frontier model calculated with Stata Software, where a Cobb-Douglas behavior function was postulated, assuming noise disturbances (symmetric). A probabilistic distribution was formulated for the technical efficiency disturbances (semi-normal) to analyze them by producer’s clusters. According to Debreu (1951) and Farrell (1957), technical efficiency from “x” and “b”, vector of N inputs used in production and vector of technological parameters, within the amount of product yi = f (xi; b), from which equations 3and4 were obtained.
 …(3)
…(3)
 …(4)
…(4)Yi reaches its maximum possible value at TE = 1. From the Cobb-Douglas function, it is disaggregated considering compounded error εi = v_i + μ_i in equation 5, with the definition in 6:
 …(5)
…(5)ßi is defined:
 …(6)
…(6)Where: logyi = logarithm of quinoa yield in t⁄ ha; logx1 = logarithm of the total area cultivated in ha; Logx2 = logarithm of labor in hours per ha; Logx3 = machinery logarithm in hours per ha; Logx4 = logarithm of quinoa seeds in kg⁄ ha; x5 = age of the head of the household; vi: stochastic error, collects the impact of effects that are not under control, presented normal distribution N (0, σ 2 v); ui: technical efficiency index, non-negative and asymmetric, technical inefficiency of semi - normal distribution, since the output can only decrease below the limit (equation 7).
 …(7)
…(7)
Table 1 Provinces of Puno with variables of planting (ha), yield (t), number of producers and number of surveys applied by provinces
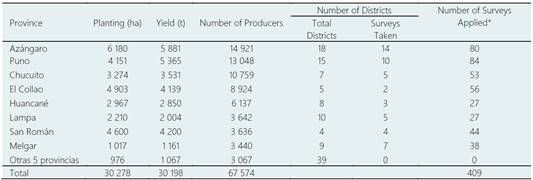
Source: IV CENAGRO 2012 for surveys applied in October 2017, see Figure 2 (Map).
The stochastic frontier parameters and technical efficiencies were estimated for each unit involved, arranging them to detect the most efficient of the clusters formed. The significance (p-value) of the variables was also analyzed. The technical efficiency for each unit involved (Efficiency) was evaluated, considering the qualitative variables involved in the formation of groups in the Two-Stage cluster and the variable sales. Regression is defined in equation 8, considering equation 9.
 …(8)
…(8)
 …(9)
…(9)The variables defined that include dummys which take the value of one and two are as follows:
Efficiency = efic_gen3 = individual technical efficiency
d1 = 1 received training, d1 = 2 if not; d2 = 1 received credit in the last campaign, d2 = 2 if not; d3 = 1 belongs to an association, d3 = 2 if not; d4 = 1 performs fertilization, d4 = 2 if not; d5 = 1 applies fertilizer (organic), d5 = 2 if not; d6 = 1 applies fertilizer and manure (organic), d6 = 2 if not; d7 = 1 performs weed control, d7 = 2 if not; d8 = 1 applies fungicide or insecticide, d8 = 2 if not; d9 = 1 puts quinoa for sale, d9 = 2 if not.
The parameters were estimated with linear regression and, the variables were contrasted at a significance level of 0.05 (p-value) to validate those that limit technical efficiency.
To assess economic performance, an ANOVA model was calculated using SPSS Software. Classification variables from the Two-Stage Cluster were added to determine whether they can discriminate among identified groups. The economic benefit that producers would have from selling all the quinoa production was considered, and the results of the groups were included in the ANOVA test to review differences in economic benefits between groups at a significance level of 0.05.
3. Results and discussion
3.1 Characterization of the quinoa producers in Puno
The characterizations, based on the surveys, found that for crop management: 24% of the producers apply organic fertilization, 51% use plowing, 86% apply harrow and 11% do level. At planting, 62% make rows and 33% do coverings; 48% use chemical fertilizers, 20% perform hilling, 67% do weed control and 18% apply fungicide or insecticide. There was a low percentage doing leveling and using fungicides or insecticides. Recommended amounts of seed to use are between 15 to 20 kg per ha (Pando & Aguilar, 2016); the survey found that 54% use less than 15 kg/ha, 13% between 15 to 20 kg/ha, and 32% more than 20 kg/ha, so seeds are either underutilized or overused. It was found that 3% receive financing, 3% have organic certification, 5% have access to technical assistance, 8% receive training, and 7% belong to an association (although 99% belong to the community). Access to technical services and support for quinoa production are quite low.
The main source of income comes from working in agriculture for 87% of the heads of household surveyed. Sources of income from other jobs varies between 4 and 13% of the total. Regarding the use of lands for crop production, 75% indicated that they own the land, 18% have property titles, 21% have deeds and 36% do not have property titles. About 20% cultivate on community land and rented properties.
For harvest and postharvest activities, 98% of the responders indicated that they follow traditional activities such as generation of arches, 97% manual selection, 97% threshing, 75% postharvest drying, 97% manual selection of grains and 87% place quinoa at storage places.
The average quinoa yield for the 2017 harvest was 1.0 t/ha, higher than the 0.96 t/ha reported in 2016 (MINAGRI, 2017). From the surveys, 57% indicated that they allocate their production to self-consumption, 43% consume and sell, emphasizing the logic of production linked to local self-consumption. The sale of the crop is made to different mediators who then transport the quinoa to nearby cities of Puno and Juliaca. The producers get different prices according to the sale’s agent. The price is higher when the crop is destined to mills and processing companies. The sale is in bulk with the grains washed and cleaned, so that the price varies accordingly (Table 2). Of the total crop sold, 6.3% have organic certification, receiving a price of S/. 3.8 /kg in bulk.
The III CENAGRO (1994) classifies the producers by the size of their property: smallholder if the size is from 0 to 2.99 ha, small producer between 3 and 9.99 ha, medium producer between 10 and 29.9 ha, and large producer if the property is greater than 30 ha. This study found that 98% of the quinoa producers were smallholders and small producers, only 2% were medium-sized and, existence of large producers was not corroborated. Small areas for quinoa planting were found to be predominant, with an average size of 0.40 ha (Table 3). The economic benefits came from production destined to sales and self-consumption; benefits were valued by the local producer's price and the costs incurred in production. A study done by Mercado & Ubillus (2017) reported that smallholder producers obtained an averaged net economic benefit of S/. 116 Peruvian soles, the small ones S/. 815, and the medium ones S/. 1,294 (Table 3).
Table 2 Quinoa sales agent, form of sale and price per kg
| Sales to Agent | % | Price/kg | Sale Type | % | Price/kg |
| Wholesalers in Puno and Juliaca | 71,4 | S/. 3,1 | Grain at harvest | 57,1 | S/ 3,0 |
| Wholesale or Local Mediators | 10,9 | S/ 3,5 | Washed | 1,1 | S/ 5,3 |
| Mill, Procesing Company | 4,6 | S/ 4,3 | Cleaned | 33,1 | S/ 3,6 |
| Others and not defined | 13,1 | Undefined | 8,6 | ------- | |
| 100,0% | 100,0% | S/ 3,3 |
Source: This study. Based on 409 surveys from October 2017.
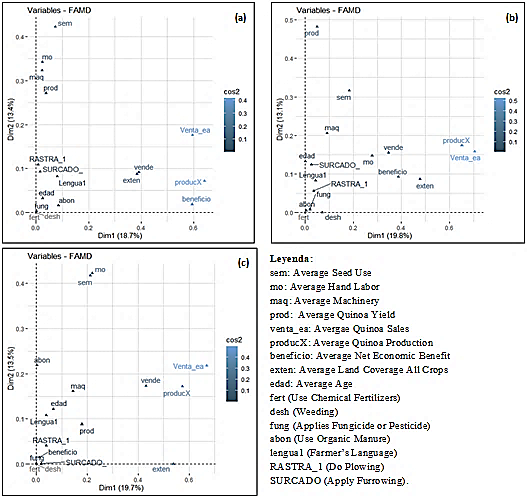
Figure 1 Classification of groups of Puno producers determined by Factorial Analysis of Mixed Data. (a) Group 1 Moderate Performance with Weeding. (b) Group 2 of Good Performance. (c) Group 3, Moderate Performance No Weeding. Source: from 361 surveys conducted in quinoa producers in Puno in October 2017.
In the classification of family farming (FF) conducted by MINAGRI (2015), 57% were subsistence FF, 38% were intermediate, and 4% were consolidated FF. The net economic benefits, considering income from total production destined for sales at the local price, showed that consolidated FF had a higher net economic benefit in relation to intermediate and subsistence FF (Table 3).
3.2 Homogeneous clusters of quinoa producers in Puno
The assessment with the Two-Stage cluster analysis identified three groups of producers with the following seven influential variables used in the classification: Uses chemical fertilizers (yes / no); does weed control (weeding) (yes / no); use organic compost (yes / no); apply fungicide and insecticide (yes / no); total quinoa production (t); total area for all crops (ha); and net economic benefit (soles). The ANOVA test was significant for quinoa production (t) (p = 0.03), crop’s total area (ha) (p = 0.05), economic benefit (Peruvian soles) (p = 0.034), labor (hours/ha) (p = 0.011), sale of quinoa (t) (p = 0.020) and age (p = 0.000).
Table 3 summarizes the results of the Two-Stage cluster. Some significant variables of interest were incorporated in the ANOVA test. Each group of quinoa producers was named according to their main characteristics. Thus, group two is "good performance" (GP) which exhibited better indicators in quinoa production (t), total area of all crops (ha), and net economic benefit (soles). It also had higher percentages in two other cultural activities. Group one was called “moderate performance with weeding” (MPwW) to differentiate it from the group three “moderate performance without weeding” (MPwoW). In the latter, the continuous classification variables were below the general average.
In group one (MPwW), 100% of producers do not use chemical fertilizers or carry out weed control, and they have fewer hours/ha of use of machinery. This group is ethnically composed of Quechua (52%) and Aymara (48%) farmers, about 65 % of producers do not sell quinoa and 71% allocate most of their production for self-consumption. In group two (GP), 100% of producers use fertilizers, 74% do weed control, have a higher-than-average yield of quinoa (0.18 t) and, total area of crops (1.90 ha). GP has a greater net economic turnaround, makes greater use of labor (441 h/ha), does better in quinoa sales (0.068 t), performs more harrowing (92%), uses more machinery (26.2 h/ha) and seed (24,0 kg/ha). This group mostly includes Quechua farmers (67%) and allocates a higher proportion of their production for sale (38%). In group three (MPwoW), 100% of producers use fertilizers, but do not confirm if they do weed control, more than 95% do not use organic fertilizers or apply fungicides or insecticides, they are younger (average age of 48.5), they carry out more furrowing (80%), they are mostly Aymara (57%) and have lower yields (Table 4).
Based on the classification of the three groups recognized by the Two-Stage Cluster (Table 4), and the factorial analysis for mixed data shown in Figure 1, the variables that have the greatest influence on the classification of each group were identified, as well as those that differentiate among the groups formed (See Supplementary Material 3a and 3b).
Figure 1 shows, for example, that the benefit variable is more important for the classification of group 1 (MPwW), it is less important for the classification of group two (GP), and it is not very relevant for the classification of group three (MPwoW). In that context, although all the groups of producers work for self-consumption, the producers of group three (MPwoW) are the ones who cultivate the most quinoa for self-consumption. Therefore, this variable is not significant for that group of producers. The variable sem (average use of seeds by quinoa producers) is more significant for classifications in groups 1 and 3, but less significant in group 2. The variable producX (average production of quinoa) is important for all the three groups of producers.
Table 3 Classification according to III CENAGRO 1994 and according to MINAGRI (2015), Total area of Agrarian Unit (A.U..) of the quinoa producer of Puno

Source: Based on 409 surveys carried out in October 2017. The reference to the classification of producers is from III CENAGRO (1994) and MINAGRI (2015).
Table 4 Results of the three groups identified including variables of typification of groups, size of the groups and other variables
| Identified Groups | Group 1, Moderate Performance with Weeding | Group 2, Good Performance | Group 3, Moderate Performance without Weeding | General Average (Three Groups) |
| Typification Variables | ||||
| Use chemical fertilizers | No (100%) | Yes (100%) | No (100%) | No (52.08%) |
| Make weed control (weeding) | Yes (100%) | Yes (74.4%) | No (100%) | Yes (66.50%) |
| Use organic manure | No (67.9%) | No (72.7%) | No (96.4%) | No (76.73%) |
| Apply fungicide or insecticide | No (81.1%) | No (73.8%) | No (97.6%) | No (81.66%) |
| Average of Quinoa Production (t) | 0,13 | 0,18 | 0,12 | 0,15 |
| Average total area of all crops (ha) | 1,48 | 1,90 | 1,28 | 1,64 |
| Average Net Economic Benefit (soles) | 76,79 | 95,17 | 38,35 | 76,71 |
| Size | ||||
| Number of Producers Surveyed | 106,00 | 172,00 | 83,00 | 361 |
| Percentage size (Surveyed) | 29,4% | 47,6% | 23,0% | 100% |
| Significant Variables from ANOVA | ||||
| Average Labor (hours/ha) | 320,56 | 441,20 | 249,84 | 361,78 |
| Average Quinoa Sales (t) | 0,043 | 0,068 | 0,036 | 0,053 |
| Average Age (years) | 55,13 | 55,26 | 48,53 | 53,67 |
| Others | ||||
| Do Plowing | Yes (80,1%) | Yes (91,8%) | Yes (83,1%) | Yes (85,6%) |
| Make Rows | Yes (51,1%) | Yes (64,1%) | Yes (79,5%) | Yes (62,1%) |
| Average use of machinery (hours/ha) | 23,75 | 26,24 | 23,86 | 24,96 |
| Average Seed (kg/ha) | 22,84 | 23,87 | 19,02 | 22,45 |
| Sale of Quinoa Production | No (65,1%) | No (50,6%) | No (63,9%) | No (57,21) |
| Farmer’s Language (percentage) | quechua (51,9) | quechua (66,9) | aymara (56,6) | quechua (56,2) |
| Average Quinoa Yield (t/ha) | 0,92 | 1,02 | 0,75 | 0,93 |
| Average Sale/Production (%) | 33% | 38% | 30% | - |
| Average Self-Consumption/ Production (%) | 71% | 61% | 70% | - |
Source: from 361 surveys conducted in quinoa producers in Puno in October 2017.
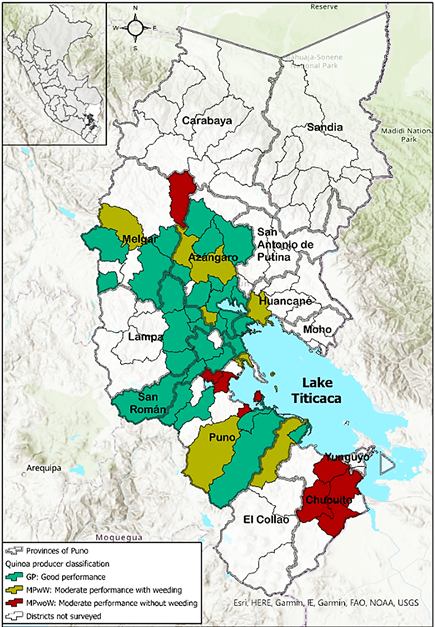
Figure 2 Classification of Quinoa Producers in Puno based on the Two-Stage Method. Source: from 361 surveys conducted in quinoa producers in Puno in October 2017.
The groups identified exhibited geographic diversity (Figure 2). The southern area (Aymara area) is more diverse compared to the northern area (Quechua) where the Good Performance (GP) group is predominant. In the provinces of Lampa (79%), Azángaro (74%), San Román (56%) and Huancané (54%), the group two (GP) is prevalent. Groups one (MPwW) and three (MPwoW), with moderate performance, are predominant in the provinces of Chucuito (83%), Collao (62%), Melgar (65%) and Puno (60%). Group one MPwW is more prevalent in Collao (49%) while group three MPwoW in Chucuito (60%).
Following the CENAGRO III classification (1994), group two (GP) showed a lower percentage of smallholders compared to groups one (MPwW) and three (MPwoW) (Table 5). In the circumlacustre (bordering the lake) zone, smallholders predominate but in the continental zone, they are more diverse. In the south, smallholders are the majority, and, in the north, they are more diverse. According to MINAGRI (2015), group two (GP) has the highest percentage of intermediate FF and the lowest percentage of subsistence FF. While groups one (MPwW) and three (MPwoW) do not have consolidated FF but have higher subsistence FF. In the circumlacustre zone, subsistence FF predominates. Subsistence FF is prevalent to the south and Intermediate FF to the north. In the Aymara zone, they are mostly subsistence FF while the Quechua zone is more diverse.
Table 5 Results of classifications according to MINAGRI 2015, III CENAGRO 1994 in the groups identified
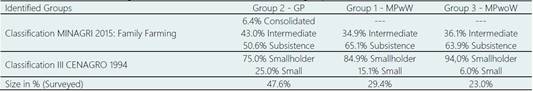
Group 1: Moderate Weeding Performance (MPwW). Group 2: Good Performance (GP). Group 3: Moderate No Weeding Performance (MwoWP).
Source: From 361 surveys conducted in quinoa producers in Puno in October 2017.
3.3 Technical efficiency by types of quinoa producers
The general technical efficiency of the producers was found to be significant and differed among the groups identified. The corresponding results are shown using equation 5 of the stochastic frontier analysis (see Supplementary Material 4).
The Prob> chi2 = 0.000 indicates that all the coefficients (βi) are different from zero, it rejects the hypothesis that all the estimated parameters are equal to zero (βi = 0). Individually, p = 0.000 in the total area of the crops in ha (log total area) and, p = 0.00 in the number of seeds in kg/ha (log_sem) are significant. Thus, a reduction in the total area of crops in ha (log_total area) by 1% would increase the quinoa yield in t/ha (log_prod) by 0.4279%. An increase in the number of seed in kg/ha (log_sem) by 1% would increase quinoa yield by 0.113% calculated in t / ha (log_prod). Previous literature has indicated that the use of the optimum number of seeds can enhance yield and technical efficiency (Mercado et al., 2020) as well as the use of agricultural inputs and the access to markets (Gamboa et al., 2020b). De Koeijer et al. (2002;1999) pointed out that, if the farmers improve technical efficiency in the use of inputs such as pesticides or herbicides, it can give them options to concurrently achieve economic goals and sustainability.
The average technical efficiency found among quinoa producers evaluated in Puno was 0.474 within an interval of 0.0076 and 0.8107. Group two (GP) was the most technical efficient (average = 0.5025), while groups one (MPwW) and three (MPwoW) had similar values of technical efficiency (0.4464 and 0.4504, respectively). These assessments revealed low technical efficiency in group and at individual levels which were validated by the variables: use of seeds, yield, fertilizer, and sale. Hence, an increase in the total area of quinoa and a higher quantity of seeds would increase yield.
By establishing a possible baseline of efficiency in the study area, the individual efficiency of producers can be compared which evidenced that there were low levels of individual technical efficiency because producers with technical efficiency greater than 0.70 only represented 13.3% of the interviewed (see Supplementary Material 5).
At the international level, Khanal et al. (2018) estimated technical efficiencies in three different agroecological regions of Nepal, this study considered as output the total economic value of the collective production of cereals, legumes, and oilseeds. The level of technical efficiency at each regional border was 86%, 81%, and 78% (with an average of 82% for all producers). Technical efficiency considering only production for self-consumption revealed values of 91%, 74%, and 78% in each region.
At the national level, Coras (2014) indicated that the technical efficiency found among quinoa producers in Junín was positively correlated to the levels of education, access to irrigation systems, and the lease of agricultural land. The total average for efficiency was 80%, with 84%, 76% and 75% for the four classified groups. Mercado et al. (2020) also estimated the technical efficiency for groups of quinoa producers in Junín which were: 77%, 66%, 67% and 65% (with an averaged efficiency of 67% for the total of producers).
Both studies showed technical efficiency values that were higher than those estimated for Puno (47.4% efficiency on average). Even if the efficiency of each group was considered, these assessments suggested that the results of technical efficiency in rural economies, where self-consumption is important, would not be sufficient to conclude on a rational pro-market behavior because the primary orientation of production is not the market but food security.
Similarly, according to Liceaga (2021) and Landini (2011), family economy is characterized as a small-scale economy and structured on a family basis. In Puno, 80% of quinoa producers are smallholders and that 85% get their income from their own productive unit. Their technical efficiency is characterized for limited availability of resources (water, fertile soils, and biodiversity) compared to other producing areas with more favorable conditions. This region is exposed to extreme environmental variations since cultivation is done over 3800 masl.
On the other hand, technical efficiencies in relation to the dichotomous variables revealed an R-squared of 89.4%. All the coefficients (yi) were different from zero (Prob> F = 0.000). Individually, only some of the variables were significant. Thus, those who use fertilizers (p = 0.022) have 0.04809 points of greater technical efficiency than those who do not, and those who use quinoa for sale (p = 0.000) have 0.0900 points of greater technical efficiency than those who do not (See Supplementary Material 6).
On the other hand, Soares & Spolador (2019), Khanal et al. (2018); and Melo-Becerra & Orozco-Gallo (2015) indicated that if different production technologies coexist, technical efficiency cannot be directly compared to the same production frontier that holds all production units because decisions are taken with different combinations of inputs - outputs. In those cases, Hayami, (1969) and Hayami & Ruttan (1970) assumed that producers have potential access to several production technologies and choose some. It allows the estimation of technical efficiency within each production system or group of producers, but not for all of them since they all are not homogenous in the use of production technologies.
Finally, the averages of net benefits (Peruvian Soles) differed statistically between the groups as identified with the ANOVA test (p = 0.034) at a significance level of 0.05. The highest was found in group two (GP) at USD 29 or S/. 96, followed by group one (MwWP) at USD 24 or S/. 78 and the lowest in group three (MwoWP) with USD 12 or S/. 39. Thus, the groups show differentiating variables in the use of fertilizers, weed control, organic fertilizer, the application of fungicides or insecticides, the production of quinoa (t), total area of all crops in ha, and, the net economic benefits (in Peruvian Soles). Group two (GP) differs from the other groups in technical efficiency, sale, quinoa production, and total crop area. Group one (MwWP) and group three (MwoWP) have similar values of technical efficiency, they do not use fertilizers, and have lower values in the sale of quinoa, the production of quinoa, and the total area for all crops. Based on the above, in the case of Puno, it is evident that the economic performance of the producers in that region is not relevant for defining their classification because, although it is true that sales are important for technical efficiency (i.e., the groups that interact more in the markets would yield better indicators), all the producers in rural areas devote a large part of their production to self-consumption. Therefore, this productive activity is the main driver of local food security.
4. Conclusions
The Peruvian Altiplano is the main center of origin and diversity of quinoa, even though cultivation is done under adverse climatic and agroecological conditions. Cultivation is carried out by small and diverse producers who apply traditional practices with limited use of inputs, and with the main purpose of promoting local food security.
The discriminating variables for the classification of producers in Puno were: use of external inputs, total area of cultivation, productive practices, and economic benefit. The group performing the best were mostly Quechua farmers who showed to allocate a relatively high proportion of quinoa for sale. In the other groups, the use of external inputs was found to be incomplete and was mostly composed of Aymara farmers who largely use quinoa for self-consumption. The identified groups showed geographic diversity, the southern zone (Aymara) is more traditional and diverse, with predominant agriculture for subsistence and small areas for farming. In the northern zone (Quechua) the percentage of smallholders is lower.
The general technical efficiency found in the producers was low (0.474) and between groups, the distance was not substantial (0.5025, 0.4464 and 0.4504, respectively). This revealed low technical efficiency in group and at individual levels which were validated by the variables: use of seeds, yield, fertilizer, and sale. Thus, an increase in the total area of quinoa and a higher quantity of seeds would increase yield.
Although it is possible to increase yield and technical efficiency through better allocation of inputs, this has a realistic regional limit. From that perspective, public policies enabling better access to technical services such as financing, training, technical assistance, quality seeds, irrigation, among others, should be considered.

