


 Inglés (pdf)
 Articulo en XML
 Referencias del artículo
 Enviar articulo por email
 Citado por SciELO
  Similares en
SciELO
Similares en
SciELO 
 Permalink
1. Introduction
Fresh cheese (FC) is a widely consumed product with a high nutritional value and pleasant sensory characteristics, the quality of which largely depends on the milk composition and manufacturing process (Farkye, 2004; Hnosko et al., 2009). Generally, FC contains 41% - 59% moisture, 17% - 21% protein, 18% - 29% fat, 1% - 3% salt and pH 5.3 - 6.5. Due to the high moisture content and pH, FC is characterized by having a reduced shelf-life (3 -7 days) (Hnosko et al., 2009; Zamora et al., 2012). Besides allowing the growth of spoilage microorganisms, these characteristics also increase the risk for pathogenic microorganisms’ development in FC (Fox et al., 2015; Pimentel-Filho et al., 2014), such as Staphylococcus aureus, which is one of the most important foodborne pathogens. S. aureus produces toxins in milk, which can be present even after pasteurization and cause food poisoning (Bovo Campagnollo & Sant’Ana, 2022; Dai et al., 2019). In 2020, the European Food Safety Authority (EFSA) reported 45 foodborne outbreaks caused by S. aureus toxins in Europe, resulting in 414 cases and 32 hospitalizations (European Food Safety Authority (EFSA), 2021).
Pasteurization of milk before cheese manufacturing is the most important procedure to reduce spoilage and pathogenic bacteria in cheese (Bovo Campagnollo & Sant’Ana, 2022). Overall, during cheese manufacturing, the interaction of intrinsic (moisture, pH and acidity, nutritional content, redox potential and presence of antimicrobial compounds) and extrinsic factors (type of packaging, storage time and temperature, and the manufacturing process) determine the capability of this microorganism to grow in cheese (J. D’Amico & Donnelly, 2017). Thus, developing new procedures to preserve the microbiological quality of milk and cheese is a frequent concern for the dairy industry. In addition, there is a growing tendency for the use of green technologies in food processing and preservation to obtain food products considered “more natural” by consumers. This is because of consumers' negative perception about food products using synthetical additives such as synthetical preservatives in their formulations (Falleh et al., 2020). Hence, the food industry, particularly the dairy industry, needs to find alternative technologies for food preservation as well as to attend the current tendency of the consumer market looking for the use of natural compounds with antimicrobial properties, such as bacterial peptides and essential oils, would be excellent alternatives.
Nisin is a bacteriocin-like peptide synthesized by several strains of the lactic acid bacteria Lactococcus lactis subsp. lactis (de Arauz et al., 2009) and has a broad spectrum of antimicrobial action mainly against Gram-positive bacteria such as Lactococcus, Lactobacillus, Streptococcus Staphylococcus, Micrococcus, Pediococcus, Listeria, Bacillus, Clostridium and acid-fast Mycobacterium (Małaczewska & Kaczorek-Łukowska, 2021). Nisin is already used in the food industry as it is recognized as a safe preservative by the US Food and Drug Administration (FDA) and the European Food Safety Authority (EFSA) because of its natural origin, non-toxicity, and easy digestion (Carocho et al., 2015; Gharsallaoui et al., 2016). According to the Codex Alimentarius, the allowed level of nisin in unripened cheeses, such as FC, has been set to 12.5 mg/kg (FAO/WHO, 2021).
On the other hand, in the last decade, there has been a growing interest in applying essential oils (EOs) in food preservation due to their natural origin and biological properties, such as antimicrobial and antioxidant (Falleh et al., 2020; Pandey et al., 2017). Moreover, EOs also can provide taste and flavour to food products, improving their sensory characteristics. An EO is a complex mixture of several aromatic and volatile compounds, which are synthetized by the secondary metabolism of plants (Hyldgaard et al., 2012). EOs can be obtained from several parts of plants by different extraction methods, such as hydrodistillation, steam distillation, supercritical fluid and cold press (Stratakos & Koidis, 2016). Several studies have reported that EOs have antimicrobial activity against several food spoilage and foodborne pathogenic microorganisms (Akarca, 2019; Ju et al., 2019; Klein et al., 2013). However, EO antimicrobial activity varies depending on the type of EO as well as the susceptibility of the microorganisms (Pandey et al., 2017).
Particularly, oregano (Origanum vulgare) EO (OEO) has been described as an excellent additive for food preservation due to its biological properties. OEO is rich in carvacrol but contains thymol in a lower amount, which are responsible for its odor and the broad antimicrobial and antioxidant activity (Rodriguez-Garcia et al., 2016; Teixeira et al., 2013). Some studies have reported the effectiveness of OEO in preserving the sensory, chemical and microbiological quality of several food products when OEO is applied in their processing as an additive, such as in meat (Boskovic et al., 2020) and bakery products (Passarinho et al., 2014). Specifically, a few studies have reported the effectiveness of OEO in preserving the microbiological and sensory quality of dairy products, such as cheese (Asensio et al, 2015; Olmedo et al., 2013).
FC is particularly susceptible to spoilage because its high humidity, which is favourable for microbial growth. To guarantee this product's safety from processing to consumption (Coelho et al., 2014), natural compounds are used as food preservatives. Thus, this study aimed to eval uate the effect of nisin and OEO on the inhibition of S. aureus growth in cow’s milk and the aim of this study was to evaluate the effect of nisin and OEO on the inhibition of S. aureus growth in cow’s milk as well as to determine their effects on the microbiological, physicochemical and sensory quality of FC produced with cow’s milk treated with nisin and OEO.
2. Materials and methods
2.1. Experimental set-up
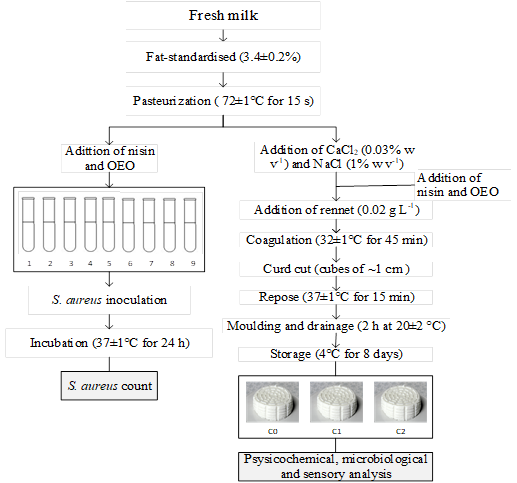
The experiments were performed according to the flow chart shown in Figure 1. Firstly, different concentrations of nisin and OEO were added to milk generating nine treatments (Table 1). Next, the two treatments, which caused the highest inhibitions of S. aureus in milk were selected for FC manufacturing. Additionally, a treatment without the addition of nisin or OEO was considered as the control.
2.2. Milk
Fresh cow milk was purchased from a local breeder from the “La Hoyada” farm (Yacango, Torata, Moquegua, Peru). Next, milk (3.4% ± 0.2% fat) was pasteurized at 72 °C for 15 s in glass bottles using a thermostatic bath (YCW-10E model; Gemmy industrial corp., Taiwan).
2.3. Screening of the antibacterial effect of nisin and OEO in milk
2.3.1. Preparation of nisin/ OEO stock solutions
Nisin powder from Lactococcus lactis at 2.5% m m-1 nisin content and potency ≥ 106 IU g-1 (Sigma-Aldrich, code N5764, USA) were used in this stage of the study. The nisin stock solution was prepared by dissolving 0.1 g of nisin powder in 10 mL of 0.02 M HCl to obtain a concentration of 104 IU mL-1 (stock solution). This solution was heated at 80 °C for 7 min and kept at -20 °C until use. Concentrations of 250 and 500 IU mL-1 were prepared from the stock solution of nisin. Regarding the OEO, a commercial sample was purchased from Merck Peruana SA (Sigma-Aldrich, code W282812, USA). Concentrations of the OEO were prepared at 0.025 and 0.05% in 100 mL of pasteurized milk according to the method proposed by Hebishy (2013), which consisted of mixing 20% OEO and 3% sodium caseinate (110, Zeus Química, Barcelona, Spain) and then adding it to the milk.
2.4. Activation of S. aureus and milk inoculation
Freeze-dried pellets of S. aureus subsp. aureus (code 0485E7, ATCC® 6538TM) were activated in 10 mL of sterile phosphate-buffered saline solution (pH 7.2) previously heated to 36 °C. This suspension was placed in an incubator (Binder BD53, Germany) at 37 °C for 30 min for its complete hydration. Then, the hydrated material was stirred until a homogeneous suspension. Approximately, the suspension had 106-107 CFU mL-1. Later, 1 mL of the homogeneous suspension was transferred to 9 mL of cooled pasteurized milk with different concentrations of nisin and OEO (Table 1). The resulting suspensions were mixed using a vortex shaker (Velp Scientifica F202A0175, Italy) at 1800 rpm for 20 s. Then, the samples were incubated for 24 h at 37 ± 1 °C. Three replicates were made for each treatment.
2.5. Staphylococcus aureus count
The S. aureus count in milk samples containing nisin and OEO was performed using 3MTM PetrifilmTM Staph Express plates (AOAC, 2003.08) after incubation, according to the procedures recommended by the manufacturer (3M Microbiology, USA). Previously, 10‐fold serial dilutions (10-1 -10-4) in sterile peptone were made, and 1 mL of each dilu tion was plated in the center of a petrifilm plate and gently spread out on the circular area of the plate. Next, plates were incubated at 37 ± 1 °C for 24 h. CFU counting was performed in duplicate and expressed as Log CFU mL-1.
2.6. Production of FC
Batches of 9 L of milk were pasteurized and cooled until manufacture. At the beginning of cheese manufacture, the milk was heated at 32 °C and manually stirred. Then, CaCl2 (0.03% w v-1) and NaCl (1% w v-1) were added. Milk coagulation was obtained with 0.02 g L-1 of rennet Chy-Max Powder Extra NB (activity ≥ 2080 IMCU g-1, chymosin 100%, Chr Hansen SA, Denmark) at 32 ± 1 °C for 45 min. Then, the curd was cut into cubes of ~1 cm and kept at 37 ± 1 °C for 15 min. The curd was molded in polyethylene containers (500 g, Primo SAC, Brazil), and the whey was drained in the same mold for 2 h at 20 ± 2 °C, according to Figure 1. The packaged cheeses were stored at 4 °C for 8 days.
Three types of FC were manufactured as follows: cheese made of milk without nisin or OEO (negative control, C0), cheese made with milk added of 500 IU mL-1 of nisin and 0.025% of OEO (C1) and cheese made with milk added of 500 IU mL-1 of nisin (C2).
2.7. Physicochemical analysis of FC
The FC stored at 1, 4, and 8 days were physicochemically analysed in triplicate for total solids (IDF, 2004) and fat (ISO, 1975) content. The pH (SI Analytics, Handylab 100, Germany) of each milled sample was measured by adding 10 g in 100 mL of distilled water.
2.8. Microbiological analysis of FC
For the microbiological quality analysis of FC, 10 g of FC were placed in 90 mL of sterile peptone water (GranuCult™, Merck, Germany) and then vortexed for 2 min. Next, 10‐fold serial dilutions in sterile peptone water were made up to 10‒5, and 1 mL of each dilution was plated using the pouring technique. CFU count of aerobic mesophile bacteria was performed using Plate count agar (PCA) after incubation at 30 °C for 48 h under aerobic conditions. Enterobacteriaceae CFU counts were performed using violet red bile agar (VRBA) after incubation at 37 °C for 24 h. For bacterial spore counting, FC samples homogenized in sterile peptone water were heat-shocked (85 °C, 15 min) and immediately cooled in an ice bath at 4 °C. Then, 10-fold serial dilutions were made in peptone water, 1 mL of each dilution was plated in PCA and counting was performed after incubation of plates at 30 °C for 48 h. All assays were carried out in duplicate, and the results were expressed in CFU g-1. The analyses were carried out at 1, 4, and 8 days of cheese storage at 4 °C.
2.9. Sensory analysis of FC
The sensory analysis of the cheeses was carried out 2 days after its manufacture to guarantee the safety of 8 experts with extensive experience in cheese production and sensory characterization of cheese. The cheeses samples were coded with 3-digit random numbers and then served monadically on white plastic plates. The experts rated the difference between C1 and C2 samples from the control (C0) in terms of hardness, mouthfeel wateriness, and aroma. The scale used to measure the negative or positive difference of actual samples from control were: 0 = no differences, ± 1 = minimal differences, ± 2 = notable differences, ± 3 = considerable differences, and ± 4 = very considerable differences. The cheeses samples' quality impression was expressed using a 9-point scale ranging from 1 - Low quality to 9 - High quality (Kilcast, 2013).
2.10. Data analysis
The microbiological counts (expressed in logarithm to meet the normality of residuals and homogeneity of variances) of milk were processed through a two-way analysis of variance (ANOVA) considering nisin and OEO as factors followed for a Tukey test for pairwise comparison. On the one hand, FC's physicochemical and microbiological properties were analyzed by ANOVA for a randomized block design (RBD) in factorial arrangement, where the FC processes were the blocks. At the same time, treatments and storage time were the factors. The post-hoc analysis was also the Tukey test. On the other hand, the sensory data were submitted to ANOVA considering an RBD with FC processes as blocks and treatments as a factor, and, when appropriate, the Tukey test was applied. All univariate statistical analyses were performed at 95% confidence following the guidelines set out by Granato et al. (2014) using R software (R Core Team., 2021).
For the multivariate representation of the FC stored at different times, the three FC treatments and three storage times were arranged in rows and the physicochemical, sensory, and quality responses were in columns. Subsequently, a Multiple Factor Analysis (MFA) was performed to analyse the responses of different natures simultaneously. This analysis was conducted in the FactoMineR package and was run in the R software.
3. Results and discussion
3.1. Microbiological count of S. aureus in milk
The addition of 0.025% (M1) and 0.05% (M2) of OEO in milk no reduced the S. aureus count compared to the control (M0), as observed in Table 1. Conversely, adding 250 or 500 IU mL-1 of nisin to the milk significantly reduced S. aureus count by ~1.35 Log and ~1.66 Log, respectively. These results align with an earlier study by Felicio et al. (2015), in which the addition of 400 IU mL-1 of nisin to milk reduced by ~1.3 Log the S. aureus count compared to the control. Similarly, adding 10000 IU mL-1 of nisin to UHT milk samples reduced by ~4.68 and ~0.37 Log the S. aureus count compared to the control after 4 and 24 h of exposure, respectively (Arqués et al., 2011). Nisin is mainly effective against gram-positive bacteria, such as S. aureus (de Arauz et al., 2009). The mechanism of antibacterial action of this peptide comprises the interference in the cell wall synthesis and the formation of pores in the cytoplasmatic membrane, which disrupts the proton motive force and causes leakage of ions, resulting in cell death (de Arauz et al., 2009). The effectiveness of nisin in reducing bacterial count can be enhanced by safe handling practices of milk during dairy product processing, such as cheese processing (Pinto et al., 2011).
Table 1 Microbiological counts of S. aureus (Log CFU mL-1) in pasteurized milk at different doses of nisin and oregano essential oil (OEO) after 24 h of incubation at 37 °C
| Milk | OEO (%) | Nisin (IU mL-1) | S. aureus count |
|---|---|---|---|
| M0 | 0 | 0 | 3.54 a ± 0.08 |
| M1 | 0.025 | 0 | 3.31 a ± 0.014 |
| M2 | 0.05 | 0 | 3.39 a ± 0.04 |
| M3 | 0 | 250 | 2.20 cd ± 0.33 |
| M4 | 0.025 | 250 | 2.66 bc ± 0.00 |
| M5 | 0.05 | 250 | 2.73 b ± 0.02 |
| M6 | 0 | 500 | 1.88 d ± 0.48 |
| M7 | 0.025 | 500 | 2.41 bc ± 0.08 |
| M8 | 0.05 | 500 | 2.32 bcd ± 0.31 |
Different lowercase letters in the same column indicate differences between treatments according to the Tukey test (P < 0.05).
The combination of OEO and nisin at the tested concentrations (M4, M5, M7 and M8) showed no reduced S. aureus count in milk compared to milk treatments added of nisin alone (M3 and M6). However, previous studies have reported a synergistic effect of nisin and EOs to control the growth of potentially pathogenic bacteria in milk and improve the microbial milk stability, but this is when higher concentrations of the EO were combined with nisin. For instance, it has been reported the strong synergistic effect of Metasequoia glyptostroboides cone EO (at 1 and 2%) and nisin (at 500 IU mL-1) to reduce Listeria monocytogenes count in whole, low fat and skim milk after 14 days of exposure (Yoon et al., 2011). The concentrations of OEO tested in our study were considerably lower than 1-2%. Thus, this could have been a reason for not observing an antimicrobial effect on S. aureus count when OEO was tested alone or in combination with nisin. Some earlier studies had reported the lack of antibacterial effect of EOs to reduce the bacterial count in milk when lower concentrations of the EOs were used. For instance, adding 0.2% of Thymus capitatus EO to milk didn’t reduce S. aureus and Enterococcus hirae counts (Ben Jemaa et al., 2017). Similarly, another study testing T. capitatus EO at 1 mg L-1 (~0.0001%) reported that this EO was ineffective in reducing the effect of the total bacterial count in pasteurized milk after 4 days of exposure (Ben Jemaa et al., 2018). The effect of an EO on food preservation depends on its source and composition but includes the food matrix components can also affect the EOs antimicrobial properties. The efficacy of an EO can be modified while interacting with certain food components such as water, protein, carbohydrates, fat, minerals, organic acids, etc. (Falleh et al., 2020).
On the other hand, an important aspect to consider when an EO is intended to be added as a food preservative is its odor and flavor, which may influence a food's sensory properties. Often, effective antimicrobial concentrations of an EO can negatively alter the sensory properties of a food product, such as lousy aftertaste and reduced acceptance (Mariod, 2016; Mishra et al., 2020). In this sense, to continue our study, the lowest concentration of OEO (0.025%) was used for cheese processing.
3.2. FC processing
3.2.1. Physicochemical properties of FC
The physicochemical composition of FC is shown in Table 2. A combination of nisin and OEO or nisin alone did not alter the pH of FC compared to the control treatment (C0) (p > 0.05). In addition, there were no changes in the pH by the storage time. The pH of FC ranged from 6.49 to 6.75. These values were in line with previous results for white cheese (6.0 - 6.8) (Zamora et al., 2012) and starter-free cheese (6.5 - 6.8) ( Mayta-Hancco et al., 2019). Similarly, the addition of Tunisian rosemary (Rosmarinus officinalis) EO didn’t change the pH of Minas frescal cheese compared to the control at 6 and 9 days of storage (Fernandes et al., 2017). Conversely, it was reported that the pH of a flavored cheese on a cream cheese base added of OEO or rosemary EO was higher than the control treatment after 14 days of storage. Authors indicated that EO treatments reduced the total viable count compared to the control. Thus, there was less production of fermentation products such as lactic acid, whereby EO treatments had higher pH (Olmedo et al., 2013).
The fat percentage in all FC ranged from 16.15 -17.80%, which was in line with the normal fat percentage stablished for FC fresh cheese by the Codex Alimentarius (FAO/WHO, 2011). There were no significant differences in the fat content between treatments. However, there was a significant increase in fat content by increasing the store time in each type of FC. Fat content increased in 1.3%, 1.57% and 1.5% for C0, C1 and C2, respectively.
Regarding total solids content, it increased significantly in all treatments as much as the storage time was longer. This is expected because of the whey-draining process along the storage time, which removed the moisture from the FC (Walstra et al., 2005). However, there were no significant differences in the solids content between treatments. This result was similar to an earlier study conducted by El-Sayed & El-Sayed (2021) for white soft cheese, in which adding 0.5%, 0.75% and 1% of a microencapsulated cumin EO did not alter the total solid content of this cheese (~33%).
Therefore, overall, our results showed that FC added of the combination of nisin with OEO or nisin alone had similar physical-chemical properties compared to the control. This is something expected as EOs can’t modify, fat, total solid content, and pH. However, the storage time changed the fat content and total solid content for all treatments, which is expected due to water removal during storage. Previous studies have reported that ripening cheese (Tornambé et al., 2008), fresh sheep cheese (Amatiste et al., 2014), Minas frescal cheese (Fernandes et al., 2017) and Coalho cheese (Melo et al., 2020) added of EOs, either in their raw form, microencapsulated or nano-emulsified had fat, protein, moisture, calcium, pH, acidity and water activity similar to the control. Thus, our results were in line with these studies.
3.3. Microbiological analysis of FC
The enzymatic coagulation of pasteurized milk produces FC without the addition of starter culture. The presence of aerobic mesophilic bacteria in FC is affected by the initial count and the heat treatment of raw milk used for FC manufacture the storage conditions and type of cheese (Fontecha et al., 1990). Moreover, FC has a pH very close to neutrality (6.4 - 6.7) and high moisture, allowing many microorganisms to grow. Thus, FC has a short shelf-life and must be consumed up to 10 days after its processing. Mesophilic bacteria count allows for evaluating and determining a food's hygienic quality and estimating of its shelf-life (Melo et al., 2020). The results of the total mesophilic bacteria count of the FC are shown in Table 3. The combination of nisin and OEO (C1) and nisin alone (C2) reduced similarly the aerobic mesophilic bacterial count during the storage time compared to the control (C0). Thus, this means that the observed reduction in the count of this bacterial group was mainly an effect of nisin.
Table 2 Physicochemical composition of fresh cheese (FC) at 1, 4, and 8 days of storage at 4 °C
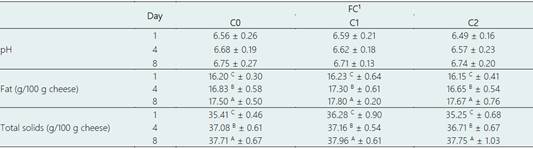
Data are represented as means ± standard deviation. Different superscripts lowercase letters (a, b, c) mean significant differences among cheeses, and different superscripts uppercase letters (A, B, C) indicate differences between days of storage according to the Tukey test (p < 0.05). The averages were calculated from three independent blocks.
1C0: Control cheese without nisin and OEO; C1: Cheese added of 500 IU mL-1 nisin and 0.025% OEO; and C2: Cheese added of 500 IU mL-1 nisin.
C1 and C2 reduced the count of this bacterial group to ~1.21 and ~1.69 Log on day 1, in ~1.48 and ~1.71 Log on day 4, and in ~1.68 and ~1.71 Log on day 8. Moreover, 4- and 8-days storage time slightly increased the count for all treatments. The effectiveness of nisin in reducing mesophilic bacteria count in white cheese was reported in an earlier study, in which nisin reduced it in ~3 Log during storage time (0-10 days) (Castro et al., 2009).
Overall, the mesophilic bacteria count did not exceed 105 CFU g-1 in the control cheese and 104 CFU g-1 in the C1 and C2 cheeses. The highest permissible limit for the mesophilic bacterial count for FC to ensure hygienic quality was established at 5.00 log CFU/g by Vásquez et al. (2018). Therefore, the FC produced in our study was microbiologically safe and acceptable for consumption.
Enterobacteriaceae comprises a family of Gram-negative, non-spore-forming bacteria and coliforms, and thus is used as a contamination indicator in food, such as in dairy products (Perin et al., 2019;Zamora et al., 2012). A high count of Enterobacteriaceae means a lack of hygienic handling during cheese processing. In our study, Enterobacteriaceae was detected and counted from day 4 of storage only in the control cheese (C0), meaning that C1 and C2 delayed the growth of this bacteria in FC, mainly by the effect of nisin. At day 8 of storage, Enterobacteriaceae developed for all treatments (~3Log), and there was no significant difference in Enterobacteriaceae count; that is, a combination of OEO and nisin (C1) and nisin alone (C2) did not reduce the count of this bacteria. This result was in line with the study of Fernandes et al. (2017), in which coliform count was not altered by adding rosemary EO to Minas frescal cheese. Conversely, in a previous study, nisin alone was effective in reducing coliforms in ~2 Log in white cheese during storage time (0 - 9 days) compared to the control (Castro et al., 2009).
Bacterial spores, such as Bacillus and Clostridium spores, can survive after milk pasteurization (Chambers, 2002). Thus, to avoid the development of spores, milk must be kept refrigerated after pasteurization (Perin et al., 2019). During cheese storage, spores can develop and rise in number, especially if storage is carried out under no refrigeration temperatures. Bacterial spores were produced and grew from day 4 of storage in all treatments. There was no significant difference in spore count between treatments on days 4 and 8. In addition, there was no significant increase in spore count from day 4 to day 8 for each treatment. These results indicated that the combination of nisin and OEO or nisin alone did not have an effect on controlling spore growth. In our study, spore counting results for FC were similar to those found for soft cheese samples (~1.4 - 3.4 Log) by Ashraf et al. (2020). Likewise, spore counting for Egyptian soft FC, Domiati cheese, was reported in a range from 3.30 and 3.75 Log (Nassib et al., 2018).
3.4. Sensory analysis of FC
The sensory attributes used to compare the intensity of FC treatments with control were hardness, wateriness, and aroma (Table 4). For hardness, C1 and C2 were rated as harder than the control (C0). A hardness perception in cheese could be explained by a lower capacity of moisture retention in cheese. However, in our study C0, C1 and C2 had the same total solids, whereby it could be inferred that C0, C1 and C2 had the same moisture content. A previous study reported that nisin incorporated into cheese was preferred by panelists for its texture among all the attributes evaluated (Ulpathakumbura et al., 2016). This was explained by the effect of nisin, which favorited moisture retention in cheese. Consequently, nisin improved the cheese texture avoiding the development of a tough and rubbery texture (Ulpathakumbura et al., 2016). Nonetheless, the opposite effect was observed in our study, FC incorporated with nisin alone or with the combination of nisin and OEO was perceived as harder. Due to sensory perception being a cross-modal phenomena (Han et al., 2019), any difference in hardness of FC with nisin alone or with the combination of nisin and OEO from the control will impact significantly other sensory attributes, even in quality impression rated by experts.
Regarding the mouthfeel wateriness of C1 and C2 was different from the control (C0), reaching significance in C2, that is, the treatment with the addition of nisin only. The mouthfeel wateriness could be explained by different water typologies. In cheese, water is present in three main phases: free water in the serum channels, entrapped water near the casein matrix, and bound water tightly associated with the caseins (Everett & Auty, 2008).
Table 3 Microbial count (Log CFU/g) of fresh cheeses at 1, 4, and 8 days of storage at 4 °C
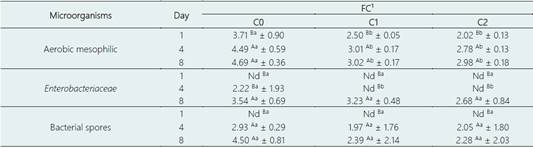
Data are represented as means ± standard deviation. Different superscripts lowercase letters (a, b, c) mean significant differences among cheeses, and different superscripts uppercase letters (A, B, C) indicate differences between days of storage according to the Tukey test (P < 0.05). The averages were calculated from three independent blocks.
Nd: not detected.
1C0: Control cheese without nisin and OEO; C1: Cheese added of 500 IU/mL nisin and 0.025% OEO; and C2: Cheese added of 500 IU/mL nisin.
The perceived higher mouthfeel wateriness could be a consequence of any disturbance in the water mobility inside the cheese by effect of the combination of nisin and OEO, mainly, in the free water mobility. Free water during the first week of cheese ripening is embedded in the casein matrix, turning into entrapped water (Everett & Auty, 2008). An alteration in free water mobility can make this water more available and increase the mouthfeel wateriness perception.
Adding OEO to milk significantly increased the aroma of C1 compared to C0 and C2. This pattern was expected due to the potential odorant of volatile compounds of OEO, such as carvacrol, thymol, γ-terpinene, and p-cymene (de Souza et al., 2016). The sensory differences between C1 and C2 from the control caused a significant impact on the quality perceived by the experts. The cheese added with OEO and nisin (C1) presented the lowest quality score, which the significant divergence can explain in aroma from the control. Previous studies have indicated that the high volatility, reactivity, odor, and taste of OEO can have a considerable impact on the sensory properties of the food product, resulting in undesired characteristics (Mariod, 2016; Mishra et al., 2020). On the contrary, the cheese added only with nisin (C2) presented a sensory quality similar to the control, confirming the potential of nisin to go unnoticed sensorially while decreasing the growth of spoilage and pathogenic microorganisms and ensuring the hygienic quality of cheese.
3.4.1. Quality of FC
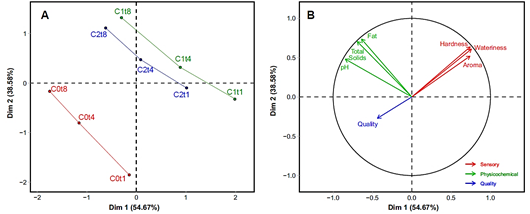
A multivariate representation of the sensory and physicochemical characteristics and quality of FC conjointly is beneficial since it is known that food properties are inter-correlated (Saldaña et al., 2015). Figure 2 shows on the left (Fig. 2A) the representation of the treatments (C0, C1 and C2) along the storage day (t1, t4 and t8). This reveals that the three treatments showed similar behavior over time. However, the control (C0) is far from C1 and C2, showing multivariate differences between the control and the rest of the treatments. To explain the positioning of the treatments along storage time, we must verify the vectors with the properties under study. On the right, the vectors representing the sensory and physicochemical characteristics and quality are shown (Fig. 2B). The first pattern indicates that the quality was opposite to any sensory change concerning the control. The second pattern shows that the physicochemical properties increased over time. Finally, we can affirm that the control treatment presented the highest perceived quality, and any modification decreases it, such as the addition of OEO, which means an increase in sensory differences (This multivariate trend contradicts the univariate assessment of global quality where control (C0) and nisin (C2) had the same quality. This apparent divergence may be because, in the multivariate perspective, we consider all possible re sponses, giving us a unifying overview of the study). Thus, this must be considered since consumers associate quality with purchase intention and consumption frequency.
Table 4 Sensory analysis of fresh cheese (FC) after 2 days of storage at 4 °C
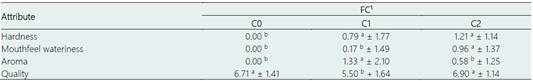
Data represent means ± standard deviation. Different superscripts in the same row (a, b, c) indicate differences between types of cheeses (P < 0.05). The averages were calculated from eight experts in sensory analysis of cheeses.
1C0: Control cheese without nisin and OEO; C1: Cheese added of 500 IU/mL nisin and 0.025% OEO; and C2: Cheese added of 500 IU/mL nisin.
4. Conclusions
Adding nisin to milk effectively reduced S. aureus count in milk, and aerobic mesophilic and Enterobacteriaceae counts in FC. The FC manufactured with milk added of nisin + OEO and nisin alone had a pH, fat percentage and total solids similar to the control during storage time. However, FC added nisin + OEO presented an intense oregano aroma that decreased its quality according to consumers. Conversely, the FC manufactured with milk added of nisin alone had a perceived quality similar to the control (without the addition of nisin and OEO or nisin alone).

