Inglés (pdf)
 Articulo en XML
 Referencias del artículo
 Enviar articulo por email
 Citado por SciELO
  Similares en
SciELO
Similares en
SciELO 
 Permalink
1. Introduction
Poultry production comprises the raising of multiple flocks of poultry on the same litter to attend the market's demand (Guardabassi & Kruse, 2009). Antibiotics inclusion at subtherapeutic levels in poultry’ diets has been a common practice to i) boost the immune system, ii) control the emergence and propagation of enteric diseases and iii) promote the growth of poultrys (Agyare et al., 2018). Thus, this practice has significantly contributed to maintain the productivity of poultry sector by reducing the mortality of poultrys (Teillant et al., 2015). However, the continuous use of antibiotics in animal production, such as poultry production, has been suggested as one cause of the growing emergence and propagation of antibiotic-resistant bacteria (Vanderhaeghen & Dewulf, 2017). Strong evidence has revealed the high correlation between the use of antibiotics and the prevalence of antibiotic resistance in gut commensal bacteria from farm animals, such as poultry (Chantziaras et al., 2014). In addition. it has been reported the transmission of antibiotic resistant strains from farm animals to humans as well as the transmission of these strains and their associated genes through the food chain (Ma et al., 2021; Menkem et al., 2019). Nowadays, antibiotic resistance has turned into a public health threat and it is recognized as a silent epidemic (Nieuwlaat et al., 2020; Rawson et al., 2020). As a measure to tackle antibiotics resistance, the use of antibiotics as growth promoter has been banned since 2006 by the European Union Regulation (EC No. 1831/2003) (EU, 2003). Following this example, recently, other countries such as China, Brazil, Japan, South Korea, New Zealand (Food Safety Commission of Japan, 2017; Johnson, 2010; Liu & Liu, 2018; Walsh & Wu, 2016) and United State (Brüssow, 2017; Gresse et al., 2017) have adopted restrictions regarding the use of some antibiotics as growth promoters in animal feed. Thus, in view of this restriction, the search for alternatives to replace antibiotics in animal feed arose and became imperative.
In the last two decades, there has been a growing interest in searching for natural alternatives to antibiotics as measure to tackle antibiotic resistance in poultry production. In this sense, essential oils (EO) have emerged as a promising alternative to antibiotics due to their complex biological activities, such as their antimicrobial activity (Diaz-Sanchez et al., 2015). Several studies have already shown that EOs effectively inhibit the growth of pathogenic bacteria causing enteric diseases in poultry, such as Salmonella sp. (Di Vito et al., 2020; Ebani et al., 2019), E. coli (Ebani et al., 2018; Seyedtaghiya et al., 2021) and Clostridium perfringens (Diaz et al., 2016; Mitsch et al., 2004). Particularly, citrus EOs could be an excellent alternative to antibiotics for poultry production as citrus EOs harbor broad antibacterial activity on several pathogenic bacteria (Fisher & Phillips, 2006; Friedly et al., 2009; O’Bryan et al., 2008). Interestingly, recent studies have shown that citrus EO have a selective antibacterial activity on pathogenic and beneficial bacteria that occurs in the gut of farm animals, such as poultry and pigs (Ambrosio et al., 2017; Ambrosio et al., 2019). Furthermore, citrus EOs are a by-product of citrus processing industries and they are the most produced EOs around the world (Barbieri & Borsotto, 2018; Iwabuchi et al., 2010). In 2020, the worldwide production of citrus EO reached approximately 60.3 thousand tons, being Brazil the major producer one (United Nations, 2021). In addition, citrus EOs have the safety recognition to be used as additive by the Food and Drug Administration (Fisher & Phillips, 2008). Consequently, citrus EOs could be a feasible alternative to antibiotics for poultry feed.
Enterococcus sp. are a normal inhabitant of the gastrointestinal tract of poultry (Jørgensen et al., 2017). Particularly, Enterococcus faecalis is an opportunistic pathogen that can cause clinical conditions in poultry depressing their growth (Fertner et al., 2011). However, Enterococcus faecalis is more associated with extra-intestinal infections in poultry as it has genetic traits that increase its virulence enabling it to colonize other body locations of poultry and cause infection (Fertner et al., 2011; Olsen et al., 2012). On the other hand, Lactobacillus sp. are beneficial commensal bacteria and normal inhabitant of the gut of poultry (Jeni et al., 2021). It is well-know that Lactobacillus species have health-promoting effects as Lactobacillus sp. contribute maintaining the poultry gut health and consequently the poultry performance.
In this context, it is crucial and desirable that potential alternatives to antibiotics for poultry feed have a selective antibacterial activity, that means, higher activity on pathogenic bacteria and lower or not activity on beneficial bacteria from the poultry gut. Therefore, the aim of this study was to evaluate the effect of a commercial citrus EO, Orange oil phase essence (OOPE), on the growth kinetics of E. faecalis ATCC 29212 (model of a pathogenic bacterium) and Lactobacillus rhamnosus ATCC 7469 (model of a beneficial bacterium).
2. Materials and methods
2.1 Essential oils supply
A commercial citrus EO was used in this study, Orange oil phase essence (OOPE), which was a by-product of orange juice processing and was supplied by a factory in São Paulo State, Brazil. Once the sample was received, it was kept in amber bottles under refrigeration (4 °C) until its use.
2.2 Bacterial strains
The bacterial strains for this study were purchased from the American Type Culture Collection (ATCC): Enterococcus faecalis ATCC 29212 and Lactobacillus rhamnosus ATCC 7469, which were evaluated as models of a pathogenic bacterium and a beneficial bacterium of occurrence in the poultry gut, respectively. The bacteria were cultivated in TSA (tryptic soy agar) agar at 37 ºC for 18 - 20 h (E. faecalis) and in MRS (Man, Rogosa and Sharpe) agar at 30 ºC for 48 h (L. rhamnosus), respectively. After activation, bacteria were sub-cultured in Brain-Heart Infusion (BHI, E. faecalis) and MRS broth (L. rhamnosus), both supplemented with 15% glycerol. After incubation, they were stored at -20 ºC until use.
2.3 Antibacterial activity
Determination of Minimal Inhibitory Concentration (MIC)
The determination of the MIC was performed by microdilution assay in a 96-well microplate following the standard protocol M07-A9 from the Clinical and Laboratory Standards Institute, with some modifications (CLSI, 2012). For the assay, the inoculum was prepared in sterile saline (NaCl 0.85% w/v) from living colonies of the selected bacteria and contained in plates of TSA agar (E. faecalis) or MRS agar (L. rhamnosus) at the optical density equivalent to the 0.5 McFarland Standard (0.08 - 0.13 at 625 nm) corresponding to 108 CFU/mL. Then, this inoculum was diluted at 1:100 to obtain a final inoculum (106 CFU/mL). The OOPE stock solution was prepared at 14.80 mg/mL (1.65% v/v) with MH broth (E. faecalis) or MRS broth (L. rhamnosus) using Tween 80 as emulsifier. The OOPE stock solution was placed in the wells of the first row of the microplate (Y-axis). From these wells, two-fold serial dilutions were made along the Y-axis of the microplate, thus OOPE working concentrations ranged from 14.80 to 0.116 mg/mL. Next, 20 µL from the final inoculum were added to each well containing 180 µL of several OOPE concentrations, being the final volume in each well of 200 µL and bacterial population of approximately 105 CFU/mL. The following controls were used: culture medium control (200 µL of MH or MRS broth); growth control (180 µL of MH or MRS broth + 20 µL of inoculum); Tween 80-emulsifier control (200 µL of MH or MRS broth with Tween 80) and growth control containing the emulsifier (180 µL of MH or MRS broth with Tween 80 + 20 µL of inoculum). Finally, microplates were incubated in a microplate reader (VitorTM X3, PerkinElmer) at 37 ºC for 24 h for E. faecalis and at 30°C for 32 h for L. rhamnosus.
The MIC was established as the lowest EO concentration that inhibited visible bacterial growth. The existence or not of bacterial growth was evaluated by construction of survival curves. The lowest concentration that did not pro duce detectable absorbance values (at 600 nm) until the end of incubation was considered as the MIC. Assays were carried out in triplicate in three independent replicates.
Bacterial growth modeling and calculation of kinetics parameters
Bacterial growth kinetics (or survival curves) for each tested OOPE concentration was built from absorbance readings at 600 nm of the wells of the microplate configured as above, carried out every hour during the total incubation period, 24 h for E. faecalis and 32 h for L. rhamnosus. Bacterial growth kinetics were modeled using the Gompertz model modified by (Zwietering et al., 1990) (Eq. 1), since this model considers the three main biological parameters of bacterial growth. The data were fitted to the mathematical model with a confidence level of 95% using the Levenberg-Marquardt algorithm available at Solver (Excel, Microsoft, USA).
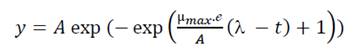 ***
***
Where: y represents the relative population size against time, the A, µmax and ( are the three parameters that described three phases of the bacterial growth curve (Zwietering et al., 1990). The asymptote A is the maximal bacterial culture density (OD600 nm), µmax represents the maximum specific growth rate (h-1) and it is the tangent of the log phase curve, ( is the lag phase duration (h) and is defined as the x-axis intercept of this tangent. ℯ represents the number e= 2.7183. Finally, the goodness of fit for the model was measured based on the mean square error (MSE) and on the corrected determination coefficient (corrected R2) for each set of data.
Minimal Bactericidal Concentration (MBC)
The determination of MBC was performed from wells containing OOPE concentrations where there was no visible bacterial growth. So, an aliquot of 100 µL was taken from each well and seeded in MH (E. faecalis) or MRS (L. rhamnosus) agar. Plates were incubated for 24 h at 37 ºC for E. faecalis and for 32 h for L. rhamnosus. The MBC was defined as the lowest concentration of OOPE able to cause total bacterial death, represented by the visible absence of colonies on the agar plates.
2.4 Chemical composition of OOPE
The chemical composition characterization of OOPE was performed by gas chromatography coupled with mass spectrometry (GC/MS) using a GC/MS QP2010 Plus - SHIMADZU (Shimadzu, Kyoto, Japan). The GC was equipped with a capillary chromatographic column diphenyl dimethyl polysiloxane (5% diphenyl and 95% dimethyl polysiloxane) of 30 m x 0.25 mm ID x 0.24 film thickness, model Rtx®-5ms (RESTREK). The oven temperature was set as follows: initial oven temperature was held at 50 ºC for 1.5 min, then raised to 200 ºC at 4 ºC/min and, finally, to 240 ºC at 10 ºC/min, which was kept for 7 min. The injector and interface temperatures were 240 ºC and 220 ºC, respectively. A volume of 1.0 µL of samples diluted in n-hexane was injected in the “split” mode at a ratio of 1:200. Helium gas was used as the carrier gas at a constant flow rate of 1.2 mL/min. Mass detector operated in scan mode in the range of 40 to 500 m/z. The identification of the components was performed by comparing their retention indices (Kovats indices-IK) and their mass spectra with data published in the literature (Adams, 2007) and with the mass spectra in the computer library (NIST 07, WILEY 8).
2.5 Data analysis
A one-way ANOVA will be performed (5% of confidence level) to detect significant differences in the growth kinet ics parameters A, µmax and λ of E. faecalis and L. rhamnosus after exposure to OOPE concentrations using R software. If significant differences were detected in those parameters, as effect of OOPE concentrations, the behavior of each parameter was modeled by nonlinear regression.
3. Results and discussion
3.1 MIC and MBC
Results of the MIC and MBC of OOPE are shown in Table 1. OOPE inhibited the growth of E. faecalis and L. rhamnosus at the highest concentration tested, 14.8 mg/mL, and it didn’t have a bactericidal effect on both bacteria. Inhibitory and bactericidal effects of EOs on Enterococcus sp. have already been reported. For instance, it has been reported that Eucalyptus globulus and Pimenta pseudocaryophyllus EOs had an inhibitory effect on this bacterium at 7.4 mg/mL and a bactericidal effect at 14.8 and 7.4 mg/mL, respectively (Ambrosio et al., 2018). Compared to our results, it was reported that oregano EO effectively inhibited and killed strains of E. faecalis isolated from poultry cloaca at lower concentrations (MIC = 0.5 and MBC = 0.5 - 1.0 µL/mL) than OOPE. Particularly, Espina et al. (2011) reported that the EOs from Citrus sinensis (orange), Citrus lemon (lemon) and Citrus reticulata (mandarin) inhibited the growth of Enterococcus faecium at concentrations ranging from 0.5 - 2.0 µL/mL. In contrast to these citrus EOs, OOPE had a lower antibacterial effect as OOPE inhibited E. faecalis at higher concentrations. On the other hand, regarding the inhibitory and bactericidal effects of EOs on Lactobacillus sp., an early study conducted by Ambrosio et al. (2019) reported that the citrus EO, Brazilian Orange Terpens (BOT), inhibited and killed L. rhamnosus at 3.7 and 7.4 mg/mL respectively. Thereby, OOPE in our study compared to BOT, exerted a lower antibacterial effect on L. rhamnosus. Similarly, it has been reported that P. pseudocaryophyllus EO inhibited and killed L. rhamnosus at 3.70 and 14.80 mg/mL, respectively (Ambrosio et al., 2018). Our results about the MBC of OOPE for this bacterium was equivalent to the MBC reported for P. pseudocaryophyllus EO (Ambrosio et al., 2018).
Table 1 Minimal inhibitory concentration (MIC) and Minimal bactericidal concentration (MBC) of orange oil phase essence (OOPE)
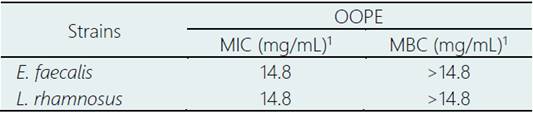
1 Determined by survival curves
3.2 Bacterial growth modeling and calculation of kinetic parameters
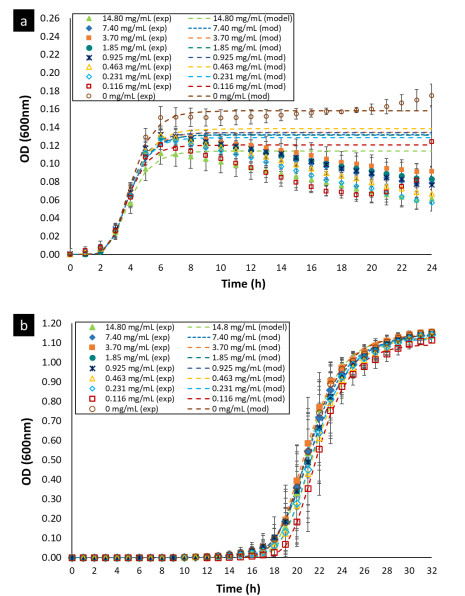
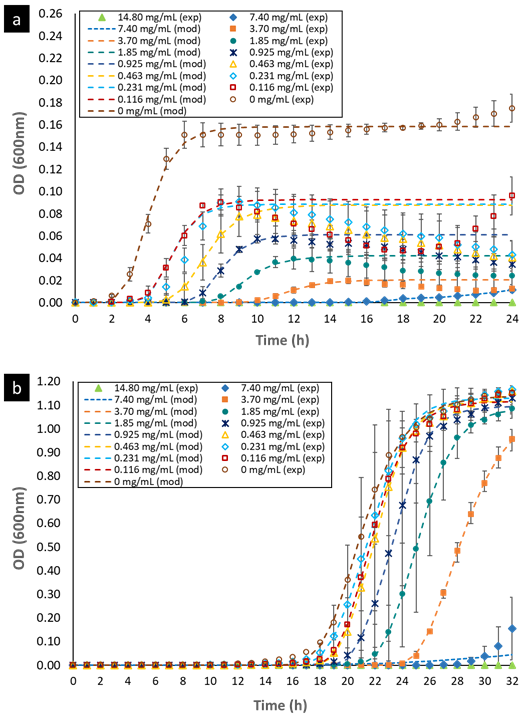
The curves representing the bacterial growth kinetic for E. faecalis and L. rhamnosus, when they were exposed to different concentrations of OOPE, are shown in Fig 1. The Gompertz model modified by Zwietering et al. (1990) was used to fit the data of the bacterial growth (Eq. 1). The parameters obtained of this model for both bacteria are shown in Table 2. There was bacterial growth from 0 - 7.4 mg/mL of OOPE for both bacteria. Furthermore, we observed that OOPE concentrations were able to provoke higher disturbances on the normal growth kinetic of E. faecalis than L. rhamnosus.
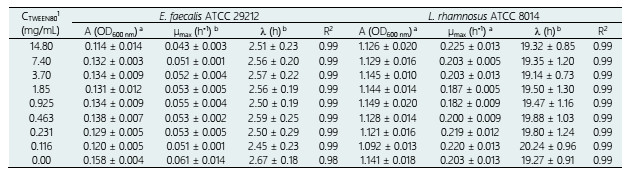
Table 2 Calculated parameters of Modified Gomperzt Model (Zwietering et al., 1990) for each evaluated concentration of Orange oil phase essence (OOPE)
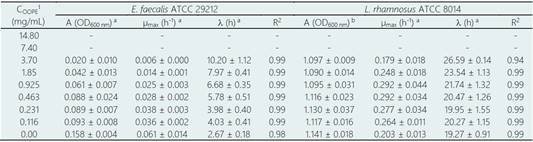
*A = maximal bacterial culture density (600 nm), µmax = the maximum specific growth rate (h-1), ( = lag phase duration (h)
(-) Undetermined parameters due to total inhibition.
1 Concentration of essential oil
a There are significant differences in the growth kinetics parameters after exposure to essential oil concentrations (p < 0.05).
b No significant differences were observed (p < 0.05).
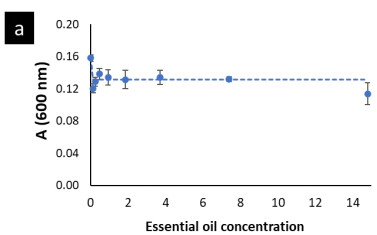
The modified Gompertz model allowed to evaluate these disturbances with more accurateness through the three main biological parameters that this model considers: maximal bacterial culture density (A), maximum growth rate (µmax) and lag phase duration ((). Nonetheless, for E. faecalis this model had a slight limitation to precisely model its growth kinetics when this bacterium underwent the effect of the EO concentrations (Fig. 1a) or the effect of the emulsifier Tween 80 (Fig. A1a) used to prepare the EO stock solution. The modified Gompertz model assumes that the stationary phase is constant after reaching A (a straight line at A value), which is typical for all bacteria. However, E. faecalis had an anomalous behavior in its stationary phase at the concentrations of OOPE or Tween 80, which decreased over time after reaching A compared to the control (0 mg/mL of OOPE or Tween 80). This anomalous behavior has been caused by the emulsifier (Tween 80) since when it was tested alone that behavior was clearly observed (Fig. A1a). Thus, the emulsifier caused mainly a disturbance on E. faecalis stationary phase attributable to a certain antibacterial effect of it. Although this effect, the modified Gompertz model was still suitable to explain the growth kinetics of E. faecalis as it was possible to estimate the main 3 parameters of the model (considering data until the maximal OD600 values obtained). Moreover, Tween 80 had a significant effect on A of E. faecalis, which was slightly reduced by the Tween 80 concentrations (Table A1 and Fig. A2). The highest Tween 80 concentration caused a reduction of this parameter in a higher extent compared to the other concentrations (Figure A2). These results are in line with an earlier study conducted by Nielsen et al. (2016), in which Tween 80 had certain antibacterial activity on Pseudomonas fluorescens and Listeria monocytogenes as Tween 80 slowed the growth rate (µmax) of the former one and reduced the biofilm formation of both bacteria. Regarding L. rhamnosus, the concentrations of Tween 80 had a significant effect on A and µmax (Table A1), however there was not a clear behavior of the effect of the concentrations on these parameters (Fig. A3). The Tween 80 concentrations slightly affected L. rhamnosus growth kinetics (A and µmax) in contrast to E. faecalis as can be seen in Fig. A1b and Table A1. Commonly, Tween 80 is used as an emulsifier to improve the EO dispersion and EO mix with a growth media in antibiogram assays, which are used to test the antibacterial activity of an EO. Thus, it is important to document the indirect effects of emulsifiers when studying the efficacy of hydrophobic antimicrobials, such EOs, that are dispersed in solution by emulsification (Nielsen et al., 2016). Even though, Tween 80 caused disturbances on the growth kinetics of E. faecalis and L. rhamnosus, it has been observed that this emulsifier did not interfere with the antibacterial activity of OOPE as Tween 80 and OOPE affected different phases of the growth of E. faecalis and L. rhamnosus or OOPE had a higher effect on those phases (on A, µmax and ().
In this sense, the modified Gompertz model allowed to describe the effect of OOPE concentrations on E. faecalis growth kinetics. OOPE main significant effects were on A, µmax and (, and it was evident a dose-dependent effect of OOPE on these parameters.
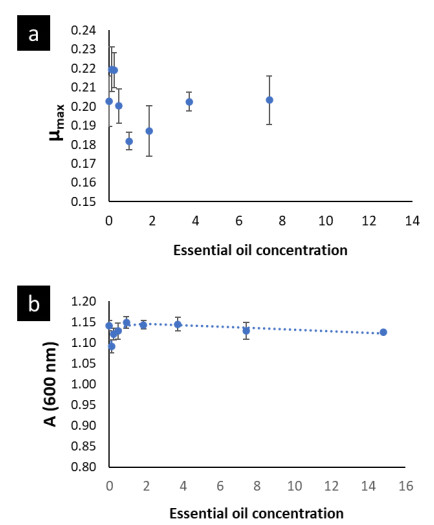
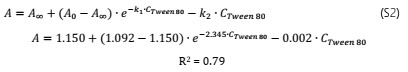
A was significantly reduced (p < 0.05) as much as the concentration of OOPE was increased. For instance, compared to the control (0 mg/mL of OOPE), A was reduced in 41.1% by the lowest subinhibitory concentration (0.116 mg/mL) and in 87.34% by 3.7 mg/mL. This parameter had an exponential behavior as function of the OOPE concentration (Fig. 2a) and the mathematical function (R2 = 0.87) that describes this behavior for E. faecalis is shown in the Eq. (2). Where, 𝐴 0 is the A value at 0 mg/mL of OOPE and is 0.0158, 𝐴 ∞ is the A value at the maximum OOPE concentration and is 0.049, k is a constant that indicates how much A decreases with OOPE concentration and is 6.114. Regarding L. rhamnosus, A was not affected by OOPE concentrations (Table 2), no significant differences were detected (p < 0.05), and the average was A LR = 1.112 ± 0.021.
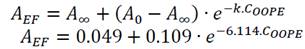 ***
***
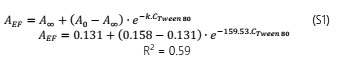
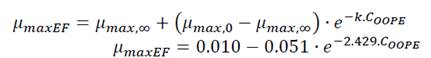
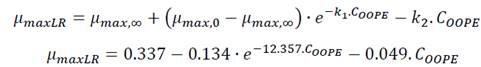
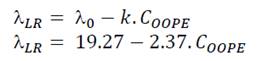
The growth rate, µmax, was significantly affected by the OOPE concentration for both bacteria, E. faecalis and L. rhamnosus. For E. faecalis, µmax was greatly reduced as much as the concentration of OOPE was increased. The lowest subinhibitory concentration of OOPE (0.116 mg/mL) and 3.70 mg/mL of OOPE reduced µmax in 40.9 and 90.2%, respectively. This parameter had an exponential behavior as function of the OOPE concentration (Fig. 2b) and the mathematical function (R2 = 0.88) that describes µmax behavior for E. faecalis is shown in the Eq. 3. Where, µ 𝑚𝑎𝑥,0 is the µ value at 0 mg/mL of OOPE and is 0.061, 𝜇 𝑚𝑎𝑥,∞ is the µ value at the maximum OOPE concentration and is 0.010, k is a constant that indicates how much µ decreases with OOPE concentration and is 2.429. Regarding L. rhamnosus, µmax increased as much as the concentration of OOPE was increased up to 0.925 mg/mL and there was a slight reduction of this parameter at 1.85 and 3.70 mg/mL (Fig. 3a). The mathematical function (R2 = 0.95) that describes µmax behavior for L. rhamnosus is shown in Eq. 4. Where, µ 𝑚𝑎𝑥,0 is the µ value at 0 mg/mL of OOPE and is 0.203, 𝜇 𝑚𝑎𝑥,∞ is the µ value at the maximum OOPE concentration and is 0.337, k 1 and k 2 are constants, 12.357 and 0.049, respectively.
 ***
***
 ***
***
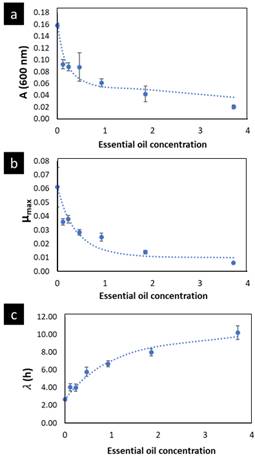
Figure 2 Parameters A (a), µmax (b) and ( (c) of the modified Gompertz model (Eq. 1) to E. faecalis as function of the OOPE concentration. The dots are the experimental values; the vertical bars are the standard deviation, and the curves are the model of Eqs. 2, 3 and 5, respectively. OOPE = Orange oil phase essence.
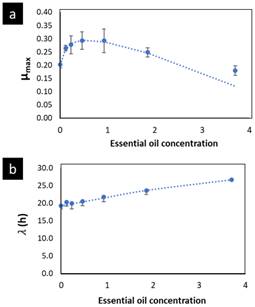
Figure 3 Parameters µmax (a) and ( (b) of the modified Gompertz model (Eq. 1) to L. rhamnosus as function of the OOPE concentration. The dots are the experimental values; the vertical bars are the standard deviation, and the curves are the model of Eqs. 4 and 6, respectively. OOPE = Orange oil phase essence.
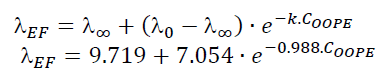
Regarding parameter (, it significantly rose as the OOPE concentration was increased for both bacteria. For E. faecalis, ( was slightly longer than control at the two lowest OOPE concentrations, but from 0.463 mg/mL to above, ( was remarkably increased. For instance, ( increased approximately 1.5 and 3.8 times at 0.116 and 3.70 mg/mL, respectively, in contrast with the control (0 mg/mL). This parameter had an exponential behavior as function of the OOPE concentration (Fig. 2c) and the mathematical function (R2 = 0.96) that describes this behavior for E. faecalis is shown in the Eq. 5. Where, ( 0 is the ( value at 0 mg/mL of OOPE and is 2.665, ( ∞ is the ( value at the maximum OOPE concentration and is 9.719, k is a constant that indicates how much ( increases with OOPE concentration and is 0.988. For L. rhamnosus, ( increased as much as the concentration of OOPE was increased, following a linear behavior (R2 = 0.97) showed in Eq. 6 and Fig. 3b. For instance, 0.116 and 3.70 mg/mL increased ( in approximately 1.05 and 1.38 times in contrast with the control (0 mg/mL). Thus, OOPE affected ( of E. faecalis in a higher extent than L. rhamnosus.
 (5)
(5)
 (6)
(6)
Therefore, the evaluation of the growth kinetic parameters showed that OOPE had a stronger antibacterial effect on E. faecalis than L. rhamnosus as it caused higher disturbances in the normal growth kinetics of E. faecalis than L. rhamnosus. Thus, OOPE had a selective antibacterial activity. This feature of antibacterial spectrum of EOs has been previously reported. For instance, Ambrosio et al. (2018) reported the effect of Eucalyptus globulus EO on the growth kinetics of E. faecalis and L. rhamnosus. These authors found that E. globulus EO had a dose-dependent effect on A and λ of E. faecalis, reducing A in approximately 71% and extending λ 3 times at 3.7 mg/mL compared to the control. Conversely, E. globulus EO at 3.7 mg/mL had a reduced antibacterial effect on L. rhamnosus as it slightly extended λ, ~1.3 times, without affecting A and µmax. Our results were in line with this study, however, OOPE had a higher effect on A and λ of E. faecalis as OOPE affected these parameters in a higher-extend than E. globulus EO at the same concentration tested (3.70 mg/mL) and OOPE had a similar effect on L. rhamnosus. Particularly, the selective antibacterial activity of citrus EOs have been reported in a recent study by Ambrosio et al. (2019), in which a commercial citrus EO caused higher disturbances on the growth kinetics of an enterotoxigenic E. coli (ETEC) strain than on L. rhamnosus, where the highest subinhibitory concentration (0.925 mg/mL) reduced A in 55.9% and extended λ 8 times of ETEC and only extended on λ 1.6 times of L. rhamnosus. Our results for OOPE were in line with this study. The selectivity of EOs towards pathogenic bacteria rather than beneficial bacteria is an important feature of antibacterial spectrum that EOs should have, particularly, citrus EOs as potential alternatives to antibiotics used in animal feed, such in poultry feed (Ambrosio et al., 2019). Nonetheless, not all EOs have a selective antibacterial effect. Several studies have reported a strong effect of EO or EO compounds on the growth kinetics parameters of several Lactobacillus species including L. rhamnosus. For instance, Melaleuca armillaris EO, extended λ of L. rhamnosus with the concomitant reduction of A and µmax (Hayouni et al., 2008). Similarly, limonene, the major compound of citrus EOs, when tested alone caused a significant reduction of A of L. fermentum when increasing the concentration of this compound (Ouwehand et al., 2010). The lower or not effect of EOs on beneficial bacterial, such as Lactobacillus sp. is a desirable feature of EOs as potential alternatives to antibiotics since Lactobacillus sp. contributes to combat pathogens colonization in the poultry gut and prevent gut infections. Several mechanisms of antibacterial action of EOs have been reported. Particularly, the mechanism of the selective antibacterial action of citrus EOs has been described as altering more remarkably the permeability and integrity of the cytoplasmatic membrane as well as the external structure of a pathogenic bacterium than a beneficial bacterium (L. rhamnosus) (Ambrosio et al., 2020).
3.3 Chemical composition profile
The chemical composition profile of OOPE is shown in Table 3. Limonene was identified as the mayor compounds of OOPE, followed by minor compounds such as cis-Limonene oxide, trans-Limonene oxide and myrcene. Typically, the major compound of citrus EOs is limonene, ranging from 32% to 98% (Fisher & Phillips, 2008). Frequently, the biological properties of citrus EOs, such as their antimicrobial activity, have been attributed to limonene. However, some studies have shown the inconsistence between limonene content in citrus EOs and their antibacterial activity. For instance, it has been reported that an orange cold pressed EO, which had 85.3% of limonene presented an antibacterial activity 10 times higher than limonene alone (Yi et al., 2018). Similarly, when the EO from Citrus limon var. pompia, which had limonene as major compound (32%), and limonene alone were tested for their antibacterial activity, only the citrus EO present antibacterial effect on several pathogenic bacteria and limonene did not have any antibacterial effect (Fancello et al., 2016). Thus, these studies proved that, at least alone, limonene is not the compound responsible for conferring the antibacterial activity to citrus EOs. Conversely, a recent study has found that minor compounds present in citrus EOs would be the responsible compounds for conferring this activity, such as trans-carveol (Ambrosio et al., 2021). Interestingly, this compound was identified in OOPE, and it could be involved in conferring the selective antibacterial activity of OOPE (Table 3).
Table 3 Chemical composition of orange oil phase essence (OOPE)
| Compounds1 | RT2 | KI3 | Orange Oil Phase Essence (%)4 |
| Myrcene | 10.390 | 996 | 1.47 |
| Limonene | 11.725 | 1033 | 87.22 |
| cis-Limonene oxide | 15.498 | 1139 | 3.59 |
| trans-Limonene oxide | 15.658 | 1143 | 1.96 |
| trans-Carveol | 18.542 | 1225 | 1.17 |
| Berbenol | 21.575 | 1315 | 1.17 |
| Trans-p-mentha-2,8(9)-dien-1-ol | 22.009 | 1328 | 1.08 |
| N.I | 23.392 | 1370 | 1.26 |
| Valencene | 27.567 | 1504 | 1.08 |
| Total | 100.00 |
1Identification by GC/MS; 2Time Retention obtained through capillary column Rxi-5ms; 3Kovats Index (Calculated); 4Relative amounts of the identified compounds based on the area of each peak in the chromatogram; N.I: Not identified compound.
4. Conclusions
This study proved the antibacterial activity of the citrus essential oils, orange oil phase essence (OOPE), on model pathogenic and beneficial bacteria that occurs in the poultry gut. Overall, OOPE caused higher disturbances on the normal growth kinetics of E. faecalis than L. rhamnosus. OOPE remarkably reduced A and µmax and extended λ of E. faecalis, while slightly extended λ and affected A of L. rhamnosus. This highlighted the potential selective antibacterial activity of OOPE on relevant pathogenic and beneficial bacteria for poultry and the possible application of OOPE in poultry production as an alternative to antibiotics.