


 Inglês (pdf)
 Artigo em XML
 Referências do artigo
 Enviar este artigo por email
 Citado por SciELO
  Similares em
SciELO
Similares em
SciELO 
 Permalink
1. Introduction
The level of crop productivity is conditioned by ag ricultural practices whose inefficient development has led to problems related to decreased water retention and infiltration, increased erodibility, and the risk of soil compaction, causing resistance to penetration, a decrease of the pore space, which leads to a low gas and water flow, preventing the growth and development of the roots, increasing the loss of fine particles, organic matter, nutrients, and finally to the degradation of soil quality (Pulido-Moncada et al., 2017; Olivares et al., 2020).
Most of the methodologies that are currently used to characterize the fertility of soils in production and their suitability for different uses are from several decades ago. Today these measurements have been complemented by techniques with the use of sensors and various data analysis software that allow us to manage more and better information (Calero et al., 2018; Vasu et al., 2021; Olivares et al., 2022a). However, many of these technologies are based on the same principles that were followed by soil science researchers in the last century. In this sense, the methodology of the Visual Soil Examination and Evaluation (VSEE) constitutes a paradigmatic case due to the simplicity of its requirements for the study of soil. It consists of a morphological description of the structure of tilled soils, based on the visual observation of a soil profile (Shepherd, 2009; Ball et al., 2007; Guimarães et al., 2017).
Visual assessments provide an immediate diagnostic tool to assess soil quality, as many physical, biological (and to a lesser extent chemical) soil characteristics appear as visual features (Ball et al., 2017; Pulido-Moncada et al., 2014a, 2014b). The results are easy to interpret and understand (Guimarães et al., 2011). The VSEE method has been developed to help land managers assess soil quality easily, quickly, reliably, and economically in agricultural systems (Cavalieri-Polizeli et al., 2022; Lin et al., 2022a;2022b).
There are some shovel methods based on the evaluation of the surface horizon of the soil, such as the Visual Evaluation of Soil Structure (VESS), proposed by Ball et al. (2007) under the name Visual Soil Structure Quality Assessment (VSSQA), which was improved and renamed by Guimarães et al. (2011), which has been widely used due to their simplicity (Guimarães et al., 2013; Franco et al., 2019). Soil structure is the main focus of the VESS method which interacts with physical, chemical, and biological properties; therefore, VESS scores should reflect the impact of crop management practices on soil quality and indicate the sustainability of crop management (Askari et al., 2013; Fernandes et al., 2022; Mutuku et al., 2021).
The number of scientific publications related to the use of VESS has experienced such remarkable growth in recent years that it exceeds the capacity of scientific quality control systems and, probably, that of specialists to assess, interpret, and critically assume its results. Given the number of original articles and given that scientific evidence is not the result of a single investigative effort but of the integration and replication of the results of different studies, the need arises to carry out studies with techniques such as meta-analysis. Very rarely has a single study contributed definitively to the advancement of knowledge represented by this type of visual soil assessment. On the contrary, it is common to find studies with similar objectives presenting inconsistent or contradictory results (Rossi et al., 2019; Rueda-Calderón et al., 2020). The individualized analysis of each of these studies and the synthesis of their results can be very useful in the theoretical framework of scientific knowledge and the agricultural practice and productivity of agri-food systems.
Classical approaches to summarizing evidence include narrative reviews, systematic reviews, and Meta-analysis. Meta-analysis (MA) encompasses a series of statistical methods that can be applied to a dataset, which have been compiled from several independent studies around an object of study. The objective of the MA is to identify consistent patterns and sources of variation between studies (Rueda-Calderón et al., 2020). Its application in various fields makes it a widely used methodology since it provides a single result of the evidence collected in a systematic review. The objective of this study was to analyze the relationships between VESS and soil properties such as soil bulk density (BD), total soil porosity (TP), soil penetration resistance (PR), macroporosity, microporosity, soil organic carbon (SOC), and mean weight diameter of stable aggregates (MWD), that make its adoption widely used in agriculture.
Visual Evaluation of Soil Structure (VESS)
This method consists of collecting with a shovel, a slice or block of undisturbed soil whose dimensions must be 25 cm deep, 10 cm long, and 20 cm wide, later it must be divided manually along fracture planes between aggregates (Ball et al., 2007).
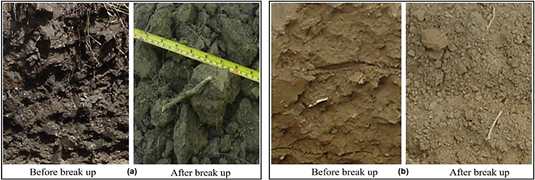
Figure 1 The appearance of soil block with (a) good soil quality and (b) poor soil quality in agricultural localities of Venezuela.
This is to expose and create structural units. The criteria for qualification of structural quality (Sq) are size, resistance, porosity, roots, and color. Sq ranges from 1 to 5, where 1 is good soil structure and 5 refers to poor soil structure (Figure 1). Factors that can increase the score are difficulty extracting the soil cutting, larger and angular porous aggregates, large and continuous wormholes, bunched and deviated roots, and gray soil (Guimarães et al., 2011).
For the assignment of the (Sq) scores, highly experienced users with knowledge of soil structure or soil physics do so confidently between categories, however, for inexperienced users, it only takes 1-2 hours of training to start making a meaningful score (Ball et al., 2017). The scoring categories from Sq 1 = best to Sq 5 = worst soil quality VESS.
2. Materials and methods
Collection of information through systematic review
The systematic review and MA were performed according to the procedures suggested in the PRISMA Recommendation Protocol (Moher et al., 2009), whose objective is to reduce the risk of publication bias and increase scientific validity. The research and selection of studies for the systematic review and MA included articles published between 2009 and 2022, ending on January 08, 2023. Scientific articles published in scientific journals indexed in the Science Direct, Web of Science databases, and Google Scholar were considered. In the systematic review, keywords related to the research question were selected, and from this compendium of words the following search construct was constructed in English: (VESS or “Visual Evaluation of Soil Structure”) and (“soil property”) for obtaining as much literature as possible regarding VESS studies in agriculture.
We obtained 6272 primary studies that mentioned VESS. Subsequently, through the Zotero bibliographic manager, the unification of the primary studies obtained in the seven electronic databases was carried out, as well as the elimination of duplicate primary studies, excluding 879 primary studies.
Then, those studies containing the search words in the title (512 primary studies) were selected. Next, the abstracts of the papers that passed the title filter were read and those that dealt with the correlation between VESS and soil properties were chosen (another 358 primary studies were discarded). The studies that passed the previous stage (154 papers), were read completely to select those studies where the information necessary for the construction of the database was published (Soil textures and/or management, correlation coefficient "r" of VESS with soil property, number of soil samples. Finally, the number of primary studies selected to make up the database was 20.
Conformation of the dataset to perform the meta-analysis
The dataset was made up of 25 primary studies; although, in some of them, several cases were evaluated, i.e., more than one with different soil properties, and therefore several correlation coefficients could be obtained, totaling n = 120 cases.
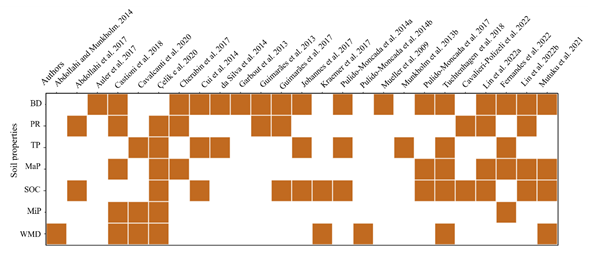
Figure 2 Identification of the primary studies (n = 25) considered in the meta-analysis and the soil properties correlated with the VESS. Note: BD = soil bulk density, TP = total soil porosity, PR = soil penetration resistance, MaP = macroporosity, MiP = microporosity, SOC = soil organic carbon, and MWD = mean weight diameter of stable aggregates.
The database contains four variables "Studies" to identify the primary studies through their authors and the year of publication, "Soil property" correlated with VESS, correlation coefficient "r" between VESS and other soil properties, and the last variable is the sample size "n" reported in each primary study. Only the soil properties that had the greatest number of primary studies were selected, with seven properties finally being selected: soil bulk density (BD), total soil porosity (TP), soil penetration resistance (PR), macroporosity (MaP), microporosity (MiP), soil organic carbon (SOC), and mean weight diameter of stable aggregates (MWD) (Figure 2).
Meta-analysis
A random effects model was used for the MA since high heterogeneity was observed between studies regarding the r values and the precision reported in equation 1: 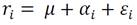 (1)
(1)
where  is the observed correlation,
  is the expected correlation between the VESS and the soil property, α 𝑖 is a random effect associated with each primary study that is assumed to have a normal distribution
  and
and  is a random error term with normal distribution
  .
.
Heterogeneity between studies was evaluated with the  statistic, which allows quantifying how much of the total variability in the statistic of interest should be attributed to the variation between studies (Higgins et al., 2003). It is an independent measure of the number of studies included in the meta-analysis and the unit of measurement used to quantify the effect studied (Rueda-Calderón et al. 2020). The statistic is expressed as a proportion, a value close to zero indicates that the observed variance is spurious, and therefore the primary studies can be considered homogeneous. Higgins et al. (2003) suggested that values up to 25% could be indicators of low heterogeneity, between 25 and 50% medium heterogeneity, and more than 75% high heterogeneity. Given the high value found for , a subgroup analysis was carried out considering the soil property as a grouping criterion. Strategy for performing a subgroup analysis; in addition, to controlling for heterogeneity between studies, makes it possible to detect how these variables contribute to estimating overall correlation. The dataset was analyzed by the meta package (Schwarzer, 2007) and using R software (R Core Team 2022).
3. Results and discussion
Correlations between VESS and other physical soil properties have been demonstrated by numerous authors, indicating that VESS, along with other visual assessment methods, can reveal differences between land use types and management options (Ball et al., 2017). VESS was related to a range of other indicators of soil quality, some of these studies are shown in Figure 3, which represents a circular dendrogram. The nodes (soil properties) are represented as circles. It displays hierarchically structured data with a radial tree structure, where the root node is in the center with the hierarchies (soil properties) moving outward. The node area was used to code the number of soil samples per property and a categorical color represented by the number of cases by authors to each soil property. BD is the property with the greatest number of cases in the MA (32), followed by SOC (21), total porosity (16), and resistance to penetration (16).
In the case of BD (Figure 3), the study by Auler et al. (2017) provides the highest number of cases in this property (9) with a total of 90 soil samples; followed by the study by Lin et al. (2022b) with a case of 96 soil samples. For SOC, the study by Lin et al. (2022b) provides a case of 96 soil samples, followed by Mutuku et al. 2021 with two cases and a total of 62 soil samples. Regarding PR, the case of Lin et al. (2022b) provides 96 soil samples, while Cherubin et al. (2017) and Abdollahi et al. (2017) each provide 3 cases with a total of 72 soil samples.
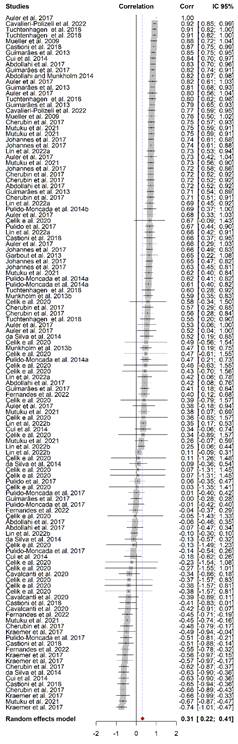
The graphical representation of the results was made with a Forest Plot (Figure 4), whose rows represent each of the primary studies and the correlation between VESS and soil properties without grouping. The effect size is the magnitude of the correlation of VESS with a given soil property. Thus, the graph allows visualizing the correlation (square) of each primary study and its confidence interval (CI) with a 95% confidence level. The narrower the confidence interval, the greater the precision of the estimated correlation coefficient. The square representing the effect size of each primary study varies across studies to reflect the weight of each in the estimate of the overall effect (weighted average correlation). A study with relatively good precision will be assigned a greater weight, influencing the estimate of the overall effect (average correlation across studies). Precision is governed by the sample size and by the residual variance of the study. At the end of the list of studies, the overall effect (diamond) is displayed. The overall effect of the correlation of VESS with soil properties was 0.31, with a confidence interval (CI) of [0.22; 0.41]. The heterogeneity between studies was high 𝐼 2 =94% and statistically significant p < 0.001; as an analytical strategy to control part of the heterogeneity, subgroups related to soil properties were considered (Figure 4).
In the case of BD (Figure 5), the greatest contributions are represented by Auler et al. (2017), Tuchtenhagen et al. (2018), Cherubin et al. (2017), Guimarães et al. (2013), Johannes et al. (2017), da Silva et al. (2014), Pulido-Moncada et al. (2014a) whose correlation with VESS was 0.58 with a confidence interval (CI) of [0.47;0.69]. On the other hand, in soil penetration resistance, the greatest contributions were reported by Cavalieri-Polizeli et al. (2022), Castioni et al. (2018), Guimarães et al. (2013,2017), Abdollahi et al. (2017), whose correlation with VESS was 0.72 with a confidence interval (CI) of [0.63; 0.82] (Figure 5). For its part, microporosity presented a correlation with a VESS of -0.21 with a confidence interval (CI) of [-0.45; 0.02]. Regarding SOC, the contributions of Tuchtenhagen et al. (2018), Cavalieri-Polizeli et al. (2022), Mutuku et al. (2021), Lin et al. (2022a), Pulido-Moncada et al. (2014a), Çelik et al. (2020), and Johannes et al. (2017) were the highest. The greatest contributions in the case of soil porosity were those of Johannes et al. (2017), Munkholm et al. (2013), and Pulido-Moncada et al. (2014a) whose correlation was 0.22 with CI [-0.04; 0.48]. Finally, the mean weight of the diameter of stable aggregates with Abdollahi & Munkholm (2014), Çelik et al. (2020), and Pulido-Moncada et al. (2014b), whose correlation was -0.17 with CI [-0.51; 0.18] (Figure 5).
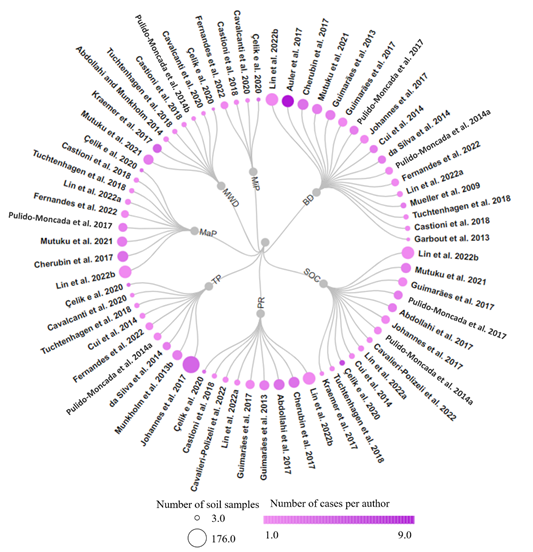
Figure 3 Circular dendrogram of the number of cases by soil property (n = 120) generated by RAWGraphs 2.0 beta (Mauri et al., 2017). Note: BD = soil bulk density, TP = total soil porosity, PR = soil penetration resistance, MaP = macroporosity, MiP = microporosity, SOC = soil organic carbon and MWD = mean weight diameter of stable aggregates.
These results clearly show the relationship between soil quality and visual soil assessment, better than other measures of soil quality in different soil types. Finally, the BD had a contribution to the model of 29.7%, followed by the SOC with 16.4%, the PR contributed 14.2%, and those with the least contributions were represented by the TP, MaP, MWD, and MiP with 13.2%, 12.2%, 10.9%, and 3.5%, respectively.
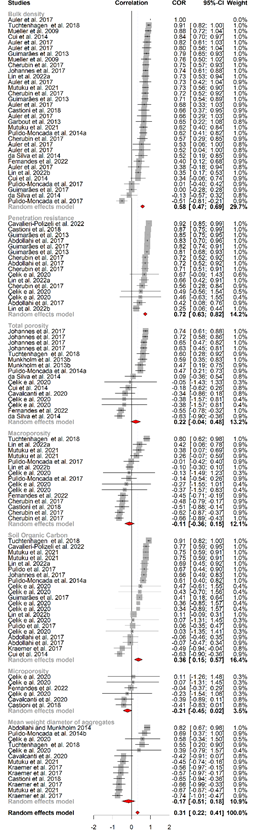
Figure 5 Forest plot resulting from the random effects model by subgroups. Correlations are presented in order from highest to lowest within each soil property (n = 120).
Figure 5 shows how the correlation between the VESS and the different soil properties varies. It is evident that the BD is a structural index and in almost all cases the correlation is positive. This BD makes the soil penetration resistance positively correlated in all cases. But the ambiguity in the results for SOC and total porosity is striking. Soil compaction in grasslands can weaken the soil's ability to store C and allow water infiltration. In this regard, Newell-Price et al. (2013) found that, along with compaction state, the most important factors influencing visual soil assessment (VSA) classification scores were soil organic matter content and percentage of sand content, which were positively correlated with soil compaction. VSA score, indicating the potential of these visual techniques to estimate SOC content.
The reported weights for soil properties such as BD, SOC, and PR were 29.7%, 16.4%, and 14.2%, respectively, while the weights for the rest were lower. This evidenced that the greatest contribution to the global correlation effect between the VESS values and the soil properties was obtained with the previously mentioned properties (Table 1).
Table 1 Estimation of the correlation between the VESS and soil properties, lower and upper limits, and weighting from the information contained in scientific publications (n =120)
| Soil Property | r | LL | UL | Weighing (%) |
| Bulk density | 0.58 | 0.47 | 0.69 | 29.7 |
| Total soil porosity | 0.22 | -0.04 | 0.48 | 13.2 |
| Soil penetration resistance | 0.72 | 0.63 | 0.82 | 14.2 |
| Macroporosity | 0.11 | -0.36 | 0.15 | 12.1 |
| Microporosity | -0.21 | -0.45 | 0.02 | 3.5 |
| Soil organic carbon | 0.36 | 0.15 | 0.57 | 16.4 |
| Mean weight diameter | -0.17 | -0.51 | 0.18 | 10.9 |
| Global Effect | 0.31 | 0.22 | 0.41 | 100 |
Note: (LL and UL) are the lower and upper limits of the 95% confidence interval of the correlation. (r) Correlation between VESS and land property. The Weighting corresponds to the weights resulting from a random effects model by subgroups of soil properties concerning their global effect.
Figure 6a shows a particular kind of network graph, which, allows seeing relationships among nodes (contributing authors). Nodes are displayed on the horizontal axis and the links as clockwise arcs. An arc above the nodes means a connection from the left to the right. In the first place, for bulk density, the greatest contribution was from Auler et al. (2017) with nine contributions whose correlations range from 0.38 to 1.00 (15.76%). Second, Castioni et al. (2018) with 0.87, Guimarães et al. (2013) with 0.85, and Abdollahi et al. (2017) with 0.83 (9.15%) presented the highest correlations of the VESS with the soil penetration resistance (Figure 6b). For the total porosity, Johannes et al. (2017) reported a correlation of 0.74 (9.5%) followed by Çelik et al. (2020) whose contribution represents 6.9% while da Silva et al. (2014) showed a negative correlation of 0.63 (2.5%) (Figure 7a). Regarding Macroporosity, the highest correlation (0.80) was evidenced in the study by Tuchtenhagen et al. (2018) with a contribution of 4.9%, besides, the significant contributions of Cherubin et al. (2017) (6.1%) and a lesser extent those of Çelik et al. (2020) (2.0%). On the other hand, the microporosity was represented by the contribution (1.6%) of the highest negative correlation by Castioni et al. (2018) (0.41). In the case of SOC (Figure 7b), the highest correlation was found in the study by Tuchtenhagen et al. (2018) with 0.91 (3.3%), although Çelik et al. (2020) (9.1%) reported a higher number of cases for this soil property. Finally, for the mean weight diameter of stable aggregates (Figure 8), the highest correlations between VESS and this property were reported by Abdollahi & Munkholm (2014) with 0.82 (5.3%) and Kraemer et al. (2017) with 0.74 (16.3%).
Dimensions of soil structure include processes of its formation by biological and physical action, processes involved in its stability under changing climatic and soil moisture conditions, and its ecological and hydraulic influence on the transport and storage of heat, gases (oxygen and CO2, among others), water and nutrients and their effects on crop yields in different agroecosystems (Mueller et al., 2013; Rabot et al., 2018). There are numerous interrelationships between soil structure, texture, BD, organic matter, total soil porosity, and PR, highlighting the importance of quantifying the distribution of pore size, bulk density, microbial populations, and the dynamics of C and N.
The VESS method has recently been used to compare the effectiveness of new visual soil assessment methods. For their part, Cherubin et al. (2017) reported significant relationships between soil quality indices (BD, macro-aggregate stability, SOC, microbial biomass, P, K, and pH) with the VESS method and that the variation of these indices was explained by the VESS method 51% for sandy soils and 25% under clay soils, which suggests that this method not only indicates soil quality but is also useful for monitoring quality indices.
Even though the VESS and the VSA methods have been efficient when evaluating the structure and quality of the soil (Munkholm et al., 2013) and in the same way have a correlation with each other, VESS results in sandy loam soils disagreed with VSA in the study by Pulido-Moncada et al. (2017).
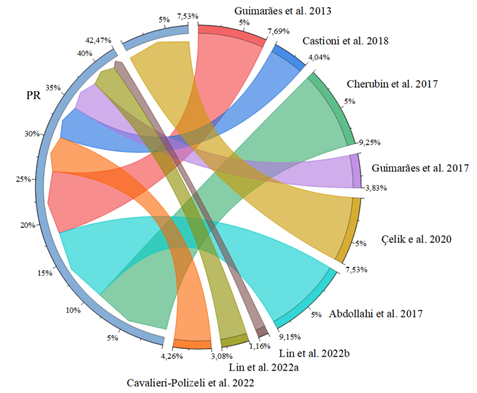
Figure 6 Arc Diagram of the correlation of VESS cases with soil properties (a) bulk density (BD) and (b) Penetration Resistance (PR).

Figure 7 Arc Diagram of the correlation of VESS cases with soil properties (a) Microporosity (MiP), Macroporosity (MaP), and Total Porosity (TP); (b) Soil Organic Carbon (SOC).
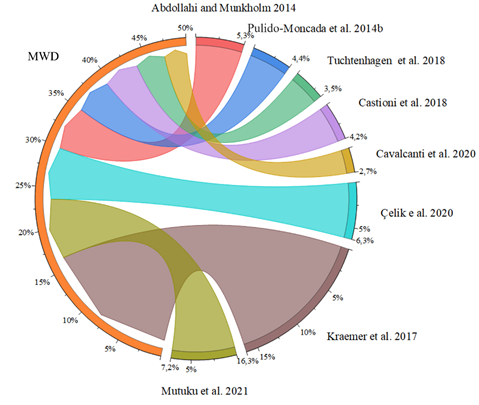
Figure 8 Arc Diagram of the correlation of VESS cases with mean weight diameter of stable aggregates (MWD).
Also, VESS scores correlate with SOC content (Tuchtenhagen et al., 2018), which is consistent with previous studies on tropical soils in Venezuela (Pulido-Moncada et al., 2014) and temperate soils in Ireland (Cui et al., 2014). Organic Carbon plays multiple roles in maintaining the chemical, physical, and biological properties, and processes in the soil, and is therefore considered the primary indicator for soil quality assessments (Cherubin et al., 2017). Therefore, the VESS scores can be integrated into a single value not only on the physical aspects of the soil but can also be one of the "core indicators" of soil quality (Ball et al., 2017).
Soil structure is one of the main soil quality indicators that directly affect yields. From a technical point of view, the “best” structure corresponds to a block or granular structure (crumb), which allows adequate movement of air and water in the soil. Soils with good structure normally have a lower bulk density and therefore higher porosity. On the contrary, soils with poor structure tend to be compacted, with little aeration, less water retention capacity, and greater susceptibility to water and wind erosion. The structure can be characterized by its size, external configuration, or pore distribution. Among these possibilities, the information concerning internal porosity is the most useful when characterizing the soil as a medium for plant growth (Johannes et al., 2017; da Silva et al., 2014).
Our results indicated that VESS is a useful and reliable semi-quantitative method that integrates physical functions (e.g., aeration, root growth, and water availability) related to the structural and physical quality of soils. Therefore, VESS could be used as an alternative or complementary tool to assess the impacts of cropping practices on soil structural quality. However, it is necessary to consider that the quantitative physical properties of the soil have site-specific responses, which are highly influenced by the inherent characteristics of the soil and, therefore, become one of the drawbacks of using one of these properties alone as an indicator of soil structure or quality.
The recent scientific output on VESS and the application of techniques such as meta-analysis are especially important in agriculture, where large-scale randomized controlled trials can be difficult due to the complexity and variability of farming systems. By synthesizing the findings from multiple studies, meta-analysis can provide a more complete and accurate understanding of the effectiveness of different agricultural practices or technologies.
Secondly, the boom that studies have had on certain machine learning algorithms to analyze large amounts of data to identify patterns and make predictions about future results is interesting. In tropical agriculture, this can be used to optimize crop yields (Olivares et al., 2022b), predict crop failures (Olivares et al., 2022c), or identify which agricultural practices are most effective under different conditions (Fernandes et al., 2022). In general, the use of meta-analysis and machine learning algorithms in agriculture has the potential to improve the efficiency and effectiveness of agricultural practices, which would lead to higher production and food security.
It has been concluded that the VSEE method is sensitive enough to detect changes in the structural quality of the soil as a result of differences in land use as indicated by the results of Mutuku et al. (2021) in arid zones, Cavalieri-Polizeli et al. (2022) in unique and integrated farming systems, Fernandes et al. (2022) in tropical areas and Lin et al. (2022a) (2022b) in temperate zones. This demonstrates its potential for direct on-farm evaluation.
4. Conclusions
The visual evaluation of soil structure is an immediate and effective diagnostic tool, which serves to know the physical quality of the soil. The best thing is that its results are easy to interpret and understand for farmers. The present study demonstrated that VESS is a reliable semi-quantitative method to assess soil quality and could be considered a promising visual predictor of soil physical properties such as bulk density, soil organic carbon, and soil penetration resistance.
In short, the results of the meta-analysis carried out in this study are scientifically rigorous and have a series of particularities that make them especially attractive. In the first place, the meta-analysis allowed a greater generalization of its results concerning the individual studies, that is, it presents a greater external validity since the samples of the different studies do not come from the same population. Second, by increasing the statistical power, in addition to increasing the ability to find statistically significant differences, it also made it possible to increase the precision in the estimation of the effect, though narrower confidence intervals. Thirdly, the meta-analysis made it possible to assess the discrepancies between the results of different studies and to suggest explanatory hypotheses for this heterogeneity. Finally, conducting this type of meta-analysis is less expensive and poses fewer logistical problems than conducting randomized field trials with a large soil sample.

