


 Inglês (pdf)
 Artigo em XML
 Referências do artigo
 Enviar este artigo por email
 Citado por SciELO
  Similares em
SciELO
Similares em
SciELO 
 Permalink
1. Introduction
Starches in their natural form have undesirable characteristics that make them unsuitable for most applications. Therefore, are subjected to various modifications to increase their positive features and decrease their defects (Mahmood et al., 2017; Punia, 2020). Modification is process of changing the characteristic properties of native starch with the use of physical (thermal and non-thermal), chemical or enzymatic methods (Punia, 2020). Esterification with octenyl succinic anhydride (OSA) is a chemical method that introduces hydrophobic groups to starch granule, generating concomitant changes in the structure of granules, allowing amphiphilic hydrocolloids to be obtained (Altuna et al., 2018; Zhao et al., 2022). The OSA modification of starch produces an amphiphilic polysaccharide that has the ability to stabilize emulsions (Agama-Acevedo & Bello-Perez, 2017; Zhao et al., 2022). Octenyl succinic anhydride (OSA) modified starches have been used in diverse industrial applications, particularly as a food additive, for greater than half a century. Interest in these products has grown in recent years; hence, the availability of new methods and applications. Due to the combination of the hydrophobic and steric contribution of OSA and the peculiar highly branched macromolecular structure of starch, these starch derivatives display useful stabilizing, encapsulating, interfacial, thermal, nutritional, and rheological properties (Bist et al., 2023; Dapčević-Hadnađev et al., 2021; Sweedman et al., 2013). However, the reaction between starch granules and OSA is hindered due to poor penetration of oily OSA droplets into starch granules in an aqueous reaction system. On the other hand, high-speed shearing is widely used in the food industry, demanding high shear, cavitation, and collision force, which makes the material mix, disintegrate, disperse, homogenize and emulsify. In this sense, high-speed shearing could reduce the size of OSA droplets and promote a more homogeneous distribution of groups in the starch granule (Wang et al., 2015). High-speed shear-assisted OSA modification influences the properties of starches achieving to destroy the surface of starch granules, reducing the degree of crystallinity, and improving the stability of the starch paste (Shahbazi et al., 2018; Wang et al., 2015,2016). However, studies on the effect of high shear rate on the properties of potato OSA starch are limited. Therefore, this study aimed to evaluate the properties of high-speed shear-assisted OSA-modified potato starch.
2. Materials and methods
2.1 Materials
Native starch was obtained from Peruvian native potatoes, variety Valentín Huancco, following the methodology described by Martínez et al. (2021). All chemicals were commercial products of analytical or reagent grade.
2.2 Preparation of OSA starches under shear
The starch was suspended in distilled water (35%, w/w) at different stirring speeds of 2.8 x 10³, 5.6 x 10³, and 7.4 x 10³ rpm in a high-speed homogenizer (Ultraturrax Heidolph, Germany). The solution was homogenized every 10 minutes to avoid overheating, during which period of rest magnetic stirrer (Heidolph, Germany) was used at 500 rpm. The pH of suspension was adjusted to 8.0-9.0 by adding NaOH solution (3%, w/w) monitored by a pH meter (pH-Meter Basic 20, Crison, Spain), and the temperature was controlled at 35°C. In the first hour OSA (3%, dsb) was added, and the reaction was allowed to proceed for a total of 2 hours. After the reaction, the pH was adjusted to 6.5 with HCl solution (3%, w/w). The mixture was washed twice with distilled water and twice with ethanol. Starch samples were oven-dried (MEMMERT®, Germany) at 40 °C for 24 h and then passed through a 100 mesh nylon sieve (Wang et al., 2015; Zhang et al., 2011). They were stored in a plastic bottle until analysis.
2.3 Determination of degree of substitution
Degree of substitution was determined as previously described (Song et al., 2006; Timgren et al., 2013). The OS-starch sample (1.25 g, dry weight) was accurately weighed and dispersed in 12.5 mL of HCl (0.1 mol/L) and stirred for 30 minutes. The suspension was centrifuged at 3000 x g for 10 minutes. Then the pellet was washed with 25 ml of ethanol (90%) and distilled water three times. Subsequently, the starch was suspended in 75 mL of water and heated in a boiling water-bath for 10 minutes and cooled to room temperature. The starch solution was titrated with NaOH solution (0.1 mol/L) to pH 8.3 using a pH meter. The degree of OSA substitution (number of OSA groups/ anhydroglucose unit) in starch granules was calculated using equation 1.
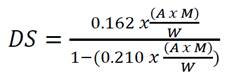 ()1
()1
Where A is the titration volume of the NaOH solution (mL); M is the molarity of NaOH solution; and W is the dry weight (g) of the OSA-starch.
(PLM)
The morphology of the starch granules was examined by SEM (FEI, Inspect S50, Czech Republic) using magnification of 1000x, and 4000x. The starch samples were thinly gold-coated under vacuum and observed at an accelerating voltage of 10kV. The birefringence of the starch granules was examined under PLM (Leica, IICC50, Germany) by placing the starches on slides with an objective of 40x (Schoch & Maywald, 1956).
2.5 FTIR spectroscopy
The FT-IR spectra of the starch samples were obtained on a spectrometer (Perkin Elmer modelo Frontier, Waltham, MA) using the attenuated total reflection (ATR) accessory. Each FT-IR spectrum was recorded in the wavenumber range of 4000-400 cm−1, with a resolution of 4 cm−1 and an average of 64 scans.
2.6 Thermal properties
The methodology described by Lin et al. (2013) was followed with slight modifications. The thermal gelatinization properties of starch were determined using a DSC (TA Instruments, USA). The starch sample (approximately 20 mg) was weighed into the capsule, and ultra-pure water (1:3, starch: water) was added. Then the capsule was sealed and equilibrated at room temperature for 1 h. Samples were heated at 25-115 °C at a heating rate of 2 °C/min. The onset (To), peak (Tp), conclusion (Tc) temperatures, and gelatinization enthalpy (ΔH) were estimated directly by the instrument software.
2.7 Rheological properties
Starch suspensions were prepared at 4% (w/w) in distilled water, gelatinized by cooking with continu ous stirring at 90 °C in a water bath for 30 min, and then cooled to 25 °C before being subjected to the rheological test. These tests were carried out using a hybrid rheometer (Discovery HR-3, TA Instruments, USA) with grooved plate geometry (40 mm diameter) with a gap of 1 mm. Before each rheological test, the samples were allowed to equilibrate at 25 °C, using a Peltier system for 2 min.
2.7.1. Flow behavior
The methodology described by Augusto et al. (2012) with slight modifications. The sample was subjected to shearing at 300 s-1 for 10 minutes. Then, on the same sample, the steady state shearing experiments were carried out in the shear rate range (Σ) from 0.01 to 100 s-1 and from 100 to 0.01 s-1. The resulting flow curves are described by the Herschel-Bulkley law model:
/
Where, σ is the shear stress (Pa), σo is the yield point (Pa), Σ is the shear rate (s-1), k is the consistency coefficient (Pa∙sn), and η is the rheological index (dimensionless).
2.7.2. Viscoelastic properties
The methodology described by López et al. (2010) with slight modifications. An amplitude sweep (0.1-100 Pa) was performed to determine the region of linear viscoelasticity at a constant frequency of 1 Hz. Then a frequency sweep was performed at a constant strain (1 Pa) and in the range of 0.01-10 Hz. The viscoelasticity moduli determined were: G' (storage modulus), G'' (loss modulus) and ղ* (complex viscosity) depending on the oscillatory frequency. The resulting curves were described by the following power law models: G' = k' x ωn′ and G'' = k'' x ωn′′; where G' is the storage modulus (Pa), G'' is the loss modulus (Pa), ω is the frequency (Hz) and k', k'', n', and n'' are experimentally determined constants.
2.8 Emulsifying activity (EA) and emulsion stability (ES)
According to a previous method (Li et al., 2017), 1g of the starch sample was dispersed in 50ml of deionized water, followed by heating in boiling water. Then 10 ml of commercial oil was slowly added to the solution, which was homogenized using a homogenizer (Ultraturrax Heidolph, Germany) at 13,500 rpm for 2 min. Approximately 100µl of the solution was withdrawn and added to 25ml of 0.1% sodium dodecyl sulfate solution. The absorbance (A0) at 500nm was determined immediately and then again after 10min (A1) using a spectrophotometer (Genesys™ 10S, Thermo Scientific, USA). The value of ES and EA was calculated as follows:
ES (%) = A 0 /A 1 x 100
EA (m2/g) = 2 x 2.303 x A 0 x N / C x φ x 10000
where N is the starch dilution ratio, C is the starch concentration (g/mL), and φ is the volumetric fraction of emulsion oil (equal to 0.25).
2.8.1 Microscopic observation of the emulsion
Image analysis of the emulsions was performed under an optical microscope (Leica, IICC50, Germany). The desired amount of emulsion was dropped onto a clean microscope slide and then gently covered with a coverslip. Images were examined using magnification of at 100x.
2.9 Statistical analysis
Each sample was measured in triplicate, and the means and standard deviations were reported. The mean values and differences were analyzed using Duncan's multiple range test. Means were tested for least significant differences (LSD) with Statgraphics 18.0 statistical software for Windows.
3. Results and discussion
3.1 Degree of substitution
The degree of substitution (DS) of native starch and OSA starches are presented in Table 1. It was observed that as the shear rate was increased, the DS gradually increased from 0.023 to 0.027 suggesting that the high shear rate would cause an increase in the surface area by destroying the granular surface and a possible reduction in the size of the OSA droplet which would increase the reaction area between OSA and starch granules (Wang et al., 2013). These results were similar to those reported for the DS of corn starch OSA increased from 0.0182 to 0.0202 (Wang et al. 2015). Other studies for traditional OSA modification of potato starch indicated a DS range of 0.0064 to 0.0211 (Hui et al., 2009; Wang et al., 2010). It could be inferred from the results obtained that the OSA modification assisted by high-speed shearing probably produces the OSA reagent reduces its size and reacts better with the surface of the potato starch granules, favoring the modification reaction and obtaining a higher DS.
Table 1 Degree of substitution of OSA starches
| Sample | DS |
| M0 | - |
| M1 | 0.023a ± 0.00 |
| M2 | 0.024 a ± 0.00 |
| M3 | 0.027 a ± 0.00 |
aMeans within a column with different letters are significantly different (p < 0.05) by LSD least significant test. M0: native starch; M1-M3: refer to different agitation speeds (M1: 2.8 x 10³ rpm, M2: 5.6 x 10³ rpm y M3: 7.4 x 10³ rpm) by a high-speed homogenizer.
3.2 Scanning electron microscopy (SEM) and polarized light microscopy (PLM)
Native starch granules and OSA starches are observed through SEM and polarized light microscopy (PLM) (Figure 1).
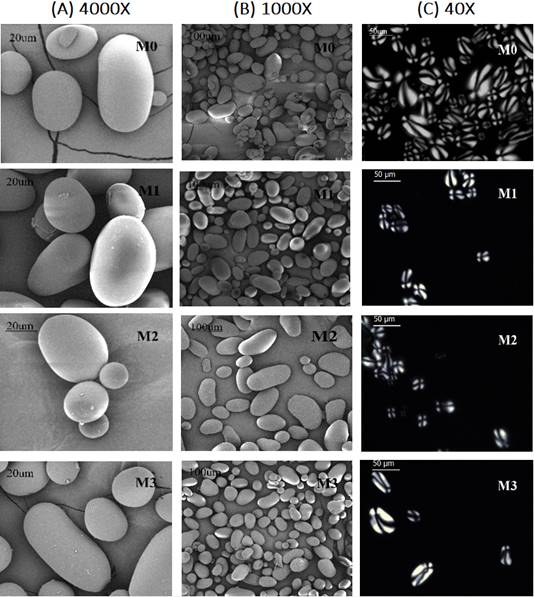
Figure 1 Morphology starches, as observed by SEM (columns A, B) and polarized light microscopy (column C). M0: native starch; M1-M3: refer to different agitation speeds (M1: 2.8 x 10³ rpm, M2: 5.6 x 10³ rpm y M3: 7.4 x 10³ rpm) by a high-speed homogenizer.
The native starch granules (M0) presented a smooth surface, ellipsoidal and spherical shapes (Fig.1-A-B). Various studies for potato starch granule surfaces indicated the same morphological characteristics (Hui et al., 2009; Martínez et al., 2019,2021,2022; Wang et al., 2010). The native starch granules under MLP showed typical birefringence patterns with central malt crosses (Fig.1-C). Similarly, some studies on potato starches showed similar well-defined birefringence patterns in native granules (Martínez et al., 2019,2021,2022). OSA starch granules (M1-M3) showed that the shear-assisted OSA treatment (Fig. 1 A-B) caused few changes in the structure of starch granules compared to native starch. OSA starch granules exhibit slightly roughened surfaces with small new adhesions on their surface but mostly kept their original ellipsoidal shape.
In this sense, some studies on the morphology of starch granules indicated that although there were slight changes in the surface of OSA starches, however, many of them their initial granular structure was still preserved (Shahbazi et al., 2018; Wang et al., 2015). Along the same lines, OSA starch granules under MLP (Fig. 1-C) did not show an evident alteration in the shape of the granules nor maltese cross alteration of the OSA starch granules assisted with different shear rates.
3.3 FTIR spectroscopy
The FTIR spectra of samples of native potato starch (M0) and OSA potato starch (M1, M2, M3) assisted with different shear rates are shown in Figure 2. It can be observed that native potato starch and potato OSA starch presented similar profiles in the fingerprint region (1200 cm-1 a 600 cm-1) (Ramírez-Hernández et al., 2019). In the fingerprint region of the native potato starch spectrum (Figure 2), four characteristic peaks attributable to C-O bond stretching appeared at 1155, 1080, 1021, and 930 cm-1 (Fang et al., 2004).
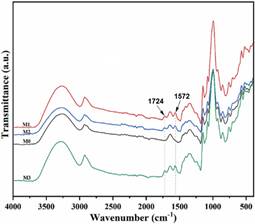
Figure 2 FTIR spectra of native potato starch and OSA starches. (u.a.: arbitrary units); M0: native starch; M1-M3: refer to different agitation speeds (M1: 2.8 x 10³ rpm, M2: 5.6 x 10³ rpm y M3: 7.4 x 10³ rpm) by a high-speed homogenizer.
Another feature peak occurred at 1640 cm-1, presumably emerging from tightly bound water in the starch granules. The large broadband that appears most intensely at 3300 cm−1 could be attributed to the vibration of the hydroxyl groups (O-H). The band at 2936 cm-1 was characteristic of the C-H stretching vibration. However, compared to the spectrum of native potato starch, the spectra of OSA potato starch samples showed a new peak at 1724 cm-1 (Fang et al., 2004; Hui et al., 2009; Thygesen et al., 2003; Wang et al., 2010). This peak corresponded to the characteristic IR stretching vibration of CO, suggesting the formation of ester carbonyl groups (Fang et al., 2004). Another new peak appeared at 1572 cm-1, which was attributed to asymmetric carboxylate stretching vibration (RCOO-) (Hui et al., 2009; Nagaoka et al., 2005; Wang et al., 2010). The difference in transmittance of the FTIR spectra of OSA starch and native starch is because the grafted groups in the OSA modification are selectively absorbed by infrared radiation, giving rise to the appearance of a new signal (Wang et al., 2022). Therefore, the esterification reaction of starch by OSA imported new groups, namely ester carbonyl groups and RCOO-.
3.3 Thermal properties
The thermal properties of native potato starch (M0) and OSA starches (M1, M2, M3) are presented in Table 2. Gelatinization of native starch began at 59.66 °C (To), reaching a maximum of 63.25°C, and was completed at 69.28 °C, with an enthalpy change of 12.61 J/g. These values coincide with a previous study on native starch (Martínez et al., 2021). On the other hand, a significant difference was found in the initial temperature (To), peak gelatinization temper ature (Tp), and final temperature (Tf) between native starch (M0) and OSA starches (M1, M2, M3). The To, Tp, and Tf of OSA starches decreased with increasing shear rate. Otherwise, there was no significant difference in enthalpy between M0 and OSA starches (M1, M2, M3). However, it was observed that M0 required more energy to gelatinize. Likewise, a slight reduction in the enthalpy of OSA starches was evidenced as the shear rate increased, which could be attributed to the fact that the high-speed shear treatment reduced the amount of energy needed to gelatinize the starch (Kaur et al., 2013). These results were consistent with previous studies reporting that the sheer force of the shearing process could cause the surface of the granules to rupture, requiring less energy to gelatinize (Kaur et al., 2013; Shahbazi et al., 2018; Wang et al., 2015). In that sense, another study for assisted OSA modification under high shear conditions reported a decrease in gelatinization temperature and enthalpy change of OSA corn starches compared to native starch (Wang et al., 2016). It could be inferred from the results obtained that the shear-assisted OSA modification would cause damage to the starch granules to a certain degree, favoring swelling and reducing the energy required for gelatinization.
Table 2 Thermal properties of OSA starches
| Sample | To (°C) | Tp (°C) | Tf (°C) | ∆Hgel (J/g) |
| M0 | 59.66 ± 0.09a | 63.25 ± 0.06a | 69.28 ± 0.07a | 12.61 ± 0.26a |
| M1 | 56.50 ± 0.58b | 61.54 ± 0.58b | 67.52 ± 0.42b | 12.42 ± 0.97a |
| M2 | 55.35 ± 0.06 c | 60.39 ± 0.34c | 67.06 ± 0.39b | 12.21 ± 1.83a |
| M3 | 54.88 ± 0.75 c | 60.41 ± 0.27c | 67.09 ± 0.48 b | 12.44 ± 0.98a |
aMeans within a column with different letters are significantly different (p < 0.05) by LSD least significant test. M0: native starch; M1-M3: refer to different agitation speeds (M1: 2.8 x 10³ rpm, M2: 5.6 x 10³ rpm y M3: 7.4 x 10³ rpm) by a high-speed homogenizer.
3.4 Rheological properties
3.4.1 Flow behavior
The Herschel-Bulkley model parameters, these are the initial shear stress (σo), consistency coefficient (k), and rheological index (n) corresponding to the modified starch pastes are reported in Table 3. There was a notable significant difference in the initial shear stresses (σo) and consistency coefficient (K) between native starch (M0) and OSA starches (M1, M2, M3). The values of n were less than 1, which would indicate that the native starch pastes and modified starches studied presented a behavior similar to pseudoplastic when they began to flow (Velásquez-Barreto & Velezmoro, 2018). The correlation coefficient (0.99) indicated that the data obtained in the flow measurements of native potato starch gels and OSA starches fitted well with the Herschel-Bulkley model. On the other hand, the estimated values of the parameter n were lower in the modified starch pastes, which would indicate that the modification process with OSA utilizing high shear homogenization altered the behavior of the modified starch pastes. In like manner, a significant decrease in viscosity is observed in OSA starches compared to native starch (Figure 3), pre sumably due to attrition-induced granule damage.
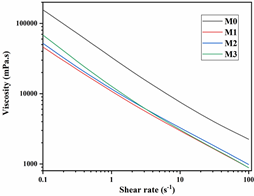
Figure 3 Viscosity curves of native potato starch and OSA starches. M0: native starch; M1-M3: refer to different agitation speeds (M1: 2.8 x 10³ rpm, M2: 5.6 x 10³ rpm y M3: 7.4 x 10³ rpm) by a high-speed homogenizer.
Short chain cleavage of amylopectin could give less contribute to paste viscosity compared to long chain cleavage of amylopectin due to the smaller radius of gyration of molecules in pastes (Han et al., 2002). Similar behaviors were reported by Wang et al., 2015 for OSA corn starch pastes assisted with high shear homogenization. Furthermore, amylopectin is more sensitive to mechanical force (Thitipraphunkul et al., 2003).In particular study on OSA starches showed similar decreases in paste viscosity of OSA starches compared to unmodified starch (Li et al., 2017). Therefore, the high shear homogenization would promote the breakdown of amylopectin, resulting in a reduction in viscosity as the speed of homogenization increases during the OSA modification of the starches.
3.4.2 Viscoelastic properties
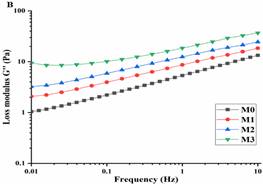
The values of the slopes (n' and n''), intercepts (k' and k'') and R2 for the native starch pastes and OSA starches are shown in Table 4. The values of parameter k' varied between 8.10 to 59.04 (for G') and those of parameter k'' between 5.41 to 19.81 (for G''). The values n represents the susceptibility of the storage modulus (G') and loss modulus (G'') to changes as a function of angular frequency; thus, the values of the slopes of n' ranged from 0.19 to 0.41 (for G') and values of n'' ranged from 0.27 to 0.39 (for G''). In addition, it is observed that the values of G' were higher than those of G" for each starch, that is, the elastic behavior would prevail over the viscous behavior (Velásquez-Barreto & Velezmoro, 2018). In Figure 4-A-B, it can be clearly seen how the modules G' and G'' corresponding to the OSA starch gels (M1, M2, M3) were significantly higher compared to those found for the native starch gel (M0). Velásquez-Barreto et al., 2020 reported similar behaviors for G' and G" parameters for goose starch pastes with OSA modification. The OSA groups would reduce the interaction of the molecules on the surface of the starch granules, which leads to a greater decomposition of starch granules under heating and shear conditions, resulting in increased water penetration and reduced thickening capacity. Some studies reported similar changes of viscoelastic properties in pastes of OSA starch where storage modulus (G'), loss modulus (G'') and strain increased with OSA esterification (Park et al., 2004; Sharma et al., 2016; Wen et al., 2020). Therefore, it could be considered that the shear-assisted OSA modification process altered the behavior of the pastes, making them more elastic than viscous.
Table 3 Parameters of Herschel-Bulkley model of OSA starch gels
| Sample | σ0 (Pa) | K (Pa.sn) | n | R2 |
| M0 | 7.39 ± 1.67a | 22.80 ± 2.57a | 0.49 ± 0.01a | 0.99 ± 0.00a |
| M1 | 1.19 ± 0.06b | 9.65 ± 0.49b | 0.48 ± 0.00a | 0.99 ± 0.00b |
| M2 | 1.80 ± 0.46b | 10.81 ± 1.14b | 0.48 ± 0.01a | 0.99 ± 0.00b |
| M3 | 3.20 ± 0.26c | 8.26 ± 1.44b | 0.49 ± 0.01a | 0.99 ± 0.00c |
aMeans within a column with different letters are significantly different (p < 0.05) by LSD least significant test. M0: native starch; M1-M3: refer to different agitation speeds (M1: 2.8 x 10³ rpm, M2: 5.6 x 10³ rpm y M3: 7.4 x 10³ rpm) by a high-speed homogenizer.
Table 4.Viscoelastic properties of OSA starch gels
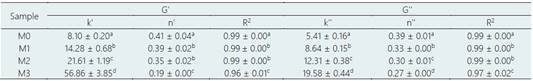
aMeans within a column with different letters are significantly different (p < 0.05) by LSD least significant test. M0: native starch; M1-M3: refer to different agitation speeds (M1: 2.8 x 10³ rpm, M2: 5.6 x 10³ rpm y M3: 7.4 x 10³ rpm) by a high-speed homogenizer.
3.5 Emulsion Stability (ES) and Emulsifying Activity (EA)
The emulsifying stability (ES) and emulsifying activ ity (EA) characteristics of shear-assisted OSA starches for different rates are presented in Table 5. There is no significant difference in ES and EA between the OSA starches (M1, M2, M3). However, a slight increase in ES and EA proportional to the shear rate applied to the starch granules is observed during OSA modification. When octenyl succinate starch is used in oil and water emulsion, the hydrophobic alkenyl chains are drawn into the oil phase and the hydrophilic sodium carboxylate groups into the water phase. These allow the formation of an interfacial film at the oil-water interface (Li et al., 2017). Various investigations report that OSA starches with higher DS show better emulsifying capacity compared to native starches, due to hydrophobic nature of the modified OSA starch particles, that migrate to the oil/water interface to form a good barrier against droplet coalescence, leading to emulsions with improved stability (Li et al., 2017; Li et al., 2019; Lopez-Silva et al., 2019; Miao et al., 2014; Wang et al., 2010). Different studies for high-speed shear-assisted OSA starch emulsions indicated the same emulsion stability characteris tics, where OSA starch has a higher binding capac ity and affinity to the oil-water interface compared to unmodified starches (Shahbazi et al., 2018; Wang et al., 2015;2016). Therefore, as the shear rate in creases in the OSA modification, there would be more homogeneously distributed octenyl succinic groups (higher DS), which would gradually increase the ES and EA.
Table 5 Emulsion stability of OSA starches
| Sample | ES (%) | EA (m2/g) |
| M0 | ---- | ----- |
| M1 | 100.61 ± 1.15 a | 3.13 ± 0.75 a |
| M2 | 100.70 ± 0.47 a | 3.42 ± 0.68 a |
| M3 | 100.99 ± 1.46 a | 3.31 ± 0.62 a |
aMeans within a column with different letters are significantly different (p < 0.05) by LSD least significant test. M0: native starch; M1-M3: refer to different agitation speeds (M1: 2.8 x 10³ rpm, M2: 5.6 x 10³ rpm y M3: 7.4 x 10³ rpm rpm) by a high-speed homogenizer.
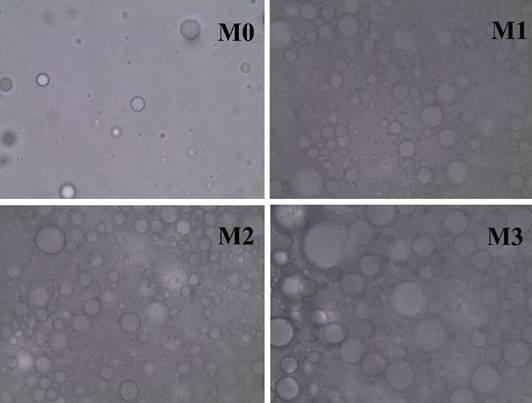
3.5.1 Emulsion microscopy
The native starch emulsions and the OSA starches were observed through an electron microscope (Figure 5). The native starch emulsion (M0) showed emulsions with non-uniform appearance. On the other hand, the OSA starch emulsions (M1, M2, M3) showed emulsions with a more uniform droplet size distribution. OSA starch emulsions present more homogeneous patterns compared to the native starch emulsion, these results coincide with those reported by Wang et al. (2016), where the OSA starch emulsions were pretty uniform. Similarly, several studies on OSA starches showed similar homoge neous emulsions compared to unmodified starch (Li et al., 2019; Lopez-Silva et al., 2019; Wang et al., 2015). As a result, it can be inferred that the emul sions with OSA starch were influenced by DS from the results obtained; a higher DS value favored the emulsifying capacity of the starch granules, obtain ing more homogeneous emulsions (Li et al., 2019).
4. Conclusions
The application of high shear rates in the OSA modification was able to raise a gently degree of substitution; consequently, this change translated into a lower initial gelatinization temperature as the shear rate increased, as well as changes in the rheology of the gels. Modified starch with rate of agitation during OSA modification. The results indicated that high-speed shear assistance can be used to potentially improve the OSA modification reaction and achieve an increase in DS and can improve rheological characteristics and thermal properties. However, it is necessary to carry out more tests, such as increasing the shear rate, performing thermogravimetric curve analysis, particle size analysis, and digestion to find the potential application in the food industry.

