


 Inglés (pdf)
 Articulo en XML
 Referencias del artículo
 Enviar articulo por email
 Citado por SciELO
  Similares en
SciELO
Similares en
SciELO 
 Permalink
1. Introduction
In recent decades, phosphorus (P) fertilizers have been applied in excess to meet the growing demand for food production. However, only a small fraction of the fertilizer applied is absorbed by crops, and excess P can end up in aquatic systems (Abeysinghe et al., 2022). Globally, there is an invisible water quality crisis that eliminates one-third of potential economic growth in highly polluted areas, threatening human and environmental well-being (Damania et al., 2019). Phosphorus load in water sources can come from agriculture, industry and detergents, which cause the death of aquatic species, algae blooms and parasitic infections (Xie et al., 2017). Phosphorus is the main component causing eutrophication in lakes, coastal areas and other confined water bodies (Li et al., 2018). Therefore, these water resources must be protected from pollution to ensure their conservation.
The critical concentrations for incipient eutrophication are about 0.1 - 0.2 mg/L P in running water (Omwene et al., 2018). Phosphate levels exceeding the threshold by 0.02 mg/L can trigger eutrophication of surface waters (Ahmed & Lo, 2020; Pan et al., 2020). On the other hand, in Peru, the plantain chip industry generates large quantities of peel from the production of "chifles" (fried plantain slices), both for the domestic market and for export. Plantain peel is a cellulosic, biodegradable, abundant material with potential as an adsorbent (Nnamdi Ekwueme et al., 2023). When subjected to high temperatures, pores form on its surface due to the release of internal volatile substances, thus increasing the internal surface area by cracking the organic matter (Gelardi et al., 2019). Thus, obtaining the capacity to adsorb different contaminants.
There are several investigations on the use of plan tain residues for the removal of pollutants by adsorption. For example, adsorbent composed of amino-functionalized Zn-doped agrogenic clay from kaolinite, papaya seed and plantain peel using a microwave-assisted technique (Unuabonah et al., 2017); iron oxide functionalized activated carbon (Gbangbo et al., 2023); adsorbent from banana peel fiber by carbonization and esterification processes with human organic acid (Nnamdi Ekwueme et al., 2023). The preparation processes were tedious and multi-step. Other research, concerning easily prepared biochars for aqueous phosphate removal (Abeysinghe et al., 2022; Contreras-López et al., 2021; Marshall et al., 2017) evaluated the efficacy for phosphate removal at concentrations >10 mg/L. Therefore, a simple, environmentally friendly and scalable route for the development of charcoal from plantain peels without chemical activation reagents, efficient for adsorbing phosphate at concentrations similar to those of water sources at risk of eutrophication, is needed.
Consequently, the aim of this study was to elaborate an adsorbent from plantain peel of the bellaco variety, with a simple procedure, to evaluate its capacity to remove phosphates from aqueous solutions at phosphate concentrations similar to those of water sources at risk of eutrophication (0.30 mg/L) and analyze adsorption parameters. Batch adsorption with phosphate solution and inclusion of sodium azide as preservative and calcium chloride as seeding material was efficient for phosphate removal (Marshall et al., 2017). The effect of carbonization temperature and pH of the aqueous solution on the adsorption process was studied using a factorial design 32. The experimental data were analyzed based on pseudo-first order, pseudo-second order and intraparticle diffusion kinetic models. The fit of the experimental isotherms was evaluated using Langmuir and Freundlich isotherm models.
2. Materials and methods
2.1. Adsorbent Preparation
The green plantain (Musa paradisiaca) of the bellaco variety came from the district of Pangoa, province of Satipo, Junín region, Peru (between 73º52'30" and 74º29′30″ west longitude, and 11º27′30″ and 12º15′30″ south latitude). Bunches of five plants were harvested. Then, the plantain bunches were transferred to the Bromatology Laboratory at Universidad Nacional Mayor de San Marcos in Lima, Peru. The green plantains were washed and disinfected with sodium hypochlorite solution at 100 ppm for 3 minutes to remove dust and impurities. They were then rinsed with non-sterile deionized water (QUIMPAT REPRESENTACIONES SAC, Peru).
The plantain peels were manually cut into small pieces of equal size and were dried in oven (Memmert UF55, Germany) at 105 °C for 12 h. Then, the previously dried plantain peels were ground into powder in a coffee grinder (Bosch TSM6A013B, China) and then sieved through an ASTM 30 mesh (0.60 mm) to remove the larger pieces.
The powdered plantain peel was placed in a series of porcelain crucibles and covered with their lids in an electric muffle furnace (RELES 18x18, Peru) without nitrogen protection (Bai et al., 2020). Then, it was carbonized at 500, 600 and 700 ºC for one hour in an electric muffle furnace. Based on different pyrolysis temperatures (500, 600 and 700 °C), each treatment was coded as P500; P600 and P700, respectively.
2.2. Physical-chemical adsorbent characterization
The moisture, pH level and ash content of the adsorbent were determined using the standard methods ASTM International (2017a,2017by2018), respectively. The adsorbent active sites were determined through the Boehm method to assess the existing surface oxygenated groups (Boehm, 1994). For these purposes, 0.20 g of adsorbent was placed in 50 mL 0.10 M NaOH solution. The mixture was kept covered for five days at room temperature with occasional stirring which consisted of placing the flasks in an orbital shaker (OHAUS SHLD0415AL; Switzerland) for 1 hour each day. A 10 mL aliquot of the filtered mixture was then taken and titrated with 0.10 M HCl.
The point of zero charges was determined using the method proposed by Faria et al. (2004). This method consisted of the preparation of a NaCl solution at a concentration of 0.01 M. Subsequently, 50 mL of the prepared solution was placed in a closed flask, and its pH level was adjusted by adding HCl (0.10 M) or NaOH (0. 10 M) as required. To this solution, 0.15 g of each treatment (P500, P600, and P700) was added to this solution and stirred continuously at room temperature for 48 h. The solutions were adjusted to pH levels of 2, 4, 6, 8, 10 and 12. The point of zero charge was at the point where the ΔpH vs initial pH curve crosses the ΔpH = 0 line. The specific surface was determined by the Brunauer-Emmett-Teller (BET) method, describe as a volumetric method of adsorbing nitrogen at cryogenic temperature to calculate surface area BET (SBET) (Lapham & Lapham, 2019). The volumes were calculated by Barrett-Joyner-Hallenda (BJH) method.
2.3. Batch Adsorption Experiments
The experiments were performed in flasks with phosphate solution; sodium azide (1 g/L) to inhibit microbial growth; and calcium chloride at a concentration of 0.01 M, to induce the removal of phosphate from solution by adsorbent (Contreras-López et al., 2021; Marshall et al., 2017). Previously, the experiment was tested without the presence of calcium ions in the solution; however, the treatments did not have adsorption capacity.
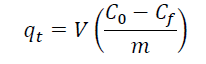
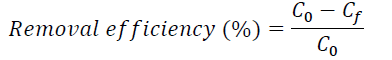
Three batch adsorption tests were performed in triplicate. The aqueous solution, which was prepared at a concentration of 0.30 mg/L of phosphate, was placed in 250 mL flasks and calibrated at pH levels of 4, 7 and 10. Subsequently, 1 g/L of the adsorbent material was added and left at rest with constant stirring at 150 rpm at room temperature (average 23 °C) for 168 h. After this time, the phosphate content in the solution was filtered and determined by the standard APHA method of stannous chloride (Baird et al., 2017). The amount of phosphate adsorbed on the adsorbent material was estimated by determining the phosphate adsorption capacity (q t). The q t and phosphate removal efficiency were determined with Equations (1) and (2), respectively.
 (1)
(1)
 (2)
(2)
Where q t (mg/g) represents the quantity of phosphate per adsorbent mass unit, C 0 and C f (mg/L) represent the initial concentration and the phosphate concentration after a time of t, respectively; V is solution volume (L); and m is adsorbent mass (g) (Cooney, 1998).
2.4. Adsorption kinetic models
Adsorption data were analyzed using pseudo first-order, pseudo second-order and intraparticle diffusion kinetic models. Equations (3), (4), and (5) were used for kinetic modeling.
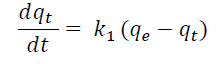
Pseudo first-order model assumes that an adsorp tion site is assigned to each ion on the adsorbent.
 (3)
(3)
Where q t (mmol/g) is the amount adsorbed during a time of t; q e (mmol/g) is the amount adsorbed at equilibrium, and k 1 (min-1) is the first-order rate constant (Lagergren, 1898).
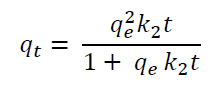
Pseudo-second order model, assumes that the sorption capacity is proportional to the number of active sites occupied in the sorbent.
 (4)
(4)
Where k 2 is the pseudo second-order rate constant (g /mg. min) and h=k 2 *q e 2 where h (mg/g min) represents the initial adsorption rate (Ho & McKay, 1999).
Intraparticle diffusion model, is characterized by the dependence between specific adsorption and the square root of time.
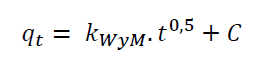 (5)
(5)
Where k WyM (mmol/g.min0.5) is the Intraparticle Diffusion rate constant (Weber & Morris, 1963).
2.5. Adsorption Isotherms
The experimental data for the uptake of phosphate ions were applied to both the Langmuir and Freundlich isotherm models. Equations (6), (7) and (8) were used for adsorption Isotherms models.
The Langmuir adsorption model proposes that monolayer adsorption occurs on the surface of the adsorbent at identical homogeneous sites.
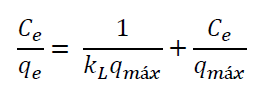 (6)
(6)
Where C e (mg/L) is the adsorbate concentration at equilibrium, q e (mg/g) is the quantity of adsorbate adsorbed at equilibrium, k L (L/mg) is the Langmuir adsorption constant, and q max is the maximum phosphate adsorption (Langmuir, 1918).
The separation factor (R L ) is a dimensionless constant that is represented as:
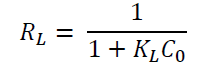 (7)
(7)
Where, C 0 refers to the initial concentration of the adsorbate in mg/L and K L is the Langmuir constant which is related to the adsorption capacity in mg/g. The separation factor indicates that the nature of the adsorption may be linear (R L =1), irreversible (R L =0), unfavorable (R L >1), or favorable (0 < R L <1) (Al-Ghouti & Da'ana, 2020).
Freundlich isotherm is an empirical model, which assumes non-uniform heat distribution on the surface of the solid (Freundlich & Heller, 1939). The equation is expressed as follows:
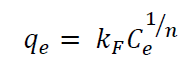 (8)
(8)
Where k F is the Freundlich constant and 1/n is the adsorbent heterogeneity; q e is the amount of phosphate adsorbed at equilibrium (mg/g); C e is the equilibrium concentration of phosphate.
2.6. Experimental design and statistical analysis
A factorial design 32 was adopted with two predefined factors and their respective levels according to the experimental matrix (Table 1).
For examining whether statistical differences between the effects of the factorial design exist, analysis of variance (ANOVA) was performed. The distribution used for the critical value was F- Fisher (once the effects are fixed) and the significance level (α) considered was 5%.
Table 1 Matrix of the factorial design 32 for analysis of phosphate removal
| Experiment | Pyrolysis temperature (°C) | solution pH |
| 1 | 500 | 4 |
| 2 | 500 | 7 |
| 3 | 500 | 10 |
| 4 | 600 | 4 |
| 5 | 600 | 7 |
| 6 | 600 | 10 |
| 7 | 700 | 4 |
| 8 | 700 | 7 |
| 9 | 700 | 10 |
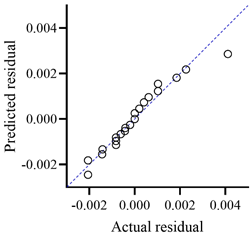
The normality of the errors can be verified by means of a normal probability plot of the residuals, and the closer the points obtained in the experiments are to the solid line, the greater the assumption of normality of the residuals. For the test of homogeneity of variance, Barlett's test was used.
Once the statistical assumptions were verified and when the ANOVA indicated a significant statistical difference between the group(s), Tukey's multiple comparison tests were used to compare the means of the treatments. Minitab 18 software (Pennsylvania State University, USA), whit p < 0.05 was used.
3. Results and discussion
3.1. Adsorbent Characteristics
No toxic solvents were used for adsorbent activation, nor was nitrogen gas used prior to carbonization. The process was simple, placing the powdered peels in porcelain crucibles with lids in an electric muffle furnace, similar to the studies of Bai et al. (2020) and Contreras-López et al. (2021). Furthermore, compared to other sorbents, the use of adsorbents such as biochars to recover phosphate by adsorption has received great attention due to the low cost, environmental friendliness, high porosity, versatility, and tunable properties of biochar. Ideally, P-loaded biochar should be used directly in the field as a P source for crops while improving soil properties (Abeysinghe et al., 2022).
The bulk density values of P500, P600 and P700 were 0.45, 0.49 and 0.53 g/cm3 respectively. In this regard, the bulk density of the three treatments was similar to that of granular activated carbon according to the standards of the American Water Works Association (AWWA, 2018) and ASTM International (2019).
When evaluating the yields for obtaining the P500, P600 and P700 adsorbents (14.93, 14.86 and 14.58% respectively), it is favorable for waste minimization, which is the priority in the Peruvian solid waste management laws. The quality characteristics of the adsorbents were determined through the parameters denoted in Table 2.
The analysis of variance (ANOVA) revealed that the three treatments did not present significant differences with respect to moisture (p > 0.05), however, they did present significant differences with respect to ash content and pH (p < 0.05). Furthermore, in Table 2, the moisture, ash and pH levels of P500, P600, P700 were within the criteria specified by the ASTM International standard (2017a,2018,2017b) for adsorbents such as activated carbon. P700 presented the higher pH than P600 or P500, because it was carbonized at a higher temperature (700 °C) and more amount of minerals was formed in the form of alkali carbonates (Yuan et al., 2012).
The increasing mineral concentration in the form of alkali carbonates is believed to be the major contributor to the increase in biochar pH levels (Marshall et al., 2017). Also, the alkaline pH of P500, P600 and P700 is typical of biocarbon derived from organic matter (Abeysinghe et al., 2022; Contreras-López et al., 2021).
All three treatments showed few basic active sites and a high content of acidic active sites. The determination of the active sites was important to detect the correct adsorption mechanism (Al-Ghouti & Da'ana, 2020).
Table 2 Characterization of the adsorbents
| Adsorbent | Moisture (%) | Ash (%) | pH | Acidic Active Sites (mmol/g) | Basic Active Sites (mmol/g) | Point of Zero Charge |
| P500 | 11.92±0.01a | 9.35±0.08c | 7.06 ± 0.05a | 42.79 ± 0,01a | 7.25 ± 0.25a | 9.91 |
| P600 | 12.49±0.01a | 8.79±0.07a | 8.16 ± 0.06b | 32.19 ± 0.02b | 6.34 ± 0.16b | 10.06 |
| P700 | 11.43±0.06a | 9.19±0.00b | 9.23 ± 0.03c | 36.50 ±0.01c | 8.74 ± 0.01c | 10.86 |
P500, P600 and P700, adsorbents produced at carbonization temperatures of 500, 600 and 700 ºC respectively. Means with equal letters do not differ statistically for p < 0.05.
Table 3 Surface characteristics parameters calculated using BET and BJH methods
| Adsorbent | Surface area BET (m² g-1) | Surface area of micropores (m² g-1) | Total volume (cm³ g-1) | BJH Adsorption average pore diameter (nm) | BJH Desorption average pore diameter (nm) |
| P500 | 13.89 | 4.99 | 0.27 | 7.73 | 20.98 |
| P600 | 14.33 | 5.17 | 0.27 | 7.31 | 15.49 |
| P700 | 16.62 | 6.27 | 0.20 | 4.21 | 8.83 |
Therefore, the bonds found in the active sites on the adsorbent surface caused a chemical type of phosphate adsorption.
Regarding the zero charge point results, the P500, P600 and P700 surfaces have zero electrical charges at pH 9.91, 10.06 and 10.86 respectively. The zero-charge point is a meaningful concept to find out the pH at which the surface of the material has an equal number of positive and negative charged functions (Uddin & Nasar, 2020). The zero-charge point was measured to study the suitability of adsorbents for phosphate removal. At solution pH below zero charge point, the biochar surface has a net positive charge, which is favorable for the removal of negatively charged ions such as phosphate. Conversely, if the solution pH is above zero charge point, the net charge of the biochar surface is negative, which would attract cations and repel anions (Abeysinghe et al., 2022). That is, at pH values above the zero-charge point, no electrostatic attraction could occur between the negatively charged adsorbent surface and the phosphate anion. The zero-charge point of P500, P600 and P700 was higher than that of other efficient materials for phosphate removal, such as commercial activated carbon, adsorbent derived from sanky husk (S02), biochar derived from elephant dung without modification (BC500) and modified with Magnesium (MgBC500) whose charge points were 8.82, 8.10, 7.10 and 8.70 respectively (Contreras-López et al., 2021; Valdés & Zaror, 2010, Abeysinghe et al., 2022).
A slightly alkaline zero charge point is typical of unmodified biochars. When pH < zero charge point (9.91, 10.06 and 10.86) (Table 2), the surface of P500, P600 and P700, respectively, can be protonated. This leads to a strong electrostatic attraction between the phosphate species present in solution and the relatively positively charged adsorbent surface. This would explain the adsorption at pH 7. But, when the pH is higher than the zero-charge point, the amount of adsorbed phosphate decreases due to the negative surface charges resulting from the release of hydroxyl groups during ligand exchange (Abeysinghe et al., 2022). However, contrary to the literature, P500, P600 and P700 released phosphates pH 4, despite apparently favorable conditions for phosphate adsorption. This may be explained by the fact that the solubility of compounds such as brushite increases under acidic conditions (Marshall et al., 2017), which would explain the release of phosphate at pH 4. The release of endogenous P from biochar to water can impede its performance Zhang et al., 2020).
The values of surface area, pore diameter and total volume, obtained through adsorption and desorption isotherms of nitrogen (BET/BJH) of the sorbents P500, P600 and P700, are expressed in Table 3.
In Table 3, the BET surface area of P700 is greater than that of P600 or P500. However, the removal potential of an adsorbate depends on the surface area of the solid, and its pore volume (de Leon et al., 2021). The BET surface area of P500, P600 and P700 was larger and the pore volume was of similar dimension to the adsorbents made from magnetic kaolin encapsulated in beads whose surface area and pore volume were 2.12 m2/g and 0.23 cm3/g respectively and the adsorbent derived from sanky husk, obtained by carbonization whose BET surface area and pore volume were 9.32 m2/g and 0.27 cm3/g, respectively (Contreras-López et al., 2021; Karthikeyan & Meenakshi, 2020). Therefore, the phosphate removal potential of P500, P600 and P700 depends on their surface structure, with higher surface area and porosity being desirable.
During pyrolysis, deformations are introduced into the network due to the removal of oxygen-containing functional groups (Boehm, 1994). In this regard, the higher pyrolysis temperature led to an increase in y from 13.89 m2/g for P500 to 16.62 m2/g for P700. The surface area of the micropores also increased, confirming that the higher the pyrolysis temperature, the more cracks formed. It was observed that the pore diameter calculated by the BJH method decreased from 7.73 nm at P500 to 4.21 nm at P700, indicating that nitrogen gas at 77 K is loaded into the pores. When comparing the ratio of micropore area to BET surface area (Smi/SBET), it was 35.92%, 36.07% and 37.72% at P500, P600 and P700 respectively.
3.2. Analysis of adsorption
The Figure 1 shows the results of phosphate adsorption at a concentration of 0.3 mg/L. The experiment revealed that adsorption was optimal when the pH of the solution was 10, and the plantain peel had been carbonized at temperatures of 500 and 700°C, with phosphate removal exceeding 90%. At pH 4 phosphate was released into solution. The release of phosphate into the aqueous medium may be due to the effect of pH on soluble phosphate. It has also been reported that biochars derived from soybean and bamboo biomass released P instead of adsorbing it (Zhang et al., 2020).
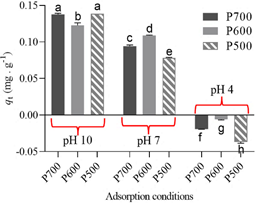
Figure 1 Groups of Tukey's test (Equal letters do not statistically differ among themselves at α of 5%).
According to the ANOVA, the effect of the factors and the interaction between the two factors was significant (p < 0.0001). That is, both pyrolysis temperature and solution pH and the interaction of the two influenced the difference between the effects. Tukey's test was used to identify the effects that differ in the interaction between the pH of the aqueous solution and the pyrolysis temperature in the process of obtaining the adsorbent. Previously, the normality of the experimental data was checked by means of a normal probability plot of the residuals, shown in Figure 2, in which the values approach the normal straight line. The values approach the normal line, so the normality of the data is fulfilled. For the test of homogeneity of variances (σ2), Bartlett's test was used. In which the data were considered homogeneous since the null hypothesis of equality of variances between means was accepted (H0 = σ1 2 = σ2 2 =…= σn 2) with a significance level of 0.128. Independence between observations was guaranteed during the experiments.
3.3. Kinetic Models
Adsorption kinetics parameters (Table 4) were determined for the three treatments at different pH levels. It is important to study the adsorption kinetics to determine the adsorption mechanism.

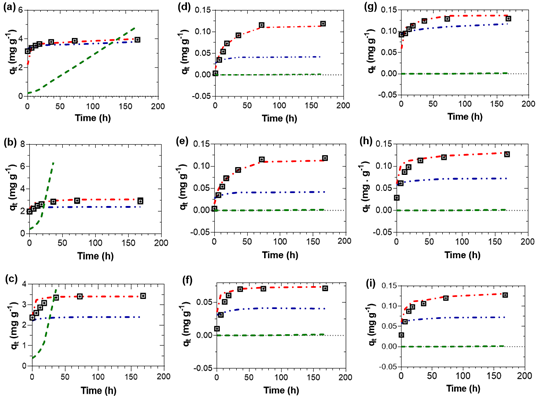
Figure 3 Adsorption rate curves of phosphate. ⊡ Experimental, ‒ ‒ Pseudo first-order, ‒ • Pseudo second-order, ‒ • Intraparticle diffusion. (a) P700 at pH 4; (b) P600 at pH 4; (c) P500 at pH 4; (d) P700 at pH 7; (e) P600 at pH 7; (f) P500 at pH 7; (g) P700 at pH 10; (h) P600 at pH 10 and (i) P500 at pH 10.
The pseudo second-order model has R 2 closer to the unit in the three pH conditions studied, which indicates a better data fit. The equilibrium amount of phosphate ion qe were 0.09, 0.09, 0.07 g/mg.min at pH 7 and 0.13, 0.11, 0.11 g/mg.min at pH 10 for treatments P700, P600, P500, respectively. The values of coefficient of determination were higher when the experiment was carried out at pH 7 than at pH 10.
A good fit to the pseudo second-order kinetic model indicated that phosphate adsorption was limited by the chemisorption, in which an adsorbate monolayer was formed on the adsorbent (Aljeboree et al., 2017; Wang & Guo, 2020). This model is related to the active sites and the model rate describes the adsorption step on the active sites. In this case, the pseudo second-order model best described the phosphate adsorption mechanism, which is explained by the low value of C 0 (Wang & Guo, 2020). The pseudo second-order model was the model that best described the adsorption mechanism. The other models did not fit properly, despite the results of R 2 for the Intraparticle Diffusion model. Therefore, it is important to plot the experimental and calculated results to better interpret the results.
The pseudo first-order model could occur under some of the following conditions: (1) the C 0 value is high, (2) the adsorption process is in the initial stage and (3) the adsorbent material has a few active sites (Wang & Guo, 2020). It is understood that these conditions are not met, it is clear that the initial phosphate concentration is low, and the active sites are reported in Table 2. These conditions explain the poor fit of the data to the pseudo first order model. In the case of the intraparticle diffusion model, this can represent the intraparticle diffusion process and has been used to describe the data of dye and metal adsorption kinetics on biosorbent and mineral (Wang & Guo, 2020), in this case, it does not fit the experimental data to describe phosphate adsorption.
The kinetic plots q t versus t at different phosphate ion concentrations are presented in Figure 3, which shows the curves of the Intraparticle Diffusion model were far from the experimental data, in comparison with the pseudo-second order model. According to experimental data, the adsorption rate of the studied treatments was high at the beginning of the adsorption process. After a time, their adsorption capacity remained practically constant (equilibrium point), which indicated the time at which the maximum adsorption capacity was reached. It was observed that the fitted curves of the pseudo second-order kinetic model were closer to the experimental data under the conditions studied.
3.4. Adsorption isotherms
The phosphate adsorption isotherm model parameters for the three treatments (P700, P600 and P500) are shown in Table 5.
The Langmuir adsorption model was adequately adjusted to the experimental data for phosphate adsorption in the treatments studied at pH 7 and 10, according to the determination coefficients (R 2 ) (Table 5). The highest R 2 values reveal the fit and applicability of the Langmuir isotherm for phosphate adsorption. K L is a constant denoted the energy of adsorption and affinity of the binding sites (Aljeboree et al., 2017). Here, the Langmuir isotherm fitted curves were closer to the experimental data under the conditions studied. This indicated that monolayer adsorption occurred in the surface of the solid at identical homogeneous sites (Langmuir, 1918). The Langmuir isotherm model assumes that adsorption is homogenous in which sorption activation energy and constant enthalpies are possessed by each molecule (Al-Ghouti & Da'ana, 2020). The different K L values between treatments at pH 7 and pH 10 refer to differences in binding strength and phosphate capacity with the adsorbent surface. In general, the K L values between P500, P600 and P700 increased when the solution pH was alkaline (pH 10). The parameter values show that P700, P600 and P500 are good adsorbents for phosphate adsorption from aqueous solution at pH 7 and pH 10, similar to the studies of Contreras-López et al. (2021). The better fit of the experimental data with the Langmuir model than the Freundlich model is also observed.
Furthermore, according to the separation factor R L , the nature of adsorption was favorable (0 < R L <1) when the experiments were tested at pH 7 and 10 for adsorbents P500, P600 and P700. However, it was unfavorable (R L >1) at pH 4 for P500, P600 and P700. The parameters of K F and 1/n increased with the in crease of pyrolysis temperature. In the Freundlich model, when 1/n is greater than zero (0< 1/n<1) the adsorption is favorable, when 1/n is greater than 1, the adsorption process is unfavorable, and it is irreversible when 1/n=1 (Al-Ghouti & Da'ana, 2020). The values of 1/n were greater than 1 (Table 5) for pH 7 and 10. This shows that phosphate adsorption was unfavorable or cannot be explained by the Freundlich model at experimental conditions.
The variation of phosphate adsorption capacity (q t) as a function of phosphate equilibrium concentra tion is denoted in Figure 4. Adsorption isotherms estimate the phosphate molecules distribution be tween the liquid and solid phases when the process reached an equilibrium state (Luo et al., 2016). An adsorption isotherm is characterized by certain constants; their values express the surface proper ties and affinity of the adsorbent (Dubey et al., 2014).
It has been reported that agro-industrial wastes de rived from banana and plantain are abundant, rich in cellulose, lignin and hemicellulose, materials with potential as adsorbents, highly efficient for the adsorption of various types of pollutants (Nnamdi Ekwueme et al., 2023). Table 6 shows different adsorbents that have used organic wastes.
From the perspective of sustainable development, fruit peel should not be a waste material, nor should it be discarded due to its abundance, low cost, reproducibility and environmental friendliness. Together with simple and economical synthesis processes, they make a beneficial reference in the recycling of biomass residues (Bai et al., 2020). Many sorption materials have been investigated for the removal of phosphate from water. For example, the use of Lanthanum-based magnetic sorbents to remove phosphate. However, not only are the processes that produce such composite materials complicated, but their removal capabilities are also limited (Ahmed & Lo, 2020). Recent studies propose the use of magnetic adsorbents derived from titanium gypsum, pyrolyzed in the presence of biomass wastes. However, these materials are not very supportive of waste utilization, since the biomass in these materials does not contribute to the adsorption of P (Yang et al., 2023).

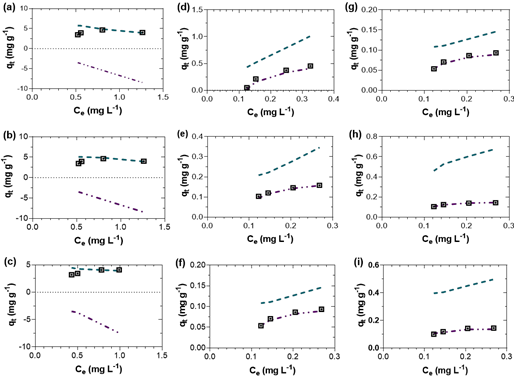
Figure 4 Adsorption isotherm models fitted to experimental adsorption of phosphate. ⊡ Experimental, ‒ • Langmuir, ‒ Freundlich. (a) P700 at pH 4; (b) P600 at pH 4; (c) P500 at pH 4; (d) P700 at pH 7; (e) P600 at pH 7; (f) P500 at pH 7; (g) P700 at pH 10; (h) P600 at pH 10 and (i) P500 at pH 10.
Few adsorbents have demonstrated phosphate ad sorption efficiency in river water. The Fe3O4/La(OH)3 nanocomposite, at a dose of 0.1 g/L, in the presence of different competing ions, removed 99.70 % of the phosphate during ten consecutive adsorption cycles. But these materials follow a multi-step synthesis process. First, the synthesis of magnetite through a modified coprecipitation route is required and then the synthesis of the Fe3O4/La(OH)3 nanocomposite by precipitation method. The impact of these materials on water bodies has not yet been tested. Once used, lanthanum-based materials are difficult to separate and recover from river water (Ahmed & Lo, 2020).
Many adsorbent manufacturing processes can be tedious, multi-step and environmentally unfriendly, using activating agents, and these chemicals would be disposed of in downstream processes, resulting in some environmental contamination. Emphasizing the need for a simple, environmentally friendly, and scalable route for the development of phosphate adsorbents from fruit peel without chemical activation reagents (Bai et al., 2020). The adsorbents mentioned in Table 6 were produced using simple technologies, by carbonization of materials (organic wastes) at temperatures between 500°C and 700°C, except for the adsorbents composed of hybrid clay and banana peel. Pyrolytic methods are simple, easy, and environmentally friendly. Although an unmodified biochar has a limited capacity to adsorb phosphate because of its limited functionalities, due to the few active sites and the negatively charged surface, it can be used to adsorb phosphate (Yang et al., 2023; Yin et al., 2018). Researchers highlight the use of biodegradable biochars that are waste-based carbon sources from an environmental and economic standpoint (Rout et al., 2021). In addition, the modification process may limit its potential for widespread application in phosphate recovery (Marshall et al., 2017). A biochar with modifications generally contains metals or pollutants, along with the biochar feedstock, which may be difficult to remove. Among the metals used in the modification of adsorbents, the use of aluminum is reported (Yin et al., 2018), magnesium, iron (Abeysinghe et al., 2022) among others.
Phosphate adsorption by P500, P600 and P700, was performed in the presence of calcium ions, similar to the work of Marshall et al. (2017) and Contreras-López et al. (2021). This technique is convenient because it combines the benefits of adsorption and chemical precipitation techniques and does not require restrictive operating conditions such as high pH level, adsorbent modifications, or specific raw material requirements (Marshall et al., 2017).
Table 6 Comparison of P500, P600 and P700 with other adsorbents made from organic wastes
| Adsorbent | Adsorption conditions | Phosphate removal efficiency (%) | q max | Reference | ||
| pH | P concentration (mg/L) | Dosaje | (mg g-1) | |||
| (g/L) | ||||||
| 700 °C Biochar derived from grapevine cane | 6.5 | 20 | 2 | Not mentioned | 37.50 | (Marshall et al., 2017) |
| Adsorbent derived from sanky peel | 6.5 | 10 | 2 | 94.20 | 14.44 | (Contreras-López et al., 2021) |
| Elephant dung biochar modified with iron | 4.5 | 10 | 2.5 | Not mentioned | 0.74 | (Abeysinghe et al., 2022) |
| Adsorbent composed of hybrid clay and banana peel | 5.5 | 20 | 0.1 | Not mentioned | 61.53 | (Unuabonah et al., 2017) |
| Amino-functionalized adsorbent composed of hybrid clay and banana peel | 5.5 | 20 | 0.1 | Not mentioned | 63.28 | (Unuabonah et al., 2017) |
| P700 | 10 | 0.3 | 1 | 92.12 | 0.14 | This work |
| P600 | 10 | 0.3 | 1 | 91.69 | 0.12 | |
| P500 | 10 | 0.3 | 1 | 81.68 | 0.14 | |
Phosphate adsorption by P500, P600 and P700 at concentrations similar to those of water bodies at risk of eutrophication (0.30 mg/L) had adsorption capacities between 0.14 and 0.12 mg/g and phosphate removal percentages above 80%. In Table 6, we observed that the adsorbent materials showed efficacy in phosphate adsorption at initial concentrations of 20 mg/L (Marshall et al., 2017; Unuabonah et al., 2017) and 10 mg/L (Abeysinghe et al., 2022; Contreras-López et al., 2021).
This study lays the foundation for future research on the use of this type of adsorbent in water treatment to provide access to clean water for rural populations. Also, pyrolyzed banana peel could be used to recover phosphorus from water bodies and evaluate the recycling of the anthropogenic phosphorus cycle.
4. Conclusions
This is the first study to examine the use of plantain peel-derived adsorbents obtained by a simple pyrolysis methodology, without the use of nitrogen gas, for the recovery of phosphates at concentrations similar to water bodies at risk of eutrophication. The quality parameters of the plantain peel-derived adsorbent were within the criteria specified by the ASTM International Standard for activated carbon. Adsorption was a process dependent on the pyrolysis temperature, pH of the solution and the interaction of both, requiring the presence of calcium ions in the solution. Tukey's test showed that pH 10 and 7 of the solution significantly and positively influenced phosphate removal. However, instead of adsorbing, P500, P600 and P700 released phosphate at pH 4. Equilibrium was reached after 168 h, and the kinetic model that showed the best fit was the pseudo-second-order model. The equilibrium data were best fit to the Langmuir isotherm. Plantain peel proved to be an effective and affordable source for the removal of phosphate ions from low-concentration aqueous solutions (0.30 mg P L-1), presenting satisfactory phosphate adsorption of more than 92%, with a phosphate removal capacity of 0.14 mg P g-1 at pH 10 with the adsorbent prepared at 700 °C pyrolysis temperature. It could be tested in the future as an adsorbent in river water samples with phosphate contamination.

