


 Inglés (pdf)
 Articulo en XML
 Referencias del artículo
 Enviar articulo por email
 Citado por SciELO
  Similares en
SciELO
Similares en
SciELO 
 Permalink
1. Introduction
Agricultural activities are the main contributors to the greenhouse gases emissions (GHG) that cause global warming, but they can also contribute to its mitigation through the capture of atmospheric carbon, in the form of organic carbon in the soil (Laborde et al., 2021). Total GHG emissions varies by continent, and the global GHG emissions from agriculture is a significant source of GHG, particularly in the form of methane and nitrous oxide (Rehman et al., 2020). Europe is responsible for approximately 11% of Asia for approximately 44%, Africa for 15%, Australia and Oceania for 4%, and North and South America for 9% and 17%, respectively (Tubiello et al., 2014; Mrówczyńska-Kamińska, et al., 2021). However, different factors are affecting on increasing GHG (Mrówczyńska-Kamińska et al., 2021). There are many factors that can influence GHG from agricultural soil, such as climate, soil type, and management practices (Shakoor et al., 2021). Therefore, emissions levels can vary significantly even within the same country or region like Latin America.
Latin America is the second region that emits more gases worldwide, due to countries like Ecuador that do not apply good agricultural practice, which leads to soil degradation (Padilla & Haro, 2021). GHG in Ecuador, came mostly from agricultural activities (about 70%), with waste management accounting for 11.5%, land-use change and forestry for 10.9%, and the energy sector for 7.4% (Cornejo & Wilkie, 2010). Within the agricultural sector, livestock and rice cultivation are the largest sources of emissions. Livestock is responsible for approximately 29% of the country's total emissions, largely due to enteric fermentation (the digestive process of ruminant animals, which produces methane) and manure management (Tubiello et al., 2013), without taking into account the quality of the soil with organic carbon like an index (Shakoor et al., 2021).
Soil organic carbon (SOC) plays an important role in determining the quality and health of the soil, relating to crop yield and the availability of nutrients such as nitrogen (Reyna-Bowen et al., 2020; Nahdia et al., 2021). Agricultural practices, such as tillage, crop rotations, and the use of fertilizers and pesticides, can have a significant impact on SOC levels in the soil (Gómez et al., 2022). Intensive tillage and monoculture can deplete SOC levels, while conservation tillage and diverse crop rotations can help maintain or increase SOC level and the effect on its physical properties, which are reflected in its structure and porosity and also depend on local environmental conditions, as well as its management (Abbas et al., 2020; Gómez et al., 2022). On the other hand, vegetation root shape also has a strong relationship with organic carbon sequestration (Xu et al., 2024). In Ecuador, SOC capture studies have been carried out in Manabí, specifically in the valley of the Carrizal river, it was determined that the highest concentration of SOC is found in the cultivation of grasses in clay loam soil, with a depth of 40 cm. and with a tendency to decrease depending on the depth (Reyna-Bowen et al., 2018). Nunes et al., (2020) confirmed that surface-layer SOC is sensitive to changes induced by agricultural practices such as: (1) reducing intensity and depth of tillage; (2) increasing cropping system diversity; (3) applying organic amendments; (4) maintaining crop residues on the soil surface; (5) converting row crops to perennial systems.
Manabí contributes 12.34% to the agricultural sector of Ecuador, the main crops that are developed are: coffee, cocoa, banana, corn and rice cultivation (INEC, 2021). In the last 10 years, the area of Dragon Fruit cultivation, also known as pitahaya, in this province has increased (Nunes et al., 2020). In Ecuador, pitahaya is cultivated primarily in the coastal region, where it has become an important crop, also had a positive impact on the local economy, creating job opportunities for farmers and contributing to the region's agricultural sector (Diéguez-Santana et al., 2022). According to Castro et al. (2020), pitahaya in Ecuador is rich in antioxidants and other phytochemicals that have been linked to various health benefits, such as the reduced risk of chronic diseases. The fruit has a growing demand in international markets, and Ecuador has become one of the main exporters of pitahaya to countries such as the United States and China (Diéguez-Santana et al., 2022).
Vera-Macías et al. (2019) analyzed the cultivation of pitahaya in Manabí and found that it is well adapted to the region's climate and soil conditions. According to Vera-Macías et al. (2019), pitahaya requires relatively low amounts of water and fertilizers, making it a suitable crop for areas with limited resources. Pitahaya is resistant to pests and diseases, reducing the need for harmful pesticides (Punitha, 2022). However, it is estimated that this crop causes an affectation in the soil due to the management of weeds and phytosanitary that leads to having streets (row) without coverage which would cause erosion in the medium and long term that could negatively affect the soil (Bordoh et al., 2020). Wakchaure et al. (2023) concluded that with proper management with good agricultural practices in the cultivation of pitahaya, the plantation becomes a profitable source for poor farmers. Likeliness, the utilization of rice husks as a new alternative for soil cover has proven to be effective in reducing the need for chemical herbicides for weed control (Abigail et al., 2016). In the case of rice husk residue, several countries have been preparing different products derived from this residue for years, the main one being Biochar, but having as an alternative the cleaning of places such as poultry, livestock and pig farms (Pode, 2016).
Research on this specific topic is limited, and more studies are needed to assess the impact of pitahaya cultivation on SOC levels in different regions. Likeliness, there has been no quantification of the impact of pitahaya cultivation on SOC quality indicators. The scarce information available on SOC in Manabí - Ecuador region on pitahaya cultivation leads to formulate the following research question: How does the alternative management crop and difference in species of the pitahaya contribute to the sequestration of organic carbon in the soil in Manabí Region?
2. Methodology
2.1 Area description
The work was carried out in the Carrizal-Chone System project (SCCH) area of interest, located in the central part of the Province of Manabí near the Chone and Tosagua counties side in Ecuador. The study area is situated at 0°51”46” S, 80°80’61” W, and between 19 and 80 m.a.s.l. (Figure 1).
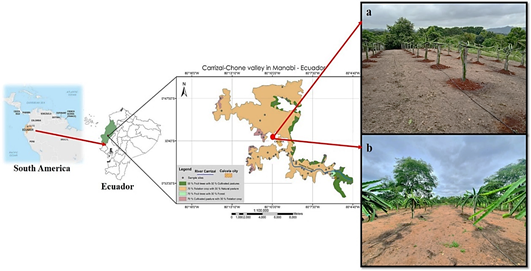
Figure 1 The study area in CIIDEA at the ESPAM MFL. Rice husks were used as bedding for raising and cleaning the pigs. This residual was collected for use as weeds, grass and erosion control at the foot of the Yellow Dragon Fruit (Pitahaya) with 4 years old (a) and Red pitahaya with 2 years old (b).
The plots were located at the Polytechnic Campus of City of Research, Innovation and Agricultural Development (CIIDEA) of ESPAM MFL, in the area where soil samples were taken in the two varieties of Red Pitahaya (Hylocereus undatus) and Yellow Pitahaya (Hylocereus megalanthus). The average annual temperature of the area is 25.6 °C, the average annual potential evapotranspiration is 1365.2 mm, and the average annual precipitation is 838.7 mm, with a dry period occurring from June to December, and a rainy period from January to May.
2.2 Pitahaya management and soil description
The pitahaya crop is divided into two plots, one for yellow pitahaya with 4 years old and the other for red pitahaya with 2 years old with approximately 1800 m2 each plot. The plants are spaced 3 meters apart and 4 meters between rows. They are supported by a two-meter concrete stake that is buried 70 cm deep, leaving 1.30 meters of effective length above the ground. Two plants are trained onto each stake and are interwoven to form a hoop arch at the top of the stake see Figure 1a. Weed control in both plots was carried out chemically, mechanically and manually. Scythes were used for mechanical control, and the area near the plant was cleaned manually every 15 days. As an alternative to all these controls, a Rice husks were used. Rice husks were used. This rice husk was previously used as a pro tective layer for the floor where the pigs are raised. There is no set time for the use of padding on the floor of the pigs, this will depend on the number of pigs that exist at that time of rearing. After one use of mulch for the concrete floor of the pigs, the layer of rice husk is collected to be renewed by another new layer and the used layer of rice is used to keep the surface of the soil of the pitahaya plantations covered. This alternative also acts as a natural mulch, preventing weed growth and helping to conserve moisture. The solid fertilization was ap plied on the soil directly. 45 days after planting, a prilled fertilizer with a content of 12% nitrogen, 11% phosphorus, 18% potassium and micronutrients such as iron, magnesium, manganese, sulphur, boron and zinc, were used. Fertilization was accompanied using a biostimulant from the sugar industry, which was applied every eight days until the plantation entered the fruiting stage, after which foliar appli cations were made every eight days.
According to the Soil Survey Staff (2012) soil classification, the soil texture with 16% area, 28% silt and 56% clay is sandy loam. With this same soil texture (Table 1), the two pitahaya species were planted. The time of formation of the soils is relatively young, since they are formed by alluvial and alluvialdeluvial materials from the Quaternary. Even in these soils there is sedimentation of texturally differentiated materials (loamy, sandy or clayey loam texture). In these conditions the main soils formed is Fluvisols (Fluvents) according to Vera et al. (2019).
2.3 Soil sampling and laboratory analysis
Soil sampling was carried out between July and August 2022 in different soil-management types and in different species of pitahaya cultivation. Soil samples were selected in a design which allowed to determine if the influence of the management and presence of plant has a direct effect on the soil and in turn a comparison between the red and yellow species.

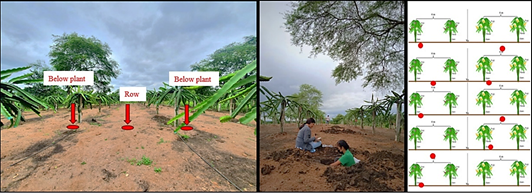
Figure 2 Samples were taken below plant and row at 4 different depth intervals (0-5 cm, 5-10 cm, 10-20 cm and 20-30 cm) at each sampling point of the Yellow Dragon Fruit (Pitahaya) with 4 years old and Red Pitahaya with 2 years old.
In each area red and yellow pitahaya zone below and outside the plant (row), 10 sampling points were selected outside the plant (pitahaya) projection. Additionally, the nearest plant to each point was identified and a new sampling point under the plant was selected, but at a distance from the post that located this point within the ploughed area in both spices. Therefore, a total of 20 sampling points per area were sampled. Samples were taken at 4 different depth intervals (0 - 5 cm, 5 - 10 cm, 10 - 20 cm and 20 - 30 cm) at each sampling point, having previously removed the grass and mulch surface. Soil samples were taken combining a manual soil sampler. Overall, a total of 360 soil samples were taken (area × sampling points × depth) because some soil samples were lost in the transportation (Figure 2).
Undisturbed soil samples were taken with a hand soil sampler to determine bulk density (BD). The samples were taken at the five pits, distinguishing between pit zone below and outside the plant (row) and at four depths (0 - 10 cm, 10 - 20 cm and 20 - 30 cm) with three repetitions, in totalling 45 samples. The samples were oven-dried at 105 °C for 72 h to a constant mass. The bulk density of the soil was calculated by dividing the dry mass of soil by the volume of the bulk density sampler (98.2 cm3), according to Hao at al. (2008). At the same time subsamples until constant weight to obtain soil sample moisture, while the rest of the soil in each sample was air dried.
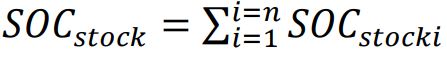
The samples were passed through a 2 mm sieve and homogenized, and stoniness was determined as % in mass. The samples were dried to a constant mass at 40 °C for 72 h. SOC concentration was determined in accordance with Walkley (1947), Equation (1). The stock of soil organic carbon for each soil-depth interval (SOC) and for the whole soil profile were calculated in accordance with IPCC, Equation (2):
 ()1
()1
 ()2
()2
where: SOCstock is the total soil organic carbon in a given layer (t ha-1). SOCi is the organic carbon concentration (g g-1), BDi is the bulk density of the soil layer under the tree canopy (t m-3), d is the thickness of the depth interval (m), d is the fraction coarse particles within the layer (0 - 1), and n is the number of soil layers. Thus, Eq. (2) gives the total soil organic carbon stock in the whole soil profile, discounting the effect of stoniness.
Carbon Distribution Index (CDI) was provided and calculated from the ratio of the carbon accumulated in the first section and the amount of organic carbon accumulated in the whole soil profile up to 30 cm according to the formula:
 ()3
()3
2.3 Statistical data analysis
Differences between average values of SOC and SOCstock in the two pitahaya plantation by depth and location were evaluated using a parametric ANOVA test. A PCA analysis and general linear model (GLM) was used to investigate the effect of the soil depth, location and species on soil characteristics such as humidity and carbon stock. All the statistical analyses were performed with InfoSTAT 2018.
3. Results and discussion
3.1 Moisture and bulk density of study soils
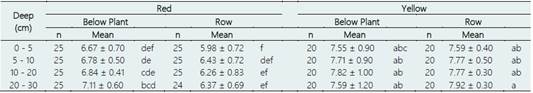
The humidity is always higher under the yellow pitahaya with > 7% humidity compared to the red pitahaya with an average of 6.6% humidity, being significantly different in the whole soil profile (Table 2). Rice husk technique maintains soil moisture at a constant level of over 6% throughout the soil profile, with noticeable variations between the top layer (0 - 5 cm) and the bottom layer (20 - 30 cm).
The results indicate that moisture levels remained consistent under the plant as well as in the rows. These findings suggest that the use of rice husks for soil cover can be an effective alternative to reduce the need for herbicides and maintain soil moisture levels. According to studies carried out with mulches, the direct effect it has on the soil as a cover is a reduction of 25% to 50% of evapotranspiration, and thus helps retain soil moisture (Gu et al., 2017). Studies with polyethylene mulch cover increased the water content in clay soils to 4.7% and in loamy soils to 3.1% in the 5 cm of soil (Ramakrishna et al., 2006), compared to the rice husk mulch of the present study, in clay-loam soils were higher than 6.6%. Considering the climatic conditions of Ecuador, because evapotranspiration is high throughout the year, leaving rice husk mulch as a very good alternative for moisture retention throughout the soil profile (Teame et al., 2017).
Bulk density behaved similarly below plant with no significant differences between 1.13 and 1.17 g/cm-3. Likewise, there are no significant differences in the rows compared between the two crops with an average of 1.3 g/cm-3. The only significant difference that exists is between rows vs. below plant. This result clearly indicates that the plant has a potential to improve soil profile texture as expected (Table 3). The effect of the overall root system of a plant above 30 cm depth can significantly increase the stability of topsoil aggregates (0 - 15 cm) and the porosity of compacted soil at 30 cm depth, reducing bulk density compared to soils without vegetation (Csilla et al., 2021). Root systems are of major importance for the supply of detritus and for the secretions of the roots and the substances supplied with them increasing Interactions between roots, mycorrhizae and earthworms and their effects on soil structuring processes, soil concentration and plant biomass (Milleret et al., 2009). Likewise, results obtained by Błońska et al. (2017), demonstrated the strong relationship of enzymatic activity with the quantity and quality of soil physical and chemical (organic matter) according to its management.
3.2 SOC comparison in Red and Yellow Pitahaya Plantations
We began by conducting a global analysis of the database to examine the behavior of soil carbon dynamics at various depths. Figure 3 reveals significant differences across all soil profile sections as expected. The 0 - 5 cm section exhibiting the highest concentration of organic carbon at 2.01%, 1.77% and 1.97% below plant in red, yellow and row in yellow plantation respectively. In comparison with 1.26% in row red plantation they are significance difference. These values in the coastal zone of Ecuador with a similar soil, but with a different permanent crop management, found similar values 1.85% in the 30 cm of the soil (Barrezueta et al., 2017). This behavior in each horizontal section is the same until the last section 20 - 30 cm. The red pitahaya row is different from the other samples (Figure 3).
Table 2 Comparison of humidity (%) at different depths, location and species
The letter indicates significant differences.
Table 3 Comparison of Bulk Density (BD) at different depths, location and species

BD (g/cm-3); Standard Deviation (±); Mean with a common letter are not significantly different (p > 0.05); The letter indicates significant differences.
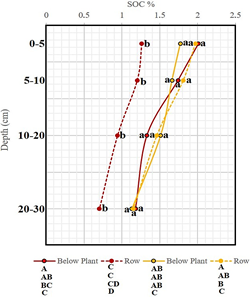
Figure 3 SOC concentration (%) between red, yellow, below plant and row pitahaya species at different depths. Mean with a common letter are not significantly different (p > 0,.05); Capital letter is vertical comparison by localization and small letter is horizontal comparison by section.
On the other hand, if a vertical perspective analysis is made in each of the sampling points, we observe the following. Below plant in yellow plantation, SOC concentration is maintained without differences in the first three sections 1.77%, 1.66% and 1.51% respectively, compared to the row and below plant in red plantation, which are equal up to the second section (5 - 10 cm). Likewise, row in red plantation maintains low concentrations compared to the other locations throughout the soil profile (Figure 3). This behavior could be affected by the root system of pitahaya plantation. This root system is characterized by having a fibrous root system, usually has more than two thick roots from which the secondary roots are detached, they are usually dense, this varies according to the material in which the plant is planted. The roots system usually develops between the soil and the organic layer, can extend up to 4 meters horizontally and can reach a depth of up to 30 cm (Barrangou et al., 2015).
All organic carbon found in soil is mainly of plant origin. The two main sources of soil carbon are (1) the accumulation of soil organic matter due to humification after plant death and (2) root exudates and other organic substances during plant growth, as well as the shedding of root hairs and fine roots by elongation (Kumar et al., 2006). The plantations are relatively young in this study, between 2 and 4 years old and have not completed the development of the entire root system. Therefore, it is understood that the differences found in certain sections are a direct effect of the age of the plant in the present studio.
On the other hand, the comparison of organic carbon concentration between the sections, it must be considered that the first two sections are only 5 cm compared to the last two which are 10 cm. These first two sections of the profile (0-5 and 5-10 cm) are a fundamental and sensitive part for organic carbon sequestration. Having a capacity to capture organic carbon equal or better than after the 10 cm depth according with (Kumar et al., 2006). This is also why invasive species develop very quickly in the topsoil (Peltzer et al., 2010).
The global scale analysis revealed significant variations not only in the quantity of organic carbon (OC) but also in the specific characteristics of its exponential relationship with depth, which are strongly influenced by vegetation type (Jackson et al., 2000). These variations can be attributed primarily to the vertical distribution of roots and, to a lesser extent, to climate and clay content. The decline in OC content with depth is most pronounced in shrublands, followed by grasslands, and least prominent in forests (Arrouays & Pelissier, 1994). However, in this study above 30 cm the influence of all these factors has a more sensitive impact on increasing or decreasing the capacity to sequester organic carbon in the different soil sections. However, in this study, above 30 cm, the influence of all these factors has a more sensitive impact on increasing or decreasing the capacity to sequester organic carbon in the different soil sections (Ilampooranan et al., 2022). For example, work carried out by Reyna-Bowen et al. (2018), from 0 to 150 cm depth, with the same soil type and climate. The concentrations in the first horizon 0 - 40 cm (average) were 0.35% - 0.89% in areas of rotation crops and between 1,00% to max 1,80% in permanent crops and areas in abandoned. These concentration values are similar those found in the present study.
3.3 SOCstock
The analysis of carbon accumulation showed a variability in each of the locations from 0 - 30 cm. Without significant differences with 50.34, 49.40 and 47.95 (t ha-1) below yellow plant, row and below red plant respectively. In the whole soil profile with 38,10 t ha-1 the row of the red plant is significantly different (Figure 4).
With an analysis in each of the sections, it is observed that the lowest ranges of carbon accumulation continue to be in the row of the red plantation. On the contrary, it is observed in the most localities of the study that from section 10 - 20 cm there is an increase in accumulation. This increase is due to the calculation by the thickness that in this case increased from 5 to 10 (cm) although without significant differences in the last section the accumulation decreases. Although the first two sections are only 5 cm thick, they have a large capacity to store organic carbon. This dynamic can be deduced that the plant is in full root development for its horizontal extension without yet reaching 30 cm but having a positive effect on the accumulation of organic carbon.
In a study conducted by Hernández et al. (2015), they were able to corroborate in the different soil profiles that between 0 - 20 cm of organic carbon accumulates up to 60 t/ha. These differences between the first 20 centimetres are since the soil samples in this work were taken in different soil management and where the vegetation is more abundant such as pasture or permanent crops as a greater vegetation cover. This marks a difference between the tons accumulated in pitahaya with other soil managements.
If we compare the values obtained with other more intensive management such as soybean crops, in a 3-year rotation at 30 cm depth, values of 58 to 55 t ha-1 by Boddey et al. (2010). There seems to be a small difference in carbon accumulation. However, the management of these two crops would have a different impact on the soil in the long term, with soybean and its conventional management not being as beneficial (Bronick & Lal, 2005).
Climate is a factor that must be considered because it can affect CO accumulation in the soil through biotic processes related to vegetation productivity and organic matter decomposition (Deng et al., 2016). In this case, the plantation is rel atively young, and its activity could be closely related to these biotic processes combined with the con servation of humidity with the rice mulch and the site temperature, which varies between 24 and 28 °C, favoring the decomposition of organic matter throughout the year (Hernández et al., 2013).
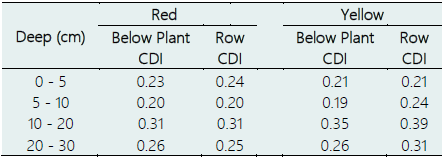
The results obtained from CDI showed that the carbon distribution is almost similar throughout the profile. However, the 10-20 cm section of the profile showed an increase > 0.30, reaching a maximum value of 0.39 located in the row of the yellow plant (Table 4). On the other hand, the values with the lowest indicator were found in the 5-10 cm section except for the sample in the row of the yellow plant, which is still higher than the others. A study conducted by Błońska & Lasota (2017), where CDI, indicate that the lowest CDI values are found in the soils of the humid variant where the CDI indicator is 0.299. The soils of the swamp variant are characterized by higher values of the CDI index, 0.329. Although they are similar values, the environmental factors are totally different in both cases. Due to the relatively young age of the plantations and the limited duration of the treatments performed, it is not realistic to expect a significant effect on deeper levels at this stage. The plantations require more time to mature, and the treatments need to be carried out for a longer period to yield noticeable results at deeper levels.
Table 4 CDI in each section between red, yellow species, below plant and row
Carbon Distribution Index (CDI).
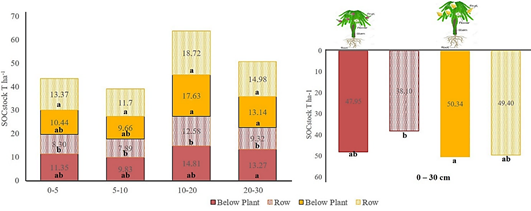
Figure 4 Comparison of SOCstock accumulated (t ha-1) in each section and comparison of SOC stock accumulated total 0-30 cm (t ha-1) between red, yellow species, below plant and row. The letter indicates significant differences.
Patience and continued investment in the appropriate treatments and care will be crucial in nurturing the plantations to reach their full potential and achieve meaningful impact at deeper levels and the roots are able to extend more horizontally, benefiting the soil in the different sections and locations.
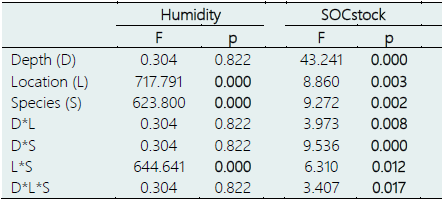
The conducted GLM analysis confirms the importance of soil depth, location and species in shaping the properties of the tested soils. In the case of humidity, location and species had a statistically significant impact on its values. There was no significant effect of soil depth. In addition, the GLM analysis indicated an interactive effect of location and species on humidity (Table 5). In the case of carbon accumulation, all studied factors had a significant effect, i.e., depth, location and species. In addition, the GLM analysis indicated an interactive effect of depth, location and species on carbon stock.
Reyna-Bowen et al. (2020) was able to compare the effect of tree presence and age at different depths of the soil profile, revealing that plant age plays an important role for carbon sequestration at depth being significantly higher from depths of 10 - 20 and 20 - 40 cm with 35 and 55 t ha-1 below the tree, respectively. Likewise, when there are several factors included for the study of soil organic carbon accumulation, the interactions that may exist are too high and variable to define exactly what is happening at that moment (Reyna-Bowen et al., 2019).
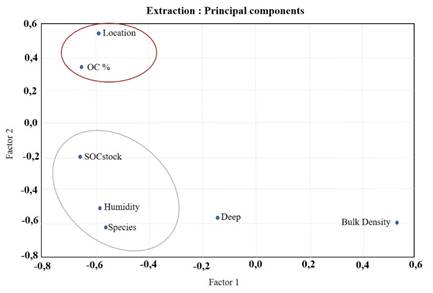
A principal component analysis was performed to see which factors and variables are grouped together. The analysis showed that there are two groups. The first group is the location and concentration of organic carbon. This group shows that depending on where the soil sample is taken (under the plant and rows) the concentration of organic carbon will have a different concentration. The second group SOCstock, Moisture and plant species, indicates that the species, in this case the yellow pitahaya, because it is older in age, plays an important role in conserving moisture and organic carbon accumulation throughout the soil profile. Having as unique variables the depth and bulk density that do not have a fundamental weight in this study (Figure 5).
4. Conclusions
Effective crop management is crucial for controlling weeds and preventing soil erosion. Our research has revealed that managing rice husks can serve as a new alternative for weed control, leading to a significant increase in soil moisture retention of over 6% throughout the entire soil profile (0 - 30 cm). Likewise, the age of the plantation or crop plays another important role in soil organic carbon sequestration. Despite having the same management, soil type, climate and irrigation, the significant effect in this study shows that the different age of the plantations (2 years) marks a significant difference between the two plantations. The roots of the older plantation extend their roots more horizontally and achieve more organic carbon sequestration in the rows compared to the younger plantation. On the contrary, the species variety between red and yellow pitahaya is not a differential factor for organic carbon sequestration. Likewise, new trials will be carried out based on the results of this work, such as the comparison between different ages with the same species. Comparisons between live and dead cover between pitahaya rows, the effect of topography and soil degradation with conventional pitahaya management, among others.

