


 Inglês (pdf)
 Artigo em XML
 Referências do artigo
 Enviar este artigo por email
 Citado por SciELO
  Similares em
SciELO
Similares em
SciELO 
 Permalink
1. Introduction
The interest in substances of natural origin to provide functional properties to processed foods has aroused great interested among researchers in relation to substances already known for many years and recently discovered. This interest also applies to bee products due to their extensive nutritional, functional, and bioactive properties. These products have been known and used for thousands of years, but only recently they have become the subject of scientific research.
Bee products such as honey, royal jelly, propolis, beeswax, or bee pollen stand out for their bioactive compounds associated with beneficial health properties (Ares et al., 2009, El-Guendouz et al, 2020, Morais et al., 2021, Giampieri et al., 2018). Bee pollen, in particular, is gaining attention as a functional food for human consumption due to its high content of compounds with health-promoting effects, such as essential amino acids, antioxidants, vitamins, and lipids (Gabriele et al., 2015; Sattler et al., 2015; Conte et al., 2018; Ares et al., 2018).
Using bee pollen as a functional ingredient is an efficient alternative to enrich different food products from a nutritional perspective since its bioactive compounds have been shown to improve consumer health (Krystyjan et al., 2015, Karabagias et al., 2018, Conte et al., 2020). However, adding bee pollen to food is a complex task, representing tech nological and sensory challenges. In a recent study conducted by Sokmen et al. (2022), bee pollen was added to reduced-fat cookies. The results showed that the addition of pollen maintained the technological properties and improved the total phenolic compounds content of the cookies, increasing their antioxidant capacity. However, the overall acceptance was rated as intermediate, with values of five on a nine-point hedonic scale. These findings clearly demonstrate that the sensory quality of products containing bee pollen can still be improved. However, understanding sensory acceptance and, in general, the willingness to consume a product goes beyond its sensory quality, as these properties are only evaluated at the time of testing. Before that, different non-sensory factors (price, innovation, and processing technology) modulate attitudes and perceptions towards foods (Rojas & Saldaña, 2021).
Food consumption is a fundamental practice for human subsistence and is driven by several social, cultural, political, and industrial breakthroughs and practices. Innovation is generally considered positive in this context, but mixed opinions emerge regarding food innovation. In this context, an obstacle is food neophobia, a behavior characterized by the rejection or refusal of unfamiliar foods, which has been defined as a personal reluctance to accept and/or enjoy new or unfamiliar foods (Henriques et al., 2009). The feeling of mistrust or suspicion about eating something new is an essential mechanism for avoiding harmful substances, although the tendency towards neophobia varies among consumers (Pliner & Hobden, 1992).
Assessing the predisposition of individual consumers and, more generally, the inclination of different societies to accept novel foods is a crucial step toward developing successful food innovation strategies (Rabadán & Bernabéu (2021). It is known that information about the positive effects of food on health is highly influential in consumer expectations, demonstrating a relationship between consumer health, taste attitudes, and acceptance of new food formulations (Proserpio et al., 2020).
So far, little is known about consumers' perception of the presence of bee pollen in food and its relationship to health claims or so-called functional foods. In this sense, the present study aimed to evaluate the attitudes and perceptions of consumers regarding bee pollen as a functional ingredient in bread.
2. Methodology
The present study was approved by the Human Ethics Committee of the Federal University of São Carlos (UFSCar) under protocol number 23208819.2.0000.5504. Before responding, consumers received details of the study and, if they agreed, they signed a free and informed consent form.
2.1 Participants
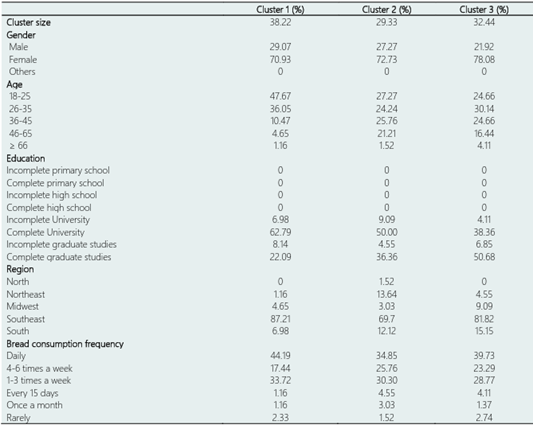
Two hundred twenty-five (225) respondents over 18 years were recruited via email and social media and voluntarily responded to the survey available in Brazilian Portuguese in 2020. The respondents were geographically diverse, from the north, northeast, midwest, southeast, and south, representing the economically active population that contributes the most to Brazil's gross national product. The participants were clustered according to their attitude responses using Euclidean distance and Ward criteria. Segmenting consumers based on their attitudes will allow us to identify consumer clusters with different eating patterns.
2.2 Procedure
Participants were invited to answer the survey composed of the following parts: 1) socio-demographic profile (age, gender, educational level, region) and bread consumption of the participants (Tables 1 and 2) Consumer attitudes toward "general health," "light products," "natural products," "salted products," "food as a reward," "pleasure" and "food neo phobia", as well as 3) consumer preferences for vis ual stimuli containing a bread image along with bee pollen claims. Compusense cloud software was used to implement this survey.
2.3 Consumers' attitudes
Several aspects of consumers' attitudes concerning food consumption were explored through an attitude questionnaire, including attitudes toward general health, natural products, and light products. To balance the scales, they were also asked about their attitudes towards food pleasure, food as a reward, and salted products (the subsequent section of the survey assessed salty bakery products). Moreover, statements related to food neophobia were also included, given that incorporating pollen into bread is not a traditional practice in Brazil.
Participants responded using a five-point Likert scale, ranging from (1) strongly disagree to (5) strongly agree for each statement, as indicated in Table 2. These questions were adapted from the Health and Taste Attitude Scale (HTAS) and from studies that assessed consumers' perceptions of functional foods (Roininen et al., 1999, Saba et al., 2019).
Table 2 Statements used in attitudinal questionnaire
| General health interest |
|---|
| The healthiness of food has little impact on my food choices. |
| I am very particular about the healthiness of food I eat. |
| I eat what I like. I do not worry much about the healthiness of food. |
| It is important for me that my diet is low in fat. |
| I always follow a healthy and balanced diet. |
| It is important for me that my daily diet contains a lot of vitamins and mineral. |
| The healthiness of snacks makes no difference to me. |
| I do not avoid food even if they may raise my cholesterol. |
| Light product interest |
| I do not think that light products are healthier than conventional product. |
| In my opinion, the use of light products does not improve one’s health. |
| In my opinion, light products don’t help to drop cholesterol levels. |
| I believe that eating light products keeps one’s cholesterol level under control. |
| I believe that eating light products keeps one’s body in good shape. |
| In my opinion by eating light products one can eat more without getting too many calories. |
| Natural product interest |
| I try to eat food that do not contain additives. |
| I do not care about additives in my daily diet. |
| I do not eat processed foods, because I do not know what they contain. |
| I would like to eat only organically grown vegetable. |
| In my opinion, artificially flavoured are not harmful for my health. |
| In my opinion, organically grown foods are no better for my health than those grown conventionally. |
| Craving for salty foods |
| In my opinion it is strange that some people have cravings for pizza. |
| In my opinion it is strange that some people have cravings for salty foods. |
| In my opinion it is strange that some people have cravings for pop-corn. |
| I often have cravings for pizza. |
| I often have cravings for salty foods. |
| I often have cravings for pop-corn. |
| Using food as a reward |
| I reward myself by buying something really tasty. |
| I indulge myself by buying something really delicious. |
| When I am feeling down I want to treat myself with something really delicious. |
| I avoid rewarding myself with food. |
| In my opinion, comforting oneself by eating is self-deception. |
| I try to avoid eating delicious food when I am feeling down. |
| Pleasure |
| I do not believe that food should always be source of pleasure. |
| The appearance of food makes no difference to me. |
| When I eat, I concentrate on enjoying the taste of food. |
| It is important for me to eat delicious food on weekdays as well as weekends. |
| An essential part of my weekend is eating delicious food. |
| I finish my meal even when I do not like the taste of a food. |
| Food Neophobia Scale |
| I am constantly sampling new and different foods. |
| I don’t trust new foods. |
| If I don’t know what is in a food, I won’t try it. |
| I like foods from different countries. |
| Ethnic food looks too weird to eat. |
| At dinner parties, I will try a new food. |
| I am afraid to eat things I have never had before. |
| I am very particular about the foods I will eat. |
| I will eat almost anything. |
| I like to try new ethnic restaurant. |
2.4 Expected liking and characterization of bread stimuli
In the final stage of the study, 12 visual stimuli were characterized using CATA questionnaire and ex-pected liking (Melendrez-Ruiz et al., 2022). Twelve visual stimuli were created using a four-by-three factorial arrangement, with four levels of bee pollen addition: 0%, 3%, 5%, and 8%; and three levels of claims: "without claim," "with added bee pollen," and "with added bee pollen that increases immunity and prevents cancer." To make the stimuli more realistic, images corresponding to the levels of the factor "bee pollen content" were taken from real breads manufactured by the authors, which contained the corresponding concentrations of bee pollen. Afterward, the images were combined with the different levels of the "claims" factor (Figure 1).
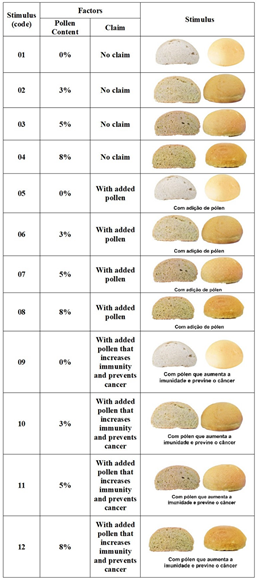
The attributes used in the CATA questionnaire were based on the preliminary tests and researcher discussions. The 30 terms included were: to eat alone, to eat together, traditional, modern, expensive, soft, chic, I don't like it, I like it a lot, cheap, hard, not attractive, I would buy, I would not buy, exotic, bitter, salty, light, for vegetarians, for athletes, healthy, sweet, attractive, heavy, natural, unfamiliar, pleasant aroma, It makes me satisfied, trend, pleasant color, and un-pleasant color. The stimuli were presented monadically and sequentially, and the participants were asked to check all the attributes that characterized the stimuli. A 9-point hedonic scale was then used to assess participants' expected liking, ranging from (1) "extremely disliked" to (9) "extremely liked".
2.5 Data analysis
The average of each statement of the questionnaire regarding "general health," "light products," "natural products," "salty products," "food as a reward," "pleasure," and "food neophobia" was calculated for each participant. A cluster analysis was then conducted using Euclidean distance and Ward's clustering criteria to group consumers and construct the dendrogram. Subsequently, the following analyses were conducted for each cluster: (1) ANOVA for the attitudes described above, considering the "cluster" and "consumers" as sources of variation; (2) Correspondence analysis on the frequencies of attributes that characterize each stimulus by cluster; (3) Penalty analysis, using the attributes that cause a drop in consumers' liking by cluster, for all stimuli (Rios-Mera et al., 2020). Analyses were performed using XLSTAT and R, with a 95% confidence interval.
3. Results and discussion
In this section, we will first explore the clustering of participants, followed by an analysis of the results for each cluster of consumers.
3.1 Consumers' attitudes by cluster
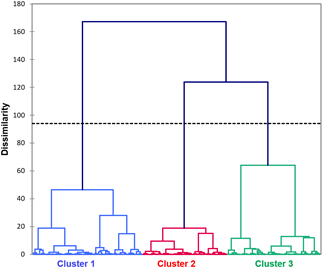
Positioning the product in the market and identifying a target audience are crucial aspects of product development. Using cluster analysis, consumers can be categorized into groups with similar behavior patterns, allowing for the identification of products that may appeal to each group. In this research, a cluster analysis was conducted based on the averages of the attitudinal questionnaires (Saba et al., 2019), resulting in the identification of three groups of consumers, as depicted in Figure 2.
Each cluster comprises consumers who showed similarity of agreement concerning statements related to interest in "general health," "light products", "natural products," "salty products," "food as a reward", "pleasure", and "food neophobia", presented in the attitude questionnaire (Figure 1).
Table 3 Attitudinal characterization of clusters
| Cluster | Health | Light | Natural | Neophobia | Pleasure | Reward | Salty |
|---|---|---|---|---|---|---|---|
| 1 (n= 86) | 3.206a | 2.961a | 3.231a | 2.291a | 3.444a | 3.440a | 3.339a |
| 2 (n= 66) | 3.231a | 2.636b | 3.202a | 2.289a | 3.528a | 3.543a | 3.245a |
| 3 (n= 73) | 3.312a | 2.826ab | 3.194a | 2.379a | 3.562a | 3.429a | 3.251a |
| P-value | 0.600 | 0.025 | 0.940 | 0.654 | 0.364 | 0.541 | 0.738 |
Means that do not share a letter are significantly different (p < 0.05).
According to Table 3, no significant differences were found between clusters (p>0.05), except for the attitude towards "light products," where cluster 2 showed less interest. Based on the results, cluster 1 is represented by 38% of the participants, showing significantly lower mean values than the other groups for general health issues; however, they showed a slight preference for natural and light products. Cluster 1 consumes the product more frequently than the other groups (Figure 2), which can explain its greater interest in light and natural bread.
Cluster 2 represents 29% of the total respondents consisting of consumers with an intermediate interest in general health among the 3 clusters. However, these consumers exhibit the highest consumption of food as a reward. In similar studies, Pohjanheimo & Sandell (2009) and Verbeke (2005) found that consumers who prioritize the health benefits of food are more likely to accept bitter flavors than those who prioritize comfort, taste, and familiarity.
Health concerns are most prevalent in cluster 3, comprising 32% of all respondents. This cluster primarily comprises women, individuals with completed graduate studies, aged 26 to 35, and a higher percentage of elderly people (over 66 years old).
The findings of Almli et al. (2019) support the future discussion that socio-demographic factors are associated with possible attitudes and behaviors. They also identified 2 clusters with different attitudes toward health concerns. The low health attitude group was mainly composed of young males, while the high health attitude group was primarily composed of women, with high levels of education and elderly people (75-87 years old).
3.2 Characterization of visual stimuli by CATA questions
To obtain a perceptual map of stimuli and attributes for each cluster, a correspondence analysis was performed on the contingency table of the CATA questions data. Based on the correspondence analysis of cluster 1, the first two dimensions explained 83.81% of the variability in the data (Figure 3). Cluster 1 had the highest discriminatory power among samples based on the presence of the claim, since of the five stimuli located in the positive part of the first dimension, four (1, 2, 3, and 4) are images of bread without any information. Among these samples, stimulus 1 was characterized by terms such as "I wouldn't buy," "to eat alone," "hard," "not attractive," and "I don't like it". On the other hand, samples 3, 4, and 5 were correlated with the attributes "cheap", "traditional", "I like it a lot", "heavy", "soft", "salty", and "light".
The upper positive part of the first dimension was correlated with stimuli 1 and 5, representing 0% bee pollen content. These stimuli were characterized by descriptors such as "unpleasant color," "sweet," "unattractive," "I wouldn't buy," "hard," and "to eat alone". Thus, consumers associated the images of breads without bee pollen with some negative attributes, which can be related to a perception of the absence of natural compounds, considered beneficial to health. Lampila et al. (2009) studied consumer attitudes toward enhanced fruit flavonoid content and found that even consumers who were unaware of the health benefits of flavonoids "related them to health" because they originated from vegetables.
The stimuli 10, 11, and 12, which contain the claim "boosts immunity and prevents cancer," are located next to the attributes "healthy, natural, and attractive." These results suggest that participants in this group were influenced by the inclusion of the health claim and perceived bread enriched with bee pollen as a product that provides health benefits, which can be explained by their slightly higher average of natural and light products (Table 3). Additionally, this cluster had a much higher percentage (47.67%) of people aged 18-25 compared to the other clusters. Previous studies also found that health claims impacted consumer interest (Ares et al., 2010) and that young people are more likely to be interested in disease prevention claims (Ares et al., 2009). The first two dimensions of the correspondence analysis of cluster 2 explained 82.19% of the total variance (Figure 4). Consumers in this cluster separated samples based on the bee pollen concentration (0%, 3%, 5%, and 8%). The negative side of the first dimension was correlated with stimuli containing bee pollen, which were positioned closely together on the perceptual map. These stimuli were described as "It makes me satisfied," "pleasant aroma," "to eat together," "I would buy," "natural," "attractive," "healthy," and "bitter." Conversely, stimuli without bee pollen were characterized by "I don't like it," "I wouldn't buy," and "not attractive" (stimulus 1), as well as "hard" and "sweet" (stimuli 5 and 9). Considering that consumers in this cluster completely separated the stimuli related to bee pollen, it is clear that they have a positive perception of the addition of natural ingredients in food. This aligns with their interest in natural products, as observed in the attitudinal questionnaire data (Table 3).
The correspondence analysis of cluster 3, accounting for 81.86% of the variance in the first two dimensions (Figure 5), reveals that, similarly to what was observed in cluster 2, the stimuli were separated according to bee pollen concentrations.
Based on the stimulus description, consumers within this cluster were able to distinguish pollen concentrations more precisely. Stimuli containing both bee pollen and a health claim (10, 11, and 12) were positioned in the negative part of the first dimension and categorized as "healthy", "natural", "attractive", "pleasant aroma", and "I would buy".
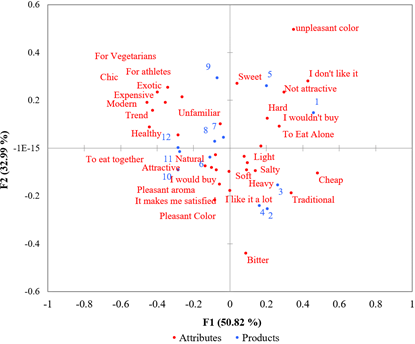
Figure 3 Perceptual space of stimuli and attributes in the first and second dimensions of the correspondence analysis of Cluster 1.
On the other hand, stimuli without a health claim (1, 2, and 3) were located in the positive part of the first dimension and were associated with the descriptors "traditional", "cheap", "salty" and "heavy", and images without added bee pollen (stimuli 1, 5, and 9) were described with the attributes "I wouldn't buy", "not attractive", "I don't like it", and "unpleasant color". These results can be explained by the attitudinal questionnaire since cluster 3 is the most interested in health-related issues and natural and healthy products. Furthermore, Lampila et al. (2018) concluded that as individuals age, their attitude toward the healthiness and functionality of food becomes more positive. This observation aligns with the characteristics of the most representative consumers in Clusters 2 and 3.
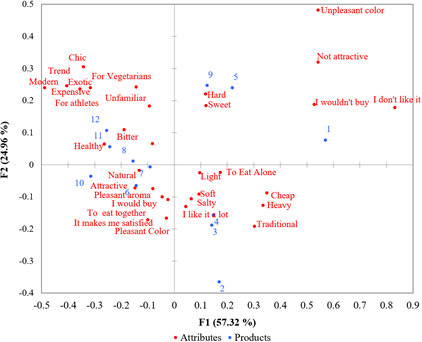
Figure 4 Perceptual space of stimuli and attributes in the first and second dimensions of the correspondence analysis of Cluster 2.
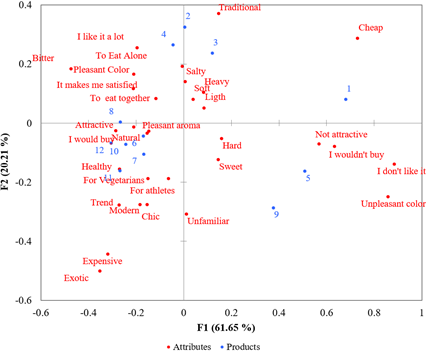
Figure 5 Perceptual space of stimuli and attributes in the first and second dimensions of the correspondence analysis of Cluster 3.
3.3 Drivers of liking/disliking
Several factors influence quality perception, including individual, environmental, and product-related factors. According to Kotler et al. (2013), four consumer characteristics influence decision-making: individual characteristics (demographics, personality, lifestyle), psychological characteristics (knowledge, perceptions, motives, attitudes, involvement), cultural factors (social class, reference group), and social factors (family, reference groups). In addition, environmental factors (e.g., situational factors, such as time and occasion) and product-related factors (e.g., price, location, promotion, and product attributes) may have an impact on consumption characteristics (Kotler et al., 2013). When analyzing personal factors, we can observe that the clusters under study are composed of consumers who share similar characteristics, with slight variations in their response to factors related to product attributes.
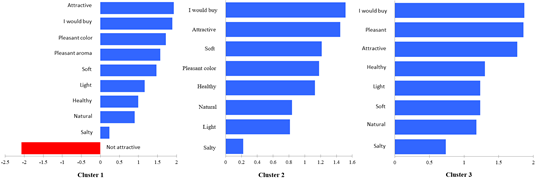
In each cluster, sensory attributes that increase or decrease acceptance, also known as drivers of liking (DL)/disliking, were determined using penalty analysis. The attributes "I would buy," "attractive," "pleasant color," "healthy," "natural," "soft," "light," and "salty" are drivers of liking common to the 3 clusters (Figure 6); that is, these DLs have a greater positive influence on product acceptance than other terms for consumers in this study. Thus, consumers value healthier, more natural, and sensory-pleasant (attractive and salty) foods.
Overall, the study of consumers' perceptions revealed that cluster 1 exhibited a different attitude in relation to the others regarding the evaluated stimuli, despite having similar interests concerning general health. In contrast, clusters 2 and 3 exhibited a high degree of similarity. For cluster 1, attractiveness is highly influential in bread since "attractive" and "not attractive" are the terms that most positively and negatively affect expected liking, respectively. In addition, this cluster was the only one with a significant negative driver of liking, indicating that cluster 1 is more demanding regarding these products. Clusters 2 and 3 presented the same drivers of liking, but in different order of importance. The primary factors they consider are appearance (attractive and pleasant colors) and healthiness (healthy, light, natural).
4. Conclusions
The possibility of adding bee pollen as a functional ingredient can be justified, mainly due to pollen's health promotion properties. Based on the responses to the attitudinal questionnaire, it was possible to know how consumers were segmented. The consumer perception study showed that, despite the segmentation among the participants, the 3 clusters positively characterized bread due to the presence of bee pollen as a healthy product, indicating that they value products with natural ingredients and a health appeal. Furthermore, even at different levels, the penalty analysis showed that the 3 clusters were concerned about healthiness. Based on the findings of this study, consumers are more likely to value products that incorporate natural ingredients and have a health appeal, such as bread that contains bee pollen.

