


Servicios Personalizados
Revista

Articulo
 Inglés (pdf)
 Articulo en XML
 Referencias del artículo
 Enviar articulo por email
Indicadores
-
 Citado por SciELO
Links relacionados
-
 Similares en
SciELO
Similares en
SciELO
Compartir

 Permalink
Revista Digital de Investigación en Docencia Universitaria
versión On-line ISSN 2223-2516
Rev. Digit. Invest. Docencia Univ. vol.10 no.2 Lima jul./dic. 2016
http://dx.doi.org/10.19083/ridu.10.447
http://dx.doi.org/10.19083/ridu.10.447
EXPERIENCIA DOCENTE
Perceptual Map Teaching Strategy
Estrategia de enseñanza de mapas perceptuales
Estratégia de ensino de mapas perceptuais
Mario Chipoco Quevedo*
Facultad de Negocios, Universidad Peruana de Ciencias Aplicadas.Lima, Perú
* E-mail: pcadmchi@upc.edu.pe
RESUMEN
Este documento contiene el diseño de una estrategia para enseñar mapas perceptuales en un curso de gerencia de marca, con la adición de una técnica de modelado para elaborarlos. Los mapas perceptuales son herramientas para el análisis del posicionamiento de marca, y se enseñan en cursos de pregrado y postgrado. Sin embargo, es muy usual utilizar un marco puramente descriptivo y teórico, sin explicar los mecanismos para construirlos. Se presentan métodos basados en regresión multilineal y en análisis factorial como herramientas de modelado, para explicar en clase y proporcionar una mejor comprensión de esta materia.
Palabras clave: mapa perceptual, regresión multilineal, análisis factorial, estrategia de enseñanza
ABSTRACT
This paper comprises the design of a strategy to teach perceptual mapping in a Brand Management course, adding a modeling technique in order to elaborate such maps. Perceptual maps are tools used to analyze the positioning of a brand, and are taught in undergraduate and graduate courses. However, very frequently a purely descriptive and theoretical framework is used, disregarding the mechanisms to construct them. Methods based on multiple linear regression and factorial analysis are presented as modeling tools to explain and foster a better understanding of this subject in class.
Keywords: perceptual map, multilinear regression, factor analysis, teaching strategy
RESUMO
Este documento contém o desenho de uma estratégia para ensinar mapas perceptuais em um curso de gestão de marcas, incluindo uma técnica de modelagem para elaborá-lo. Os mapas perceptuais são ferramentas para a análise do posicionamento da marca, e são ensinados em cursos de graduação e pós-graduação. No entanto, é muito comum o uso de um marco puramente descritivo e teórico, sem explicar os mecanismos para construí-los. São apresentados métodos baseados na regressão linear múltipla e em análise fatorial, como ferramentas de modelagem, para explicar na sala de aula e assim fornecer uma melhor compreensão desta matéria.
Palavras-chave: mapa perceptual, regressão linear múltipla, análise fatorial, estratégia de ensino
The perceptual map is a highly utilized tool to analyze brand positioning. As such, it is included in marketing courses, both at undergraduate and postgraduate level. Even though it is widely taught in academia and utilized in corporate marketing environments, the procedures to build it are not provided and their use is restricted to professional training for marketing research firms and practitioners. The methods to produce maps are rather complicated for company managers and marketing students and, consequently, marketing textbooks dealing with this matter are used to present the map itself without explaining how it was produced (Rekettye & Liu, 2001).
A recurring issue in teaching any subject is the quality of the course material, and no matter how much experience a teacher has had in business, contents must be added to the course material, so as to keep it structurally sound and updated, in order to satisfy evolving needs of students and related stakeholders (Andrade, Huang & Bohn, 2015). To improve the depth and quality of one key topic in branding courses—commonly taught only with a description of features, purposes and examples— this article develops a teaching strategy and a class transcript that includes the theory behind a perceptual map and the procedures to build it.
REVISION OF LITERATURE
A perceptual map or multidimensional scaling (MDS) is a procedure for determining the perceived relative images of a set of objects, such as products or brands. MDS turns consumer appraisals of similarity or preference into distances represented in perceptual space. For instance, if brands A and B are judged by respondents to be the most similar of a group of brands, the MDS algorithm will place brands A and B so that the distance between them in multidimensional space is smaller than the distance between any other two pairs of brands. Respondents may justify the similarity between brands on any basis—tangible or intangible (Keller, 2013). An example from Ferrell and Hartline (2011) is shown in Figure 1 .
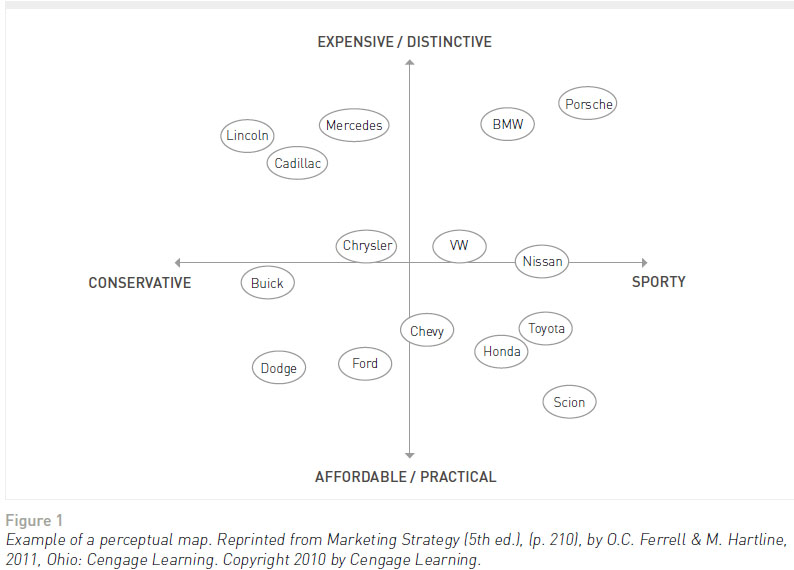
The axes represent underlying dimensions that respondents might use to shape perceptions and preferences of brands. Dimensions can be represented using MDS, cluster analysis or other computer algorithms; typically, two dimensions are the most salient for customers. Perceptual maps illustrate two basic findings: they indicate similarity of products and brands in terms of relative mental positions, and show voids in the current mindscape for a product category (Ferrell & Hartline, 2011).
The pairwise distances between brand options directly indicate the perceived similarities between any pair of products or, in other words, how close or far apart the brands are in the minds of customers (Lilien & Rangaswamy, 2004).
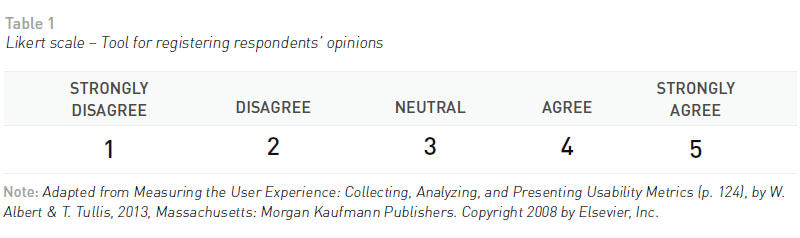
One way to produce a map with similar features is by using multilinear regression. A focus group can be used to determine the most important attributes (Rekettye & Liu, 2001). Data is collected from respondents, specifically the ratings they give to products. The general form of the question is: (Brand name) is a (attribute) (product category). For this, a Likert scale can be used to register the respondents opinion over a set of attributes of the competing products or brands, as shown in Table 1.
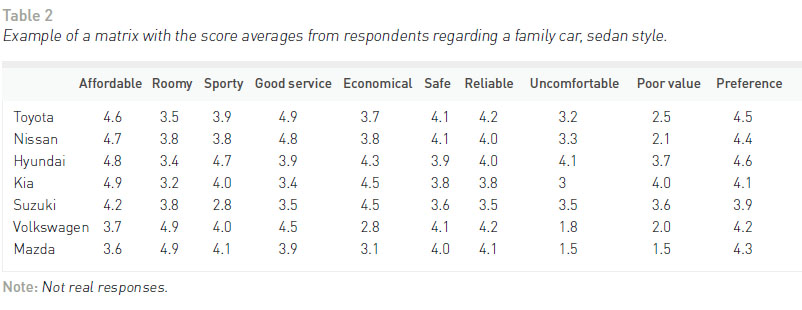
Respondents should also answer an overall preference question for each brand. Once all responses have been averaged, a matrix can be obtained as in the following example shown in Table 2.
Finally, in order to define which attributes should be the axis of the perceptual map, a preference regression can be estimated using a linear regression model, as follows (Wilcox, 2003):
Overall preferencein = α + β1 Attribute 1in + β2 Attribute 2in + + βM Attribute Min + εin
In this example, M = 9 attributes, n = 7 brands, Overall preferencein is the preference of respondent i for brand n, Attribute 1in is respondent i rating Attribute 1 for brand n, and so forth. Greek letters represent parameters to be calculated by the regression (Wilcox, 2003). The rationale behind this method is that the overall attractiveness of a brand is explained by the combination of its attributes, and the regression can help determine the weight of each one. For this purpose, a software package such as Excel can be used to estimate the model, and from that point, the two coefficients with the greatest absolute value are chosen to be the axis of the map, subject to the restrictions that are statistically significant. The most important attribute is used for the horizontal axis, and the average attribute ratings of these two attributes are used to plot each brand on an XY map, as shown in Figure 2 .
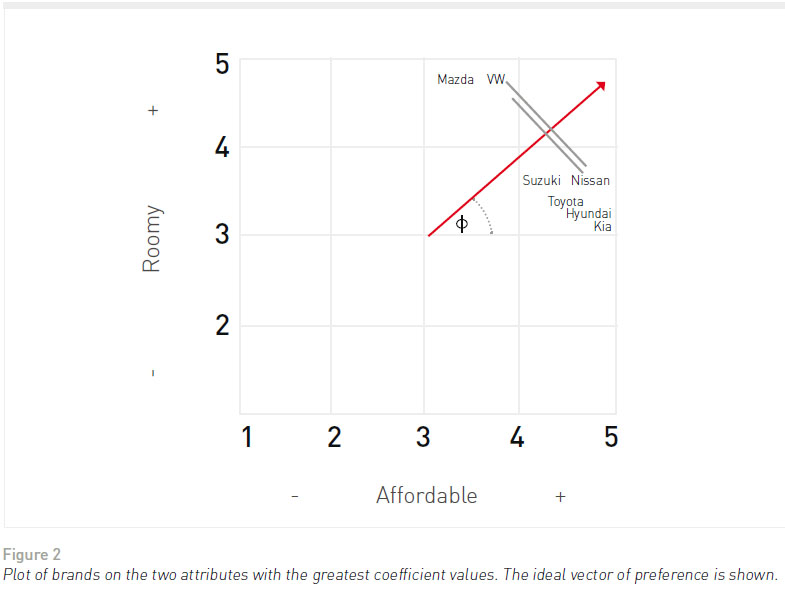
An ideal vector of preference can be constructed by dividing the Y coefficient by the X coefficient, and this ratio defines the slope of that vector, the inverse tangent of angle φ in Figure 2 . By constructing lines that are perpendicular to the ideal vector, the overall preferred brand would be the one whose line intersects the vector farther from the origin, which in the example is VW.
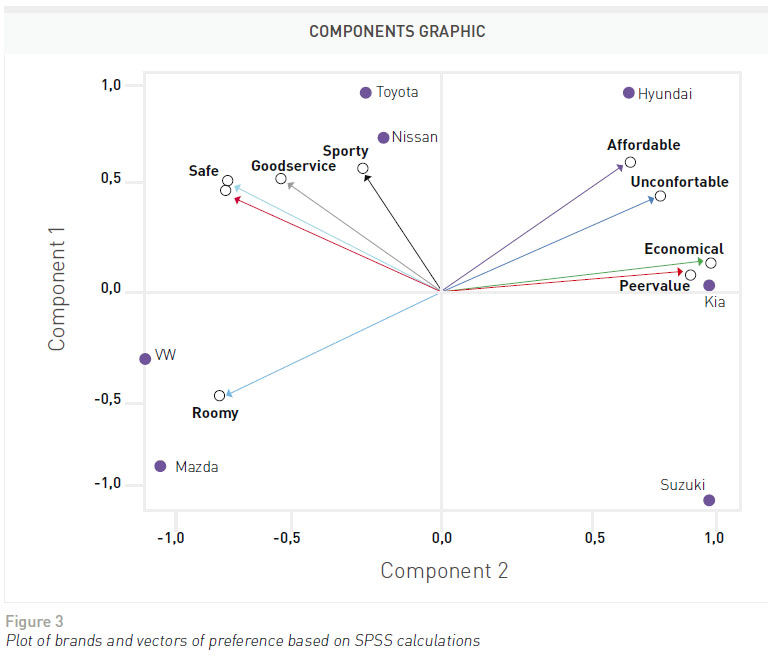
Factor analysis is a technique that can be used to build a perceptual map with preference vectors that represent the attributes; SPSS or a similar statistical package is needed for this. Factor analysis is used to find out whether a number of variables of interest are linearly related to a smaller number of unobservable factors that share a common variance, a condition that prevents the use of a regression technique (Tryfos, 1997). Factor analysis uses matrix algebra, and the basic statistical function used is the correlation coefficient that determines the relationship between two variables. Every possible correlation among the variables has to be computed before running a factor analysis (Yong & Pearce, 2013). In a coordinate system, the factors are represented by the axes and the variables are lines or vectors. When a variable is in close proximity to a factor, it means there is an association between them. The main goal of factor analysis is to obtain scientific parsimony or brevity of description (Harman, 1976; Comrey & Lee, 2013). SPSS will generate the two unobserved orthogonal factors, will provide the coordinates for the preference vectors and the brands, and will allow for a full map to be drawn up, as shown in Figure 3.
TEACHING STRATEGY GUIDE
A guide was designed to provide orientation on how to teach perceptual map construction for undergraduate and postgraduate marketing courses. Companion PowerPoint and Excel files are provided as supplementary documents to this paper. The design process was based on the reviewed literature, which provided the background to develop basic concepts and an example where the theory is applied by utilizing a step-by-step method, based on the calculations displayed on the slides and on the spreadsheet as well. The conventional topics of perceptual maps are revisited briefly, in order to set up a context for the construction methods to be explained. The focus of the learning session would be to emphasize the way to obtain the data which serves as the basis for the analysis, the rationale behind the methods to be applied to build a visual model for the visual representation, and the information provided by the maps. This guide is shown in the following paragraphs:
Subject: Perceptual maps
Mode: Face-to-face, e-learning, blended
Audience: Undergraduate and postgraduate students of Brand and Product Management courses. Typically, undergraduate students of the second year of the Marketing study program take this course. As it is considered an intermediate subject, it is mandatory to have knowledge of basic concepts and tools such as positioning and branding strategies, and similar matters. This is the reason why undergraduate students can be considered a suitable audience for the material covered in this paper. Similarly, postgraduate students take Marketing courses as part of the curricular plan for executive education or MBA programs. A Marketing course deals mainly with concepts and strategies, a broad range of tools to assess situations, make decisions, and design actions.
Estimated time: 2 hours
Location: Classroom with an instructor present; remote via internet
Focus: To broaden the knowledge of students with improved tools
Rationale: Perceptual maps are broadly used, but they are taught only in a descriptive way; it would be desirable to improve the depth of concepts in order to provide a better-quality teaching.
Purpose: To raise the content level for marketing courses and provide additional value to students
Contents: A document with the suggested transcript of the class, slides with images and bullets to describe main concepts, and an example spreadsheet with calculations
Required knowledge: Basic statistics, command of SPSS, and spreadsheet skills
Suggested class transcript: See Appendix A.
CLASSROOM EXPERIENCE
In face-to-face classes with undergraduate and postgraduate students, the method applied was to give a brief explanation of the foundation of the methodology, with the help of Figures 1 and 2, and Tables 1 and 2 (as outlined in the transcript file), so the rationale behind the construction of the map was clear for the participants. Then, an explanation of the questionnaire and the application of the Likert scale of Table 1 was discussed, in order to go directly to the example and provide the steps to model the graphic representations of the brands positioning under the two methods. Once the regression and the dimension reduction methods were explained by using the spreadsheet and the statistical software, most participants were able to build their own maps without any further consultations, on both undergraduate and postgraduate groups. The strategy to assess students’ achievement was to assign the construction of a perceptual map for a brand of their choice.
CONCLUSION
People are better at processing visual than numerical information, so a data-derived visual representation of how customers perceive the structure of a market provides finer details and facilitates understanding. The information in a perceptual map is especially helpful to make decisions in new contexts, such as when the firm is developing a positioning strategy for a new product (Lilien & Rangaswamy, 2004). This useful and broadlyutilized tool needs to be communicated and explained with much more detail to enrich the background body of knowledge of students and professionals, given its ample use in product design, advertising, retail location, and other marketing applications where there is a need to know the basic cognitive dimensions under which consumers evaluate products, and the relative positions of current and new products with respect to those dimensions (Hauser & Koppelman, 1979).
With this class, students receive a knowledge that is not often provided, and that is instrumental to obtaining a deep understanding of positioning, by means of basic statistics and commercial software packages (Wilcox, 2003). Additionally, according to Hauser and Koppelman (1979), attribute-based techniques should provide better measures of consumer perceptions than other methods, and it is expected that factor analysis could provide a richer perceptual structure than other kinds of analysis, so their utilization in the classroom is justified. However, as noted by Shocker and Srinivasan (1979), these approaches are less applicable to concept generation because a point in the reduced space of dimensions corresponds to an infinity of points in the original space of determinant attribute, leading to ambiguity.
It is important to mention that multidimensional scaling can be applied to different fields, not only to product positioning research. As an example, The Risk Communication Laboratory at Temple University uses perceptual mapping methods to design risk communication materials, so as to obtain a visual display of how respondents perceive the relationships between a set of elements, such as medical treatments and their perceived risks and benefits (Parvanta, Nelson, Parvanta & Harner, 2010).
Finally, this strategy elaborates on the fact that marketing teaching goes beyond conceptual contents, because the discipline also requires putting together and analyzing data, models and simulations to get a better grasp of solutions to real life challenges.
REFERENCES
Albert, W., & Tullis, T. (2013). Measuring the User Experience: Collecting, Analyzing, and Presenting Usability Metrics. Massachusetts: Morgan Kaufmann Publishers.
Andrade, J., Huang, W. D., & Bohn, D. M. (2015). The Impact of Instructional Design on College Students’ Cognitive Load and Learning Outcomes in a Large Food Science and Human Nutrition Course. Journal of Food Science Education, 14(4), 127-135. doi:10.1111/1541-4329.12067
Bijmolt, T. H., & van de Velden, M. (2012). Multiattribute perceptual mapping with idiosyncratic brand and attribute sets. Marketing Letters, 23(3), 585-601.
Comrey, A. L., & Lee, H. B. (2013). A First Course in Factor Analysis (2nd Ed.). New York: Psychology Press. Ferrell, O. C. & Hartline, M. (2011). Marketing Strategy (5th ed.). Ohio: Cengage Learning. Harman, H. H. (1976). Modern Factor Analysis. USA: University of Chicago Press.
Hauser, J. R., & Koppelman, F. S. (1979). Alternative Perceptual Mapping Techniques: Relative Accuracy and Usefulness. Journal of Marketing Research, 16(4), 495–506. doi:10.2307/3150810
Keller, K. L. (2013). Strategic Brand Management. England: Pearson. Lilien, G., & Rangaswamy, A. (2004). Marketing Engineering (2nd ed.). Canada: Trafford Publishing.
Parvanta, C. F., Nelson, D. E., Parvanta, S. A., & Harner, R. N. (2010). Essentials of Public Health Communication. USA: Jones & Bartlett Publishers.
Rekettye, G., & Liu, J. (2001). Segmenting the Hungarian automobile market brand using perceptual and value mapping. Journal of Targeting, Measurement and Analysis for Marketing, 9(3), 241-253. doi:10.1057/palgrave.jt.5740019
Shocker, A. D., & Srinivasan, V. (1979). Multiattribute Approaches for Product Concept Evaluation and Generation: A Critical Review. Journal of Marketing Research, 16(2), 159–180. doi:10.2307/3150681
Tryfos, P. (1997). Chapter 14: Factor Analysis. Methods for Business Analysis and Forecasting: Text and Case.
Yong, A. G., & Pearce, S. (2013). A Beginner’s Guide to Factor Analysis: Focusing on Exploratory Factor Analysis. Tutorials in Quantitative Methods for Psychology, 9(2), 79-94.
Wilcox, R. T. (2003). Methods for Producing Perceptual Maps from Data. Darden Case No. UVA-M-0665. Available at SSRN: http://ssrn. com/abstract=910097
APPENDIX A
Suggested class transcript
DESCRIPTION OF A PERCEPTUAL MAP
One way to visualize the positioning of a brand and its competitors is by using a perceptual map, which is a graphic representation of the relative perceptions of customers according to relevant attributes. An example from Ferrell is shown in Slide 4, where the attributes chosen for the axes are construction style and economic value. According to the map, Porsche and BMW are competing for similar clients, while Toyota and Honda are close competitors. The closer two brands are together in the map, the more similar they are perceived by customers, and, therefore, are more direct competitors. The map summarizes how customers perceive each brand on each attribute. For example, Porsche is perceived as the sportiest car, because it is farther away from origin than any other brand, along the direction of axis X. This also means that, as one moves in the opposite direction away from the origin, the cars become less sporty. Thus, Lincoln is the least sporty model.
If there were only one brand in some quadrant, this would have very little direct competition, and there would be a gap in the market with no other brand located close to it. This would indicate potential opportunity for a new model positioned in this quadrant. Of course, before positioning a brand in this quadrant, it would be necessary to first assess whether there would be a sufficient number of customers who would prefer such a car (Lilien & Rangaswamy, 2004).
Benefits: Clear to understand; provides insights into the market structure for a defined set of competing alternatives; suggests which attributes of a product the firm should modify in order to effect a desired change in the product’s position; indicates market gaps that could offer business opportunities to be filled in with new brands or products (Lilien & Rangaswamy, 2004).
Limitations: Maps do not offer indication of segment size, only preferences and positioning of brands; field surveys and management judgment are needed to build maps properly, which require the researcher to predetermine the set of attributes (Bijmolt & van de Velden, 2012).
PROCEDURE TO BUILD A MAP FROM DATA
How to build a map using automobile brands and their perceived attributes will be shown. The first task is to identify important and relevant attributes that have an influence on the buying decision for mediumsized passenger cars. A focus group can be used to determine the most important attributes. For this example, the following are considered: affordable, roomy, sporty, good service, economical, safe, reliable, uncomfortable, and poor value. The measurement of consumers’ perceptions can be obtained by using a Likert scale survey instrument, as shown in Slide 7. The usual form of the question is: "(Brand name) is a (attribute) car."
In general, to produce a map with N competitive brands and testing M perceptual attributes, NxM Likert scale questions must be asked. An additional question of general preference must be included in the survey, in order to have data for the modeling of an independent variable, utilizing a question in the form of: "I think that (brand name) is an excellent car". After collecting data from a sufficient number of respondents, the arithmetic mean of all answers is computed for each brand, for each attribute, and the output of this process is shown in Slide 8 (Wilcox, 2003). Then, the regression tool of an Excel spreadsheet is used in order to find the coefficients of the following equation:
Overall preferencein = α + β1 Attribute 1in + β2 Attribute 2in + … + βM Attribute Min + εin
The computed means for overall preference will serve as input data for the dependent variable Y, and the means for each attribute for each vehicle will be input data for the independent variable X range, as shown in Slide 9. The two coefficients with the greatest absolute value are chosen to be the axis of the map, subject to the statistically significant restrictions. The most important attribute is used for the horizontal axis, and the average attribute ratings of these two attributes are used to plot each brand on an XY map, as shown in Slide 10.
The final step is to construct a preference or ideal vector in order to understand the trade-offs the consumers are willing to make when choosing between different options. To do this, the Y coefficient is divided by the X coefficient so as to determine the slope or angle of the vector that represents the overall preference. By constructing lines that are perpendicular to the ideal vector, the overall preferred brand would be the one whose line intersects the vector farther from the origin, which in the example is VW.
A statistics package such as SPSS is needed to build a perceptual map that includes vectors of preference, using a technique called factor analysis. This method identifies a reduced number of factors that represent the relationships in a larger set of attributes. We would aim for two factors to capture a high percentage of variance in the data.
To illustrate the method, we will use the same set of data and we will upload it to SPSS. Once this is done, we will select the Analyze option, then Dimension Reduction, Factor. We select the variables for the model, not including the brands. In the menu, we select the Descriptives option, then Initial Solution, and Correlation options; then we get back to the menu, and select Extraction, then Correlation Matrix, Unrotated Factor Solution, then enter 2 for the number of factors. Finally, we select Rotation, and select None and Loading Plots; then, select Scores, Display Factor Score Coefficient Matrix. Then select Run.
SPSS will evaluate as many factors as there are attributes, nine for this example. Choose the first factor F1, so it explains as much of the total variance as possible. Move on to choose the second factor F2 to be orthogonal (uncorrelated) to the first and explain as much of the remaining variance as possible. Continue to the third, fourth, to the ninth factor, as shown in Slide 15. SPSS will also provide the coordinates (Slide 16) and length (Slide 17) of the preference vectors, and the coordinates for the brands (Slide 19). We can put together all of this information in a plot such as the one shown in Slide 20.
(End of transcript)
Recibido: 02/11/15
Revisado: 10/03/16
Aceptado: 25/04/16
Publicado: 15/11/16
