Inglés (pdf)
 Articulo en XML
 Referencias del artículo
 Enviar articulo por email
 Citado por SciELO
  Similares en
SciELO
Similares en
SciELO 
 Permalink
Introduction
Despite its numerous definitions and treatments, the concept of group cohesion, as applied to social areas and contexts, is a key process in terms of strengthening the creation, training and development of working groups, as well as in favoring positive early outcomes (Chang & Bordia, 2001; Barrasa & Gil, 2004). Traditionally, group cohesion was defined as a unitary construct (Fes-tiger, 1950). Over time, however, it has evolved to be considered a dynamic, multi-dimensional construct (Beal et al., 2003; Picazo et al., 2009). The most frequently used, classic definition was proposed by Carron, Brawley and Widmeyer (1998), who defined group cohesion as: "a dynamic process that is reflected in the tendency for a group to stick together and remain united in its pursuit of instrumental objectives and/or for the satisfaction of members’ affective needs". Later, Dion (2000) went on to conclude that social and task dimensions are fundamental to the multidimensional approach of the cohesion construct and are applicable to distinct group types. Social cohesion may be defined as the motivation to develop and maintain interpersonal relationships between group members. Task cohesion refers to the degree to which group members work together to accomplish their common goal (Carless & De Paola, 2000; Picazo et al., 2009; Weinberg & Gould 2010).
Researchers have examined group cohesion in a variety of fields, including the performance of sports teams (Bruner et al., 2014; Carron, 1998; Estabrooks et al., 1999; Eys et al., 2009; Gu & Solmon 2011; & Raedeke,), the employment context (Carless & De Paola, 2000; Riasudeen et al., 2019; Van Pelt, Hut-schemaekers et al., 2020) and the academic environment (Forrester & Tashchian, 2006; Van Leeuwen & Janssen, 2019; Dyson et al., 2020). Similarly, another area of study has looked at issues such as diversity and size of the different groups (Carron & Brawley, 2000; Gitterman, 2019), as well as attitude and personality aspects (Barrick et al., 1998; Deckers et al., 2018). But few studies have examined the assessment of group cohesion and the consequences of it in the context of higher education.
A debate exists regarding the degree of effectiveness in the pursuit of results by strengthening the cohesion of the group and its variables. Buckner (1988) proposed the strengthening of the "psychological sense of community" as an explanatory mechanism for the positive consequences of group cohesion; that is, the individual or group’s work, academic and sociological performance may depend on his/her sense of identity, belonging or brotherhood, with regard to a well-known and shared physical space. Along these lines, individuals who do not feel a sense of identity and do not perceive themselves as belonging to a group are at risk of being disconnected. Therefore, psychological and social factors such as identity (Daniels & Brooker 2014), self-esteem (Murray & Kennedy-Lightsey, 2013) and group cohesion (Marcos et al., 2010; Senior, 2001) may all be relevant to achieve success and improved performance (Thornton et al., 2020).
On the other hand, Carron and Brawley (2000) established two principles that underlie group cohesion: the instrumental or task-focused principle and the social or affective one. While the first considers the goal or intentionality as the axis in terms of creating the diverse groups, the second highlights a positive emotional bond between the individual members (Carron & Brawley, 2000). Furthermore, the type of coexistence existing between both (simultaneous or asynchronous) will determine the measure of group cohesion, based on four factors: group integration regarding the task, group integration regarding the social, individual attraction to the task and individual attraction to the group (Carron & Brawley, 2000; De Vita & Barbarito, 2016).
The scientific literature on group cohesion makes special note of the idea that promoting this cohesion encourages the following: social interaction, work dynamism and the information and learning acquisition processes (Briones & Tabernero, 2005; Segovia, & Fernández, 2010). Likewise, a taxonomy of repeating factors has been found in the diverse studies conducted on group cohesion, favoring this connection between groups (Murray & Kennedy-Lightsey, 2013; Valverde, 2001): frequency of interactions; group homogeneity and maturity; nature of the external context; belonging to specific groups; specific objectives and signs of success.
As for the theory of group cohesion in the academic sector, Carron & Dennis (2001) affirmed that active and collective participation of group members apparently leads to benefits in terms of productivity, learning, interaction, individual security and satisfaction during the workday. In the university setting, Forrester & Tashchian (2006) suggested that the consideration of cohesion in this academic area has been quite limited and non-specific. The main problem in the research of group cohesion in the university setting lies in the singular consideration (for its measurement) of group integration towards the task and the social, ignoring attitudinal aspects and the individual beliefs of group members (Forrester & Tashchian, 2006; Troth et al., 2012).
The multi-dimensional model of Carron et al. (1985) describes cohesion by distinguishing between the following principal dimensions: the individual’s connection to the group task (ATG-T) or measurement of the emotional aspects related to individual participation in the aspects of the group’s task; the individual’s connection to the social group (ATG-S), a variable that considers the group member’s feelings regarding their personal contribution to the group’s social aspects; integration of the group and the task (GI-T) which combines the member’s feelings regarding the similarity and unification of the group with regard to the task; group-social integration (GI-S) which, in this case, measures the group member’s feelings regarding the group’s similarity and unification as an indivisible social unit. This model gave rise to the GEQ questionnaire, which assesses the 4 previously mentioned dimensions (Carron, et al. 1985). Although this questionnaire was designed to measure cohesion in the context of sports, it has been subsequently applied to a wide variety of fields (Carron et al., 2012). Using the multi-dimensional model of Carron et al. (1985) as a reference point and expanding to consider that of Carron & Brawley (2000), Bosselut et al. (2018) designed and validated a new measure of cohesion that can be applied to the university context, the "University Group Environment Questionnaire" (UGEQ) in the French population. Studies analyzing the UGEQ have found that it has satisfactory psychometric characteristics.
To the best of our knowledge, however, no assessment instrument is available in the Spanish context having suitable psychometric properties to assess group cohesion in the university context. Therefore, the main objective of this work was to adapt and validate the university group cohesion measure (UGEQ) to the Spanish population, using a representative sample of Spanish university students. To reach this objective, the Spanish version of the UGEQ will be translated and adapted to the Spanish context. After that, its psychometric properties will be analyzed, considering the factorial structure, validity and reliability. Therefore, a brief and validated instrument may be available to assess the group cohesion of higher education students within the Spanish socio-cultural setting.
Methods
Participants
The sample included 309 students from the University of Alicante (Spain). The recruitment of participants was based on a convenience sampling method. The mean participant age was 22.61 (SD=5.5) and 63.1% were female. Participants were mainly Spanish (95.8%). As for study areas, 51.1% were enrolled in the Criminology degree program, 18.1% were in the Law and Criminology dual studies program, 17.5% were pursuing a degree in Gastronomy and Culinary Arts and the remainder (27.9%) were enrolled in other official degree programs offered by this university. Inclusion criteria were: (1) be an officially enrolled student at the University of Alicante; (2) ability to read and complete the questionnaires themselves; and (3) having signed the informed consent to participate in the study.
Sample size was calculated using a ratio of 20: 1. This criterion was established by doubling the well-known 10: 1 rule, since it has been demonstrated that distinct factors may affect the required sample size (Wolf et al., 2013). All participants offered their consent to participate in the study and were duly informed of their rights. Only individuals who agreed to participate and signed the informed consent were included in the study. To protect the confidentiality and anonymity of the data, no identifying information of participants was registered. Before participating in the study, members of the research team personally informed the students in class about the characteristics and objectives of the project, making it clear that participation was entirely voluntary and not part of their course of study. Furthermore, it was explained to them that participation would have no effect on their course grades. Data collection was carried out between January and June of 2020.
Instruments
Sociodemographic variables
Information on the following sociodemographic variables was collected from each participant: age, sex, current year of study, academic degree program and nationality.
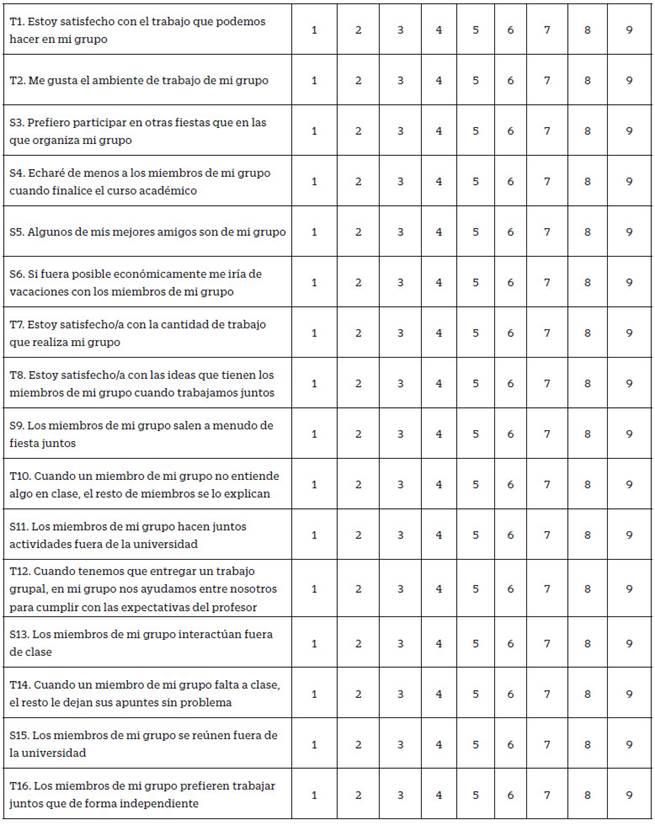
Group cohesion questionnaire for university students, the "University Group Environment Questionnaire". This measure was used to assess group cohesion in university students. It is the Spanish adaptation of the University Group Environment Questionnaire" (UGEQ) (Bosselut et al., 2018). The instrument contains 16 items to be completed using a 9-point Likert-type scale, with response options in which participants are asked to indicate their degree of conformity with each item from "strongly disagree" to "strongly agree". The UGEQ questionnaire consists of 4 dimensions of cohesion: ATG-T: Individual’s perception of personal involvement in group tasks; ATG-S: Individual’s perception of personal involvement in the group on a social level; GI-T: Individual’s sense of group closeness regarding the task; GI-S: Individual’s sense of group closeness on a social level). This questionnaire was developed by Carron, et al (1985) and contains 33 items. The original scales were found to have suitable psycho-metric properties (Bosselut et al., 2018).
Academic Stressor Scale (EEA). This scale, which assesses stressors in the academic environment, contains 54 items and include 8 subscales: methodological deficiencies of the teaching staff, DEFMET; student academic overload, SOBACA; beliefs about academic performance, CRENREN; interventions in public, INTPUB; negative social climate, CLINEG; exams, EXAM; lack of value of content, CARVAL; and difficulties in participation, DIFPAR. This instrument has been found to have suitable psychometric properties and an overall scale reliability of 0.96, ranging from 0.81 to 0.94 for each of the subscales (Cabanach et al., 2016). The Cronbach’s alpha for the overall scale in our sample was 0.97. The following coeffcients were obtained for the dimensions: (DEFMET=0.95; SOBACA=0.94; CRENREN=0.93; INTPUB=0.89; CLINEG=0.95; EXAM=0.89; CARVAL=0.84; DIFPAR=0.85). Additionally, a CFA was fitted in order to check the structure of this scale in this sample. The model provided adequate fit statistics (CFI= 0.90; TLI=0.90; SRMR=0.051 & RMSEA= 0.057 [IC 90%: 0.053-0.061]).
Questionnaire on the Climate of Perceived Responsibility in the Classroom (ECRPA). This instrument assesses the climate of responsibility promoted by the teacher and students in the classroom. It contains 10 items distributed across 2 dimensions, which assess: the climate created by the teacher, CDD; and the climate created by the classmates, CDC. This questionnaire has been shown to have suitable validity and reliability in its original version, with Cronbach’s alpha scores ranging from 0.81 to 0.89 (Fernandez-Rio et al., 2019). In our sample, the Cronbach’s alpha value was 0.86 for the climate dimension created by the teacher and 0.93 for the climate created by the classmates. In addition to this, a CFA was fitted in order to check the structure of this scale in this sample adequate fit statistics were found (CFI= 0.95; TLI=0.93; SRMR=0.087 & RMSEA= 0.011 [IC 90%: 0,086-0.129]).
Procedure
The authors of the original version of the UGEQ scale were contacted to request their authorization to adapt the scale to the Spanish population. Brislin’s methodology (1970) was used for the translation and cross-cultural adaptation of the scales to Spanish and for the translation-back translation of the instruments to a different language. The international standards promoted by the International Test Commission (Hambleton et al., 2005; Hernandez et al., 2020; Muñiz et al., 2013) were also considered, proposing that the adaption of an instrument to a new language and culture should include guarantees of conceptual, cultural, linguistic and metric equivalence. The original scales were independently translated to Spanish by two native French speakers, bilingual in Spanish, having experience in the educational sector. For each item, they scored the degree of difficulty that they experienced in its translation, on a scale from 0 to 10 (0, no difficulty or maximum equivalence; 10, maximum difficulty or minimal equivalence). They were also asked to assess conceptual equivalence and to indicate the type of changes made, as follows: type A (no changes were necessary and the sentence structure was maintained), type B (the translation required modification to ensure semantic and conceptual equivalence), and type C (some elements were not applicable to the cultural context of the destination country). Subsequently, the research team, together with the translators, systematically reviewed the items and the response options. The two translations were compared and a discussion was held to obtain a consensual version of each of the items. The translation was subject to an assessment by two higher education experts, to estimate the semantic equivalence of the items to the constructs to which they refer, until obtaining an initial consensual Spanish version of the instrument. Subsequently, a back translation was performed by two bilingual translators with a strong domain of the Spanish language, who had not been previously involved in the original translation process. They were asked to quantitatively assess the syntactic and semantic equivalence using the same procedure followed in the direct translation. Finally, the back translation was compared to the original version, verifying that the meaning of the items was the same and that no relevant formal changes existed. Small discrepancies that were found were resolved in a plenary session, obtaining the initial pilot version of the questionnaire.
The pilot version was administered to 20 university students to assess the use of language, feasibility and understanding of the items. The questionnaire was administrated by members of the research team in a personal interview. Based on the data obtained, the members of the research team reviewed the objections and modifications considered, obtaining a consensual, definitive form. The questionnaire’s translation to Spanish may be consulted in Table 7.
The set of instruments was administered using a Google Forms link, published in the university’s institutional website in the announcements section of each of the study areas involved in this project. All of the students were informed of the study’s purpose, attaching a consent form that ensured their anonymity and the confidentiality of their responses. To encourage participation, two reminders were made through the university’s institutional intranet announcements, highlighting the importance of completing the instruments. Data for the retest was collected two months after the initial data collection.
All participants signed the consent form created in accordance with the Declaration of Helsinki (2013). Confidentiality of their data was guaranteed, and participants were informed that they were free to withdraw from the study at any time.
Statistical analysis
Descriptive analyses of the sample were carried out for all of the relevant study variables (age, sex, degree in which the student was enrolled, academic year of study). Sample distribution was analyzed in search of potential outliers for the distinct subscales. However, no participants had scores differing from the mean score by 3 or more standard deviations.
To analyze structural validity, a confirmatory factor analysis (CFA) was performed. The structure of the questionnaire followed that of the original questionnaire proposed by Bosselut et al. (2018), consisting of 4 factors with 4 items each. Analyses were carried out using the lavaan package (Rosseel, 2012) in R (R Core Team, 2016). To assess the model’s goodness of fit, the following indices were used: Comparative Fit Index (CFI), Tuckey-Lewis Index (TLI), Root Mean Square Error of Approximation (RMSEA), Standardized Root Mean-Square Residual (SRMR). These indices were selected based on the recommendations of past researchers, who validated their performance and stability with values approaching 0.95 for TLI and CFI, 0.06 for RMSEA and 0.08 for SRMR (Hu & Bentler, 1999). Models of invariance for sex (male vs female) and for academic year (students of initial courses [1st and 2nd] vs students of advanced courses [3rd, 4th and 5th]) were adjusted according to the following taxonomy: model 0, configural invariance; model 1, weak invariance; model 2, strong invariance; model 3, strict invariance; model 4, full invariance. In the comparison of models, the goodness of fit (according to the previously mentioned indices), the principle of parsimony and the CFI index were all considered, as recommended in the scientific literature (Cheung & Rensvold, 2002). The ML-Robust estimator was used.
The internal consistency of the scale was assessed using the Cronbach’s alpha and Omega coefficients, with the minimal acceptable value being 0.70 (Nunnally, 1978). The test-retest reliability was assessed using the intraclass correlation coefficient (ICC) for a total of 147 participants. To verify the convergent validity, the Pearson correlation matrix was examined for the UGEQ and the ECRPA and EEA questionnaires.
Results
Confirmatory factor analysis
Each item was examined to verify its minimum, maximum, mean, standard deviation, skewness and kurtosis, and frequency of each response (Table 1 and 2). The factorial loads for each item of the four factors making up the original questionnaire are presented in Table 3.
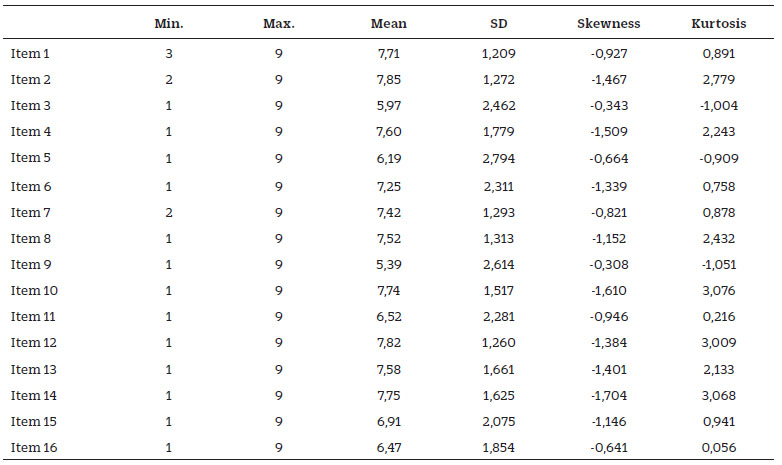
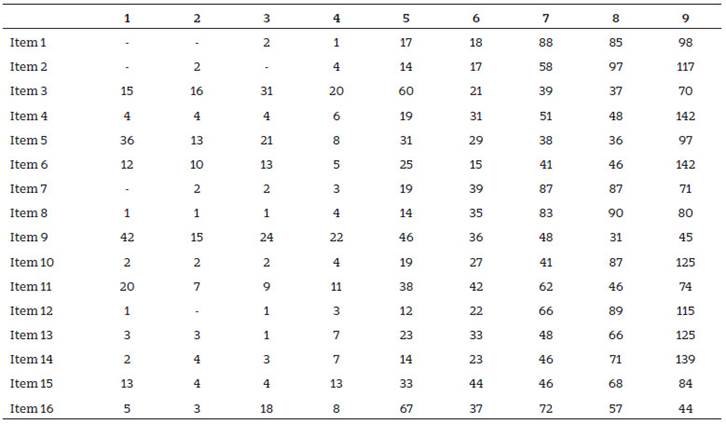
Table 3 Factorial load matrix for the UGEQ and correlations between factors
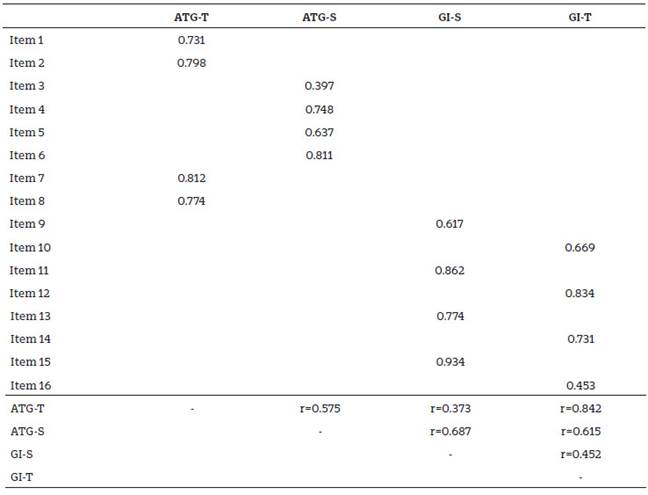
ATG-T: Individual’s perception of personal involvement in group tasks; ATG-S: Individual’s perception of personal involvement in the group on a social level; GI-T: Individual’s sense of group closeness regarding the task; GI-S: Individual’s sense of group closeness on a social level
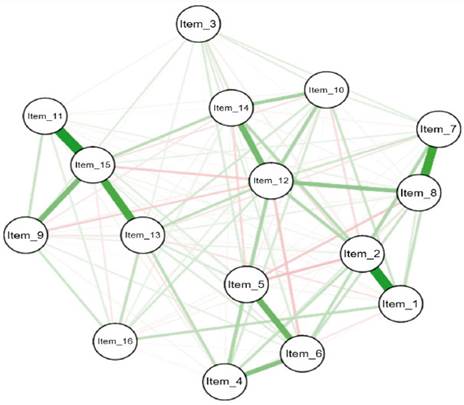
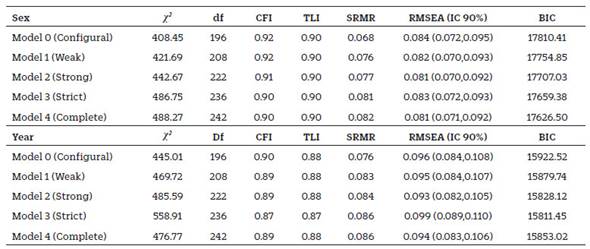
The confirmatory factor analysis of the UGEQ had the following adjustment indices for this tetra-factorial structure: CFI= 0.92; TLI=0.90; SRMR=0.068 and RMSEA= 0.081 (90% CI: 0.071-0.092). The adjustment indices for the invariance models, adjusted for sex and academic year, are shown in Table 4. None of these models had a higher adjustment index than that of the original model (Table 4). As for the comparison of invariance models (always using the "configural" invariance model as a reference), significant differences were found in the "strict" model for both variables and in the "complete" model, they were found for the "academic year" variable. These differences, however, were always less than 0.03 in CFI. A second order confirmatory model was adjusted with 4 first order and 2 second order factors. All of the adjustment indices were lower than the original 4-factor model. Figure 1 shows the magnitude of the correlations between the 16 items that make up the UGEQ (Table 3).
Internal consistency and Test-retest reliability
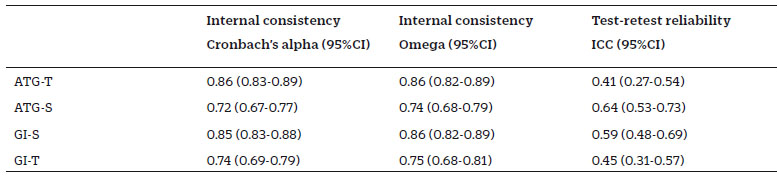
The Cronbach’s alpha values of the four factors making up the overall scale ranged from 0.72 to 0.86 (Table 5). In the case of Omega values, coefficients ranged from 0.74 to 0.86 (Table 5). These values indicate an adequate level of internal consistency for the Spanish version of the UGEQ.
Regarding temporal stability, a subsample of 147 (47.6%) participants was randomly selected to perform an additional assessment, two months following the initial one. This subsample employed for the retest analysis was equivalent to the original one, as no differences were found in any of the sociodemographic variables as compared to the original sample. The ICC values for the distinct subscales making up the instrument ranged from 0.41 to 0.64 (p<0.05) (Table 5) which can be considered as a moderate reliability (Koo & Li, 2016).
Table 5 Internal consistency and test-retest reliability
ATG-T: Individual’s perception on personal involvement in group tasks; ATG-S: Individual’s perception of personal involvement in the group on a social level; GI-T: Individual’s sense of group closeness regarding the task; GI-S: Individual’s sense of group closeness on a social level; ICC: intra-class correlation index
Convergent validity
To assess the convergent validity, the Pearson correlation indices were calculated between the 4 subscales of the UGEQ and the other related questionnaires. The ATG-T subscale revealed a moderate association with the CLINEG subscales (r=-0.187), CDD (r=0.138) and CDC (r=0.278); the ATG-S subscale with the DEFMET (r=0.157), SOBACA (r=0.126), CRENREN (r=0.141), CARVAL (r=0.145) and DIFPAR (r=0.115) sub-scales; the GI-T subscale with the INTPUB (r=-0.121), CLINEG (r=-0.186), CDD (r=0.145) and CDC (r=0.387) subscales; and finally, the GI-S subscale, although not significantly related to any subscale, had the strongest association with INTPUB (r=-0.110) (Table 6).
Table 6 Correlation matrix between the UGEQ and the ECRPA and EEA questionnaires
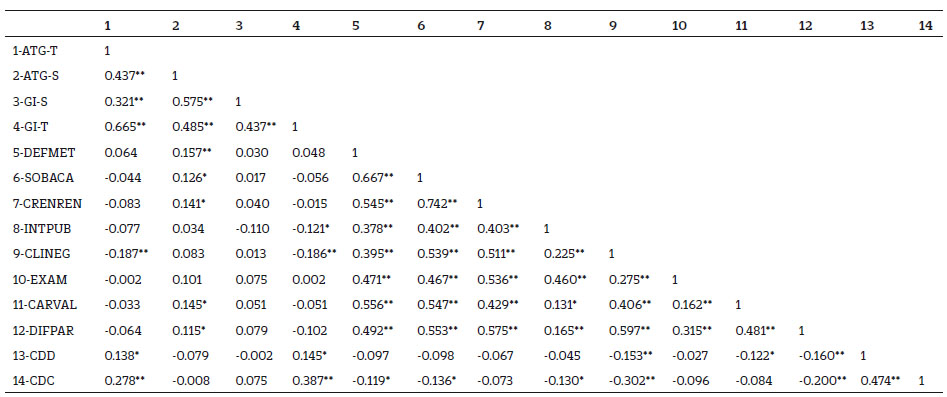
UGEQ subscales (ATG-T: Individual’s perception on personal involvement in group tasks; ATG-S: Individual’s perception of personal involvement in the group on a social level; GI-T: Individual’s sense of group closeness regarding the task; GI-S: Individual’s sense of group closeness on a social level)
ECRPA subscales (CDD: climate created by the teacher; CDC: climate created by the classmates)
EEA subscales (DEFMET: methodological deficiencies of the teaching staff; SOBACA: academic overload of the student; CRENREN: beliefs regarding academic performance; INTPUB: interventions in public; CLINEG: negative social climate; EXAM: exams; CARVAL: lack of content value; DIFPAR: participation difficulties)
**p<0.010; *p<0.050
Discussion
The main purpose of this study was to validate the Spanish version of the "University Group Environment Questionnaire" (UGEQ) scale in a sample of university students. The results obtained confirm the structure of the original questionnaire, with four factors (ATG-T, ATG-S, GI-S and GI-T) in a Spanish population. The adjustment indices obtained and the adjusted invariance models support the tetra-factorial structure. In addition, our results reveal an adequate internal consistency and significant test-retest correlations. Significant associations were found with distinct questionnaires related to the construct under study, demonstrating the instrument’s convergent validity.
The confirmatory factor analysis performed supports the tetra-factorial structure initially proposed by Bosselut et al (2018) based on the model of Carron et al (1985), which was originally developed for the sports setting, but was subsequently applied to numerous other contexts. These findings confirm the original structure in which group cohesion is assessed in the university context based on the following 4 dimensions: Individual’s perception on his/her participation in group tasks; Individual’s perception on his/her participation in the group on a social level; Individual’s feelings regarding how united the group is with regard to the task; Individual’s feelings regarding how united the group is on a social level. The goodness of fit indices obtained in our model [CFI= 0.92; TLI=0.90; SRMR=0.068 and RMSEA= 0.081 (90% CI: 0.071-0.092)] are acceptable according to the previously established criteria (Hu & Bentler, 1999). Moreover, the 4 dimensions of the questionnaire, have an adequate internal consistency. In addition, the results of the test-retest support the instrument’s suitable temporal stability. Although the obtained results regarding the Spanish adaptation of the UGEQ are acceptable and not optimal, it should be considered that it is an initial validation research, and future studies with larger samples and most representative students from different areas of knowledge are needed. In any case, based on the results, the Spanish version of the UGEQ replicates the original structure of the instrument, and could be useful to reliable evaluate group cohesion in the Spanish context.
Given that sex and academic year may have a major impact on the measurement of cohesion in the university context, the invariance models were adjusted for these two variables. The adjustment indices were always higher in the "configural invariance" model. Therefore, it can be assumed that this measure is not biased based on sex or academic school year (initial [1st and 2nd] vs advanced [3rd, 4th and 5th]). However, these results must be interpreted with caution since the adjustment indices were quite similar across all the invariance models. Therefore, sex and academic school year do not seem to have an impact on group cohesion in the Spanish university context from the measurement perspective. Hence, our adaptation could be reliable employed in different academic school years and between genders.
The UGEQ has been found to be an instrument capable of providing information on group dynamics in the university setting. It may also be applied to determine inter-individual synergies in performing an academic task in the classroom setting (satisfaction with the ideas of the other group members, positive perception of the work environment). All of this may help to determine why some students prefer to work alone or are unmotivated by group work (Barr et al., 2005; Urch et al., 2000). In addition, the instrument also assesses behavior, beyond the academic environment, on a social level.
This instrument may help advance our knowledge regarding the concept of group cohesion as a dynamic construct (Carron & Brawley, 2000). Future studies should consider the development of group cohesion during the university trajectory, analyzing whether or not this evolution is linear or fluctuating.
This work has various strengths, including its use of a representative university sample enrolled in distinct degree programs and education levels. Furthermore, data collection was conducted over the second quarter of the school year, to ensure that group relationships had already been established amongst the students. Our results are supported by the original instrument, being replicated in a Spanish population. However, this study has certain limitations. First, all of the participants went to the same university and therefore, were in the same geographic area, potentially reducing the sample’s variability. Therefore, it may be useful to confirm the results with those from other Spanish university publications. On the other hand, given the limited number of instruments available to assess group cohesion, the convergent validity can only be tested using scales that directly assess, not only the analyzed construct, but also, elements related to the same, including academic stress (EEA) or the climate of responsibility perceived in the classroom (ECRPA). In this sense, it has been demonstrated that a better group cohesion is significantly correlated with lower stress (Ha and Jue, 2022; Li et al., 2014; Prapavessis and Carron, 1996; Shiralkar et al., 2013) and positive classroom climate (Haugan et al., 2021; Wang et al., 2020). This factor has a positive role buffering source of academic stress, and hence, higher levels of group cohesion could moderate the negative impact of academic demands on stress and mental health of students; and at the same time, generate a positive classroom climate (Haugan et al., 2021; Wang et al., 2020). Moreover, the use of the CFA has limitations that tend to be overcome by the Exploratory Structural Equation Modeling (ESEM), but at the initial stage of this study, the CFA may be sufficient. ESEM has demonstrated advantages in comparison to CFA, mainly in relation to the restrictive assumptions of CFA, in which each item loads on only one factor (Marsh et al., 2014). Moreover, ESEM approach has shown benefits in several clinical and educational settings when validation and adaptations of questionnaires are developed, mainly in those cases in which the data or the characteristics of the evaluation instrument do not fit with the required criteria for CFA or other classical statistical approaches (Marsh et al., 2014; 2010). Finally, it would be interesting for future studies to examine potential cultural differences arising in the values associated with group cohesion in university students from distinct countries.
We can conclude that the Spanish version of the University Group Environment Questionnaire" (UGEQ) has quality metric guarantees (viability, reliability and validity) for the assessment of group cohesion in Spanish university students. Its factorial structure has been found to be stable across two countries with distinct cultures. The Spanish version of the UGEQ replicates the factorial structure of the original version and obtains suitable goodness of fit indices for the Spanish population. Therefore, we can determine that it is a brief, easy-to-complete self-reporting instrument that is useful for the assessment of group cohesion in a university context. It is also beneficial for the analysis of the main aspects underlying good group cohesion (ATG-T, ATG-S, GI-S and GI-T). Given these characteristics, this questionnaire is considered a viable and useful tool, particularly for higher education professionals and researchers. We believe that this study offers an accurate and effective assessment tool for the development of prevention and intervention programs to improve interpersonal relationships and collaborative work amongst peers in the context of higher education.