


Servicios Personalizados
Revista

Articulo
 texto en
  Inglés (pdf)
 Articulo en XML
 Referencias del artículo
 Enviar articulo por email
Indicadores
-
 Citado por SciELO
Links relacionados
-
 Similares en
SciELO
Similares en
SciELO
Compartir

 Permalink
Revista Peruana de Ginecología y Obstetricia
versión On-line ISSN 2304-5132
Rev. peru. ginecol. obstet. vol.66 no.3 Lima jul-sep 2020
http://dx.doi.org/10.31403/rpgo.v66i2274
Original Articles
Uterine artery pulsatility index reference chart selection between 24 and 40 weeks of gestational age for a health institution in Lima, Peru
1 Fetal Medicine Centre , Lima, Perú
2Clínica Santa Isabel, Lima, Perú
3 Peruvian Health Ministry , Lima, Perú
Uterine artery resistance is assessed to detect inadequate placentation in pregnant women, that increases the risk to develop preeclampsia, intrauterine growth restriction and other complications associated with placental insufficiency. Objective: To identify the uterine arteries pulsatility index (UtAPI) reference chart that best fits our institutional data. Methods: Retrospective, cross-sectional study that evaluated 1 753 single pregnancies; 2 031 UtAPI measurements of the uterine arteries were obtained. Mean UtAPI was compared with the reference charts published by Gomez, Limay and Weichert. Results: There was a mild but significant (r=0.16) negative correlation between UtAPI and gestational age between 24 and 40 weeks of gestation; 6.5%, 7.5% and 15% of our measurements were above the 95 centile of respectively Weichert, Limay and Gomez reference charts. Conclusions: In our population, the UtAPI distribution fitted best with Weichert reference chart. More prospective studies are needed to validate this clinical finding.
Key words: Uterine arteries; Doppler color ultrasonography
Introduction
The uterine artery originates from the anterior trunk of the hypogastric artery (internal iliac artery). It runs 5 cm obliquely down and forward in the lateral pelvic wall, then curves inwards transversely towards the cervix. Two centimeters after reaching the cervix, it curves again (uterine artery arch) and finally directs forward and vertically following the lateral edge of the uterus, emitting a series of branches towards the frontal and posterior aspects of the uterine body (radial arteries). Shortly before the arch, it emits the cervical branches1.
Campbell(2) described the method of identifying blood flow from the uterine arteries at the junction with the iliac arteries and constructed an indicator of S/Vm resistance (peak systolic velocity over average velocity; see Appendix 1), protodiastolic notches and low diastolic velocity. In this study he identified that uterine arteries resistance is higher in patients affected by placental insufficiency.
From then on, parameters used to evaluate flow resistance have been diverse: notches (protodiastolic notch)2,3, resistance index (RI)3-5, systolic-diastolic ratio (S/D)6,7, pulsatility index (PI)(8,9). Until Ochi9, in arterial occlusion experiments in animals, showed that the PI has a greater correlation (r=0.95) with the actual uterine artery resistance than the RI (r=0.85) or the S/D (r=0.90), and that this relationship was linear, unlike the other indices which had a logarithmic relationship.
Other technical aspects involved in estimating resistance are the place where the flow velocity waves are obtained (crossing with the external iliac artery or in the uterine arch)10-12, the via used (transvaginal or abdominal)13 or the parameter recorded (if the measurement on the placental side or the average on both sides was taken into account)14.
The assessment of uterine arteries resistance is still used to identify pregnant women with inadequate placentation and, therefore, at risk of developing second and third trimester adverse events, such as preeclampsia, intrauterine growth restriction (IUGR) and other manifestations of placental insufficiency15-19. It is critical to identify them as high obstetric risk pregnancies. These values should be compared with reference Tables20-23.
A basic analysis of the index reference formula [PI= (S-D) /m] shows that the PI distribution curve of any artery will not have a normal distribution, but will show right-hand asymmetry. For further explanation, see Appendix 1.
The aim of this paper is to compare our measurements in pregnant women with normal pregnancies and outcomes, with the forementioned reference curves, in order to select the most appropriate one for our service.
Methods
This is a study with data obtained prospectively and transversal data analyzed retrospectively. All pregnant women who attended the institution's ultrasound service between January 1, 2013 and March 15, 2020 were offered the evaluation of placental blood flow. Examinations performed on pregnant women over 24 weeks old were included. Multiple pregnancies, fetuses without gestational age confirmed by first trimester ultrasound, abnormal fetuses, fetuses with estimated weight below the 10th percentile, pregnant women with preeclampsia, diabetes or other complications, and fetuses with more than two assessments in that period were excluded. The examinations were performed with General Electric model Voluson E8 BT12 ultrasound equipment, with RAB4-8 or C 1-5 convex volumetric transducer.
Data were recorded in the institution database (Astraia). Both uterine arteries resistance was measured by the abdominal route below the junction with the external iliac artery. The pulsatility index was automatically calculated by the ultrasound equipment software and electronically transferred to the database. The uterine artery pulsatility index (UtAPI) was compared with the reference curves published by Gomez20, Weichert21 and Limay22. The uterine artery PI data were tabulated in Excel by week of gestational age.
The distribution of the number of data by gestational age was tabulated. We made a graph of the average uterine arteries PI distribution, to compare it with the normal curve (per week and over the entire period). Characteristics of this distribution curve were evaluated. A significance level of 5% was chosen. Analysis of variance (ANOVA) was used to compare averages and 95th percentiles of our sample with the reference curves. The 95th percentile was considered to select pregnant women at risk of poor perinatal outcomes (preeclampsia, IUGR, placental abruption, among others). As our population had normal results, values above the 95th percentile were considered false positive. The rate of false positives in our population was compared with the different reference curves (see Appendix 2).
Results
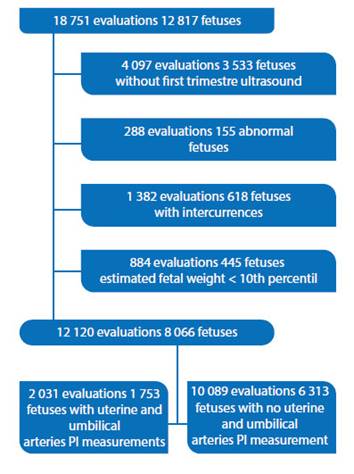
18 751 consecutive ultrasounds were performed in 12 817 singleton pregnancies with 24 weeks gestational age or more. After excluding patients and fetuses according to protocol, there were 12 120 assessments on 8 066 fetuses between 24 and 40 weeks, with a maximum of two assessments per fetus. Among them, 1 753 fetuses had 2 031 evaluations of both the uterine and umbilical arteries resistance, data that is presented (Figure 1). This article will be limited to the presentation of uterine arteries resistance.
1 172 (67%) women were carrying their first pregnancy (average 1.4 pregnancies, counting the current one; maximum 5). Average age of the pregnant women was 33.9 years (18-47.5 years). The correlation between resistance of the uterine artery and the umbilical arteries was weak (r=0.1), but significant.
The distribution of the UtAPI showed right asymmetry (1.9 Fisher coefficient, 6.5 kurtosis), as theoretically expected (Figure 2), with 0.80 average, 0.76 median and 0.77 mode (range 0.34 to 2.62, SD 0.25, IQ 0.649 to 0.895, p 5= 0.515, p 95= 1.22, outliers 1.264). The average UtAPI varied significantly according to gestational age (anova p<0.05). There was a significant negative correlation (p<0.01) but weak correlation of UtAPI with gestational age (r=0.16) between 24 and 40 weeks.
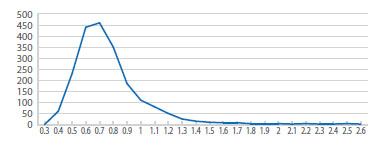
Figure 2 Distribution of the uterine arteries Pulsatility index (utapi) between 14-39 weeks of gestational age.
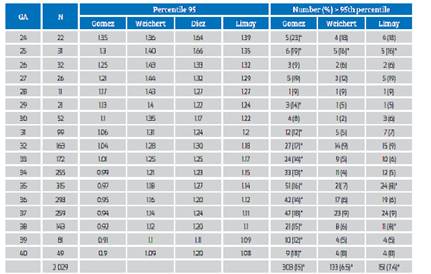
The 5th and 50th percentiles of our population and those of Gómez, Weichert and Limay Tables coincide (p>0.05), but the 95th percentiles are discordant, as can be seen on Figure 3. Table 1 shows that the proportion of cases over the 95th percentile is significantly different to 5% in all weeks of gestational age, when using Gómez’s reference curve.
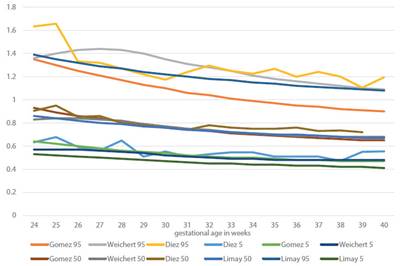
Figure 3 5th, 50th and 95th Percentiles of the uterine arteries reference index in our population, compared to those Published by weichert, gomez and limay.
Discussion
The analysis done is important to select the curve more suiTable to our reality. When using the Gomez curve, 15% of single pregnancies with normal outcome would have been qualified as pregnancies at risk. If the Weichert curve would had been used as reference, 5% of the pregnancies with normal outcomes would have been selected.
The Gomez curve was constructed on the basis of a cross-sectional study that included 20 pregnancies per week of gestational age. The 5th, 50th and 95th percentiles were calculated based on Royston's publication(25.26). However, the measurements were made transvaginally in the first trimester, at the level of the uterine artery arch, and abdominally, one centimeter below the junction with the iliac arteries, after 15 weeks of pregnancy. This information is important because it has been found that the uterine artery resistance is higher at the level of the arch than even 3 cm above it(10.27), and is higher if measured transvaginally rather than abdominally( 26 .
The Weichert curves, on the other hand, were obtained from more than 100 000 measurements in normal clinical practice at three centres, in single pregnancies, and considering only patients with a maximum of 3 measurements, to eliminate those with pathology. Their filter was the Viewpoint database. Therefore, the number of measurements per week of gestational age is not uniform as in Gomez's, but it has peaks of data accumulation in the periods 11 to 13 and 20 to 24 weeks, as well as nadires between 13 to 20 and 24 to 28 weeks. Weichert lists other technical reasons that explain the possible reasons for the discrepancy of his measurements with the published curves, among them, early collaterals appearing in the curve with the highest flow and the angle of insonation.
The design of our study, similar to Weichert's, may explain the similarity of the results. However, they excluded only patients with multiple tests and we excluded pregnant women with preeclampsia, IUGR, complications and fetuses with abnormalities.
Between 2010 and 2016, there were about 100 000 births at the National Maternal Perinatal Institute. Limay22 constructed a curve in lowrisk mothers with healthy fetuses; and excluded small and macrosomic fetuses. It is not very clear how only 7 020 pregnant women were selected. But, he obtained between 24 and 408 uterine artery PI measurements for each gestational age between 11 and 41 weeks, with accumulations in the first and second trimesters (1 800 measurements between 12 and 15 weeks and 2 300 between 19 and 26), similarly to Weichert's study.
What the authors do not mention is their inappropriate statistical analysis. In non-normal distributions such as those of the PI, the central boundary theorem allows conversion to Z-scores or standardization of the curve to estimate the average, but not to estimate the standard deviation. An average close to the population mean can be achieved with a small amount of data per week (20 or 30). However, to estimate a 95th percentile value that truly identifies the top 5% of the population at risk and with an error margin of less than 5% would require at least 384 measurements for each week of gestational age (see Appendix 3). This explains the discrepancies in this estimate between the different authors.
We have yet to demonstrate the clinical utility of selecting Weichert’s curve. To do this it will be necessary to compare the evolution of pregnant
women with UtAPI greater than the 95th percentile of Weichert and Gomez and to do more follow-ups on patients with UtAPI between the 95th percentile of Gomez and the 95th percentile of Weichert (patients in the gray area), to assess whether their maternal-perinatal outcomes are different from those of the population below the 95th percentile of Gomez.
An alternative to this approach is to use the 90th percentile of the UtAPI distribution corresponding to 1.1 between 30+0 and 39+0 weeks instead of the Gomez 95th percentile. The UtAPI distribution between these gestational ages is normal in the range 0.4 to 1.1, with an average of 0.79 (Figure 4). With this protocol, any patient with UtAPI >1.1 after 30 weeks would require further evaluation, and the evaluation of other arteries or additional controls should be considered.
All in all, all services should conduct a quality control of the measurements of Doppler’s fetal and maternal parameters, analyze its results, verify if there is an appropriate reference curve or creating one.
In our study, Weichert’s curve produced the least false positives in our normal population.
REFERENCES
1. Testut L, Latarjet A. Órganos genitales de la mujer. En: Testut L, Latarjet A, Eds. Tratado de Anatomía Humana. Tomo IV Capítulo 3. Novena edición. Barcelona, España: Editorial Salvat. 1954:1171-260. [ Links ]
2. Campbell S. New Doppler technique for assessing uteroplacental blood flow. Lancet. 1983;321(8326):675- 7. doi:10.1016/s0140-6736(83)91970-0 [ Links ]
3. Zimmermann P, Eiriö V, Koskinen J, Kujansuu E, Ranta T. Doppler assessment of the uterine and uteroplacental circulation in the second trimester in pregnancies at high risk for pre-eclampsia and/or intrauterine growth retardation: comparison and correlation between different Doppler parameters. Ultrasound Obstet Gynecol. 1997;9(5):330-8. doi:10.1046/j.1469-0705.1997.09050330.x [ Links ]
4. Pourcelot L. Applications cliniques de l'examen doppler transcutane. In: Peronneaus p, editor. Velocimetrie Ultrasonore Doppler. Paris: Editorial INSERM. 1975;213-40. [ Links ]
5. Kurmanavicius J, Florio I, Wisser J, Hebisch G, Zimmermann R, Müller R, Huch R, Huch A. Reference resistance indices of the umbilical, fetal middle cerebral and uterine arteries at 24-42 weeks of gestation. Ultrasound Obstet Gynecol. 1997 Aug;10(2):112-20. [ Links ]
6. Stuart B, Drumm J, FitzGerald DE, Duignan NM. Fetal blood velocity waveforms in normal pregnancy. BJOG.1980;87(9):780-5. doi:10.1111/j.1471-0528.1980.tb04613.x [ Links ]
7. Trudinger BJ, Giles WB, Cook CM. Uteroplacental blood flow velocity-time waveforms in normal and complicated pregnancy. BJOG. 1985:92(1):39- 45. doi:10.1111/j.1471-0528.1985.tb01046.x [ Links ]
8. Gosling RG, Dunbar G, King DL, Newman Dl, Side CD, Woodcock JP, et al. The quantitative analysis of occlusive peripheral arterial disease by non-intrusive ultrasound technique. Angiology. 1971;22:52-5 [ Links ]
9. Ochi H , Suginami H, Matsubara K, Taniguchi H, Yano J, Matsuura S. Micro-bead embolization of uterine spiral arteries and changes in uterine arterial flow velocity waveforms in the pregnant ewe. Ultrasound Obstet Gynecol. 1995 Oct;6(4):272-6. doi: 10.1046/j.1469-0705.1995.06040272.x [ Links ]
10. ISUOG Practice Guidelines: use of Doppler ultrasonography in obstetrics. Ultrasound Obstet Gynecol. 2013;41(2):233-9. doi:10.1002/uog.12371 [ Links ]
11. Lefebvre J, Demers S, Bujold E, Nicolaides KH, Girard M, Brassard N, Audibert F. Comparison of two different sites of measurement for transabdominal uterine artery Doppler velocimetry at 11-13 weeks. Ultrasound Obstet Gynecol. 2012;40(3):288-92. doi: 10.1002/uog.11137 [ Links ]
12. Ridding G, Schluter PJ, Hyett JA, McLennan AC. Influence of sampling site on uterine artery Doppler indices at 11-13+6 weeks gestation. Fetal Diagn Ther. 2015;37(04):310-5. Doi: 10.1159/000366060 [ Links ]
13. Plasencia W, Barber MA, Alvarez EE, Segura J, Valle L, Garcia-Hernandez JA. Comparative study of transabdominal and transvaginal uterine artery Doppler pulsatility indices at 11-13 + 6 weeks. Hypertension Pregn. 2010;30(4):414-20. doi:10.3109/10641955.2010.506232 [ Links ]
14. Sotiriadis A, Hernandez-Andrade E, da Silva Costa F, Ghi T, Glanc P, Khalil A, Martins WP, Odibo AO, Papageorghiou AT, Salomon LJ, Thilaganathan B. ISUOG Practice Guidelines: role of ultrasound in screening for and follow-up of pre-eclampsia. Ultrasound Obstet Gynecol. 2019 Jan;53(1):722. doi:10.1002/uog.20105 [ Links ]
15. Papageorghiou AT, Yu CK, Bindra R, Pandis G, Nicolaides KH. Multicenter screening for pre-eclampsia and fetal growth restriction by transvaginal uterine artery Doppler at 23 weeks of gestation. Ultrasound Obstet Gynecol 2001;18:441-9. [ Links ]
16. Sciscione AC, Hayes EJ. Uterine artery doppler flow studies in obstetric practice. Am J Obstet Gynecol. 2009;201(2):121- 6. doi: 10.1016/j.ajog.2009.03.027 [ Links ]
17. Cnossen JS, Morris RK, Ter Riet G, Mol BWJ, van der Post JAM, Coomarasamy A, et al. Use of uterine artery Doppler ultrasonography to predict pre-eclampsia and intrauterine growth restriction: a systematic review and bivariable meta-analysis. Canadian Med Assoc J. 2008;178(6):701-11. doi: 10.1503/cmaj.070430 [ Links ]
18. Papageorghiou AT, Yu CK, Nicolaides KH. The role of uterine artery Doppler in predicting adverse pregnancy outcome. Best Pract Res Clin Obstet Gynaecol. 2004;18:383-96. [ Links ]
19. Khong SL, Kane SC, Brennecke SP, da Silva Costa F. First-trimester uterine artery Doppler analysis in the prediction of later pregnancy complications. Dis Markers. 2015;2015:679730. doi: 10.1155/2015/679730 [ Links ]
20. Gomez O, Figueras F, Fernandez S, Bennasar M, Martinez J M, Puerto B, Gratacos E. Reference ranges for uterine artery mean pulsatility index at 11-41 weeks of gestation. Ultrasound Obstet Gynecol. 2008;32:128-32. DOI: 10.1002/uog.5315 [ Links ]
21. Weichert A, Hagen A, Tchirikov M, Fuchs IB, Wolfgang H, Entezami M. Reference curve for the mean uterine artery pulsatility index in singleton pregnancies. Geburtsh Frauenheilk. 2017;77:516-23. [ Links ]
22. Limay Rios O, Laucatta Alarcon K, Ingar Pinedo J, Huertas Tachinno E, Castillo Urquiaga W, Ventura Laveriano W , Zarate Girao M . Rangos referenciales del índice de pulsatilidad de la arteria uterina en fetos sanos. Instituto Nacional Materno Perinatal 2010 a 2016. Rev Peru Investig Matern Perinat. 2017;6(1):30-6. DOI: 10.33421/inmp.201774 [ Links ]
23. Krampl ER, Espinoza-Dorado J, Lees CC, Moscoso G, Bland JM, Campbell S. Maternal uterine artery Doppler studies at high altitude and sea level. Ultrasound Obstet Gynecol. 2001;18(6):578-82. doi:10.1046/j.0960-7692.2001.00579.x [ Links ]
24. Royston P, Wright EM. How to construct 'normal ranges' for fetal variables. Ultrasound Obstet Gynecol. 1998; 11: 30-38. [ Links ]
25. Royston P, Altman DG. Regression using fractional polynomials of continuous covariates: Parsimonious parametric modelling. Applied Statistics. 1994;43(3):429. doi: 10.2307/2986270 [ Links ]
8Cite as: Diez Chang G, Bazán Lossio de Diez MG, Lacunza Paredes R, Elías Estrada JC, Huertas Tacchino E. Uterine artery pulsatility index reference chart selection between 24 and 40 weeks of gestational age, for a health institution in Lima, Peru. Rev Peru Ginecol Obstet. 2020;66(3). DOI: https://doi.org/10.31403/rpgo.v66i2274
Received: May 03, 2020; Accepted: June 15, 2020
 Este es un artículo publicado en acceso abierto bajo una licencia Creative Commons
