


Servicios Personalizados
Revista

Articulo
 texto en
  Inglés (pdf)
 Articulo en XML
 Referencias del artículo
 Enviar articulo por email
Indicadores
-
 Citado por SciELO
Links relacionados
-
 Similares en
SciELO
Similares en
SciELO
Compartir

 Permalink
Revista Peruana de Ginecología y Obstetricia
versión On-line ISSN 2304-5132
Rev. peru. ginecol. obstet. vol.66 no.4 Lima oct-dic 2020
http://dx.doi.org/10.31403/rpgo.v66i2283
Original Articles
Cephalic-abdominal-femoral (C+A-F) index: an effective anthropometric tool to assess fetal growth and its deviations
1
2
 http://orcid.org/0000-0003-4766-7375
3
http://orcid.org/0000-0003-4978-8196
4
http://orcid.org/0000-0002-22118-4852
5
http://orcid.org/0000-0002-6027-87220
1. Professor of Obstetrics, University of Carabobo, Valencia, Venezuela
2. Perinatal Diagnosis Unit, Polyclínic Center Valencia, Venezuela.
3. Obstetrician Gynecologist, Maternal Fetal Medicine, Perinatal Diagnosis Unit, Polyclínic Center Valencia, Venezuela.
4. Obstetrician Gynecologist, University of Tennessee Health Science Center, Memphis, TN, USA.
5. Physician, Assistant Professor of Obstetrics, Universidad de Buenos Aires. Argentina.
6. Physician Obstetrician, Fetal Cardiology, Institute of Cardiology / University Cardiology Foundation, Porto Alegre, RS, Brazil.
7. Physician, University of Tennessee Health Science Center, Memphis, TN, USA.
Background:
Achieving an ideal method to assess the potential for fetal growth is an unfulfilled aspiration in our discipline, and imposes the need for individualized evaluation using new tools and integrated multi-parameters.
Objectives:
To evaluate correlation and to establish cephalic/abdominal/femoral (CAF) index reference values with gestational age (GA) and estimated fetal weight, in order to classify fetal growth evolution as adequate or not adequate for gestational age, and correlation with weight of the newborn at term.
Patients and methods:
1 032 simple and not complicated pregnancies 12 to 38 weeks of gestation were studied at the Polyclinic Center of Valencia, Venezuela, between 2015-2017. Ultrasound measurements and fetal weight were estimated at 3-5 weeks intervals. Studied parameters were head circumference (HC), abdominal circumference (AC) and femur length (FL), integrated in the CAF index = [(HC + AC) - FL] formula. The cubic regression model and Z-score were applied in 256 cases followed up to delivery. Three CAF groups were established: a) CAF <50, b) CAF 50-57, and c) CAF ≥58; the mean ± SD newborn weights were calculated in each group.
Results:
The CAF index revealed an R² = 0.96, p <0.05 for weeks of gestation, and R² = 0.92, p <0.05 for weight. In 256 cases followed up to delivery, when the CAF index was equal or greater than 58, the newborn weight was 3 361 ± 484 g, with statistically significant differences as compared to the other groups (student test p <0.05).
Conclusions:
The CAF index is a multiparametric method that allows to determine by serial evaluations the expected individual growth potential and virtually to identify deviations.
Key words: Fetus; Fetal growth; Fetal weight; Birth weight; Biometry; CAF index
Introduction
The American Journal of Obstetrics and Gynecology (AJOG) devoted a special supplement to the problem of normal fetal growth and its de viations, (volume 218; year 2018), and the one by Kiserud et.al.1 on customized growth charts: justification, validation and clinical benefits, is of greater interest for the present paper. We can see that there is a proliferation of fetal size standards, and both obstetricians and ultrasonographers are faced with several options, none of them exempt from limited probabilities of absolute diagnostic certainty, original source of perinatal damage, action or omission(2 -10).
We must point out that it is evident that the challenge for the future is to replace the classical representation of percentiles by the quantile regression curves, a methodological strategy introduced by Koenker and Bassett in 197811.
These curves deviate from linear regression models whose equations used in the prediction of fetal weight show limitations in terms of certainty12-14, since the variance between class intervals is not homogeneous, which is known as heteroscedasticity, contrary to the homoscedasticity required for the application of linear regression models, in data whose distribution fits the Gaussian curve. The non-uniform behaviour of fetal growth during pregnancy imposes the search and use of diagnostic tools involving covariates15,16; different from the individualized analysis of biometric data, capable of influencing growth beyond genetics17-19, one of the alternatives is to typify values based on the Z-score.
In search for new diagnostic tools for normal fetal growth and its deviations, in 2012 we published20 our first experience with the CAF index, with the aim of finding an unifying and globalizing route from a conceptual point of view, and we designed a tool that integrated in a formula, the three parameters that continue to demonstrate greatest reliability in predicting gestational age and to estimate fetal weight4-6,21. This formula consists of adding the head circumference (HC) to the abdominal circumference (AC) and subtracting the length of the femur (FL) from the product obtained, for each gestational age [(HC + AC) - FL]. In the present paper, we again evaluated the tool based on the curved regression models (cubic model), with distribution of the data to demonstrate the non-linear behaviour of fetal growth evidenced by the heteroscedasticity of the variances for each class interval, correlating the index with gestational age and estimat ed fetal weight, in addition to obtaining the CAF value, which, compared to the known weight in a group of newborns, better fits the extreme values of the proposed tool.
Study design. Material, patients and methods
We studied 1 032 cases of patients with a simple pregnancy, without risk discrimination, using a mixed, prospective and cross-sectional model, accepting the heterogeneity of obstetric patients, but without comorbidities of known impact, on fetal growth and when they were present, they were discarded (20 cases due to preeclampsia, arterial hypertension, malnutrition and diabetes); in all patients it was established as requirements the date of the last known menstruation with precision and an early ultrasound study between 5 and 10 weeks of gestation. The study was carried out in the Perinatal Diagnostic Unit of the Valencia Polyclinic Center. Venezuela, between January 10, 2015 and July 28, 2017. Fetal biometric studies were performed from 12 to 38 weeks, with intervals of 3, 4 and 5 weeks. A minimum of two evaluations were performed during pregnancy, given that the objective of the study was to establish reference ranges, rather than normal values. The parameters studied were head circumference (HC), abdominal circumference (AC) and femur length (FL), which were integrated into the formula CAF = [(HC + AC) - FL]. The anatomical planes for fetal biometry on ultrasound used were: the cranial circumference in the transtalamic axial plane with inclination to the posterior fossa, the abdominal circumference in the axial plane of the abdomen at level of gastric chamber, portal sinus and spine, and the diaphyseal major femoral length on the longitudinal axis, excluding epiphysis (Figure 1).
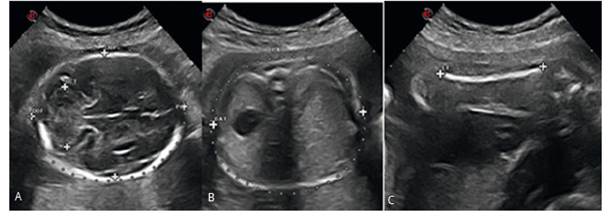
Figure 1 The anatomical planes for ultrasound fetal biometry used were: A. The cranial circumference in the transthalamic axial plane with inclination to the posterior fossa, B. The abdominal circumference in the abdomen axial plane at the level of the gastric chamber, portal sinus and spine, and C. The greater diaphysis of the femoral axis, excluding the epiphysis.
For each class interval, the formula calculated the Z score and its extremes (0 ± 1.65), using the formula: Z score = Current CAF value - Expected CAF value for age, divided by the standard deviation for the expected value. In 256 cases followed until delivery, with CAF obtained 2-3 weeks before delivery, the CAF limits were established in three groups: a) those with a CAF value less than 50, b) those with a CAF value between 50 and 57, and c) those with CAF value equal to or greater to 58, calculating the values of central tendency and weight in each group. The data obtained were subjected to statistical study by the SPSS 8.0 program, and the DeVore calculator(22) that provides the percentage of subjects in the control group who are below or above the predefined percentiles of fetal weight in the study group or vice versa. The results obtained are presented in special purpose tables and graphics.
Results
The distribution of the data did not fit the normal Gaussian curve, since the one obtained is asymmetric with bias, kurtosis, QQ graphs and statistically different variances, the ANOVA test revealed high values of F in the data distributions, with a meaning of <0.005. Using the least squares method, the cubic type curve correlation model was applied and the calculations for each class interval were made using the Z score (Z score = expected C AF - observed C AF / standard deviation). Limits of 0 ± 1.65 were adopted.
The observed data curve and the cubic model of the CAF index according to the weeks of gestation (R² = 0.96 p <0.005) are shown in Figure 2.
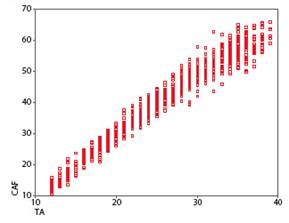
Figure 2 Fetal CAF index scatter plot calculated from the cases studied in 2-week intervals, from 12 to 38 weeks. Curve estimation with the R squared cubic model = 0.966, p <0.005, skewness = -0.259, kurtosis = -0.898, Anova = 1051.2 sig 0.000, Levene’s test (homogeneity of variances) = 4.054 sig 0.000.
The CAF index for each gestational age (12-39 weeks) according to the gestational age in weeks, according to the Z score and according to the condition of adequate for gestational age (AGA), small (SGA) and large (LGA) is shown in Figure 3.
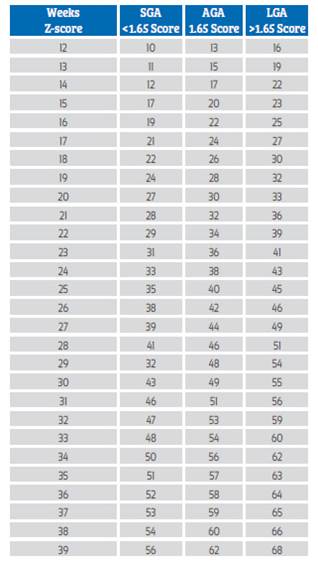
Figure 3 CAF index values table according to gestational age in weeks expressed in Z-score 0 ± 1.65. AGA: Adequate for gestational age, SGA: Small for gestational age, and LGA : Large for gestational age.
The fetal weight curve calculated according to Hadlock´s formula was compared with the CAF values distributed at 2-week intervals from 12 to 38 weeks, obtaining R² = 0.97 p <0.005 and is shown in Figure 4.
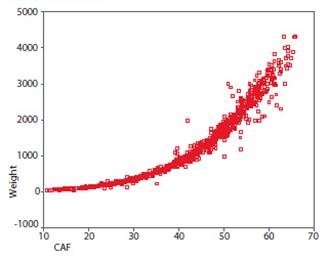
Figure 4 Fetal weigh scatter plot according to the CAF index. R square regression model cubic curve = 0, 97, p <0.005, skewness = 0.770, kurtosis = -0.401, Anova F = 636.96 sig 0.000, homogeneity of variances Levene statistical test = 31.607 sig. 0.000.
In 256 cases followed up to delivery, with CAF obtained 2-3 weeks before delivery, CAF was established in those with values below 50 (CAF <50, Group 1), those located between 50 and 57 (CAF 50 - 57, Group 2), and those equal to or greater than 58 (CAF ≥58, Group 3), calculating the central tendency and weight values of the newborns in each group. The differences between the mean and standard deviation values were demonstrated to be statistically significant, with the student test, t = 6,445 p <0.05 and 2-3 t = 5,925 p <0.05, between groups 1 and 3, and 2 and 3 (Figure 5).
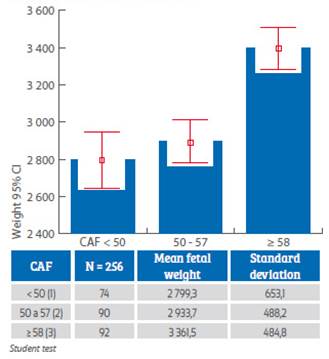
Figure 5 Weight distribution of 256 newborns (median ± SD) grouped according to CAF index values <50, 50-70, and ≥58. Statistically significant differences were observed with the student’s t test (Gosset) between groups 1 and 3 (-6.445 p <0.005), and 2 and 3 (-5.925 p <0.005). The De Vore test revealed that only 1% and 22% of group 3 weights coincided with group 2 upper limit values (p95).
The percentage of cases located outside of extreme values between the study group and the control group, calculated with the De Vore test, revealed that 1% and 22% of the values were below -1.65 z score or above 1.65 z score of the control group, thus demonstrating the statistical importance of the relationship between CAF values ≥ 58 and the weight of the newborn of 3 361 ± 484 g.
Discussion
No evidence has been presented to date to suggest that Intergrowth 21 improves the identification of fetuses with an increased risk of adverse outcomes and that published predictive formulas offer absolute certainty. Romero and Tarca12) present six graphs that summarize the growth curves of the different papers contained in the volume of the mentioned journal. In these we can see how the estimation of fetal weight presents a non-linear trend with a very narrow initial part that shows the low dispersion of values around the average between 18-28 weeks. From that moment we can observe an opening in the range of these curves, which means that the dispersion of the values around the median begins to be much wider. This same behaviour can be observed in the CAF index.
It should be absolutely clear that it is one thing to classify a fetus according to position percentiles, using linear regression curves, which as-sume that fetal growth is uniform, and another thing to use cubic or quadratic model regression curves, to locate it by means of conditioned percentiles, in Z score or in quantiles, adjusting to the quantile regression11,23, in which the objective is to minimize a sum of absolute errors weighted with asymmetric weights, allowing to make inferences about conditional functions, characterized by heteroscedasticity of the variance of the parameters, in the different class intervals. The concept of universal standard24 has also been questioned from the perspective of the origins of fetal development and adaptation, because many biological and cultural factors can influence (covariates) fetal growth, which should not be seen as abnormal, but with non-uniform behaviour. Achieving consensus on which standard or tool is most appropriate for clinical use, requires assessment of predictive performance with respect to clinically relevant outcomes. In their paper Bhatti et.al25 offer a spreadsheet and the corresponding software package to cover 6 fetal growth standards, in order to stimulate research on their reproducibility and diagnostic efficiency. Our goal is the same, but through the CAF index.
What is clear is that the optimal parameters in the estimation of fetal weight are: head circumference, abdominal circumference and femur length3-5 and that the alternative of using customized fetal weight standards and percentiles to maternal characteristics, it could lead to stronger associations with adverse perinatal outcomes26. It should not be forgotten that, despite the controversy, the cohort enrolled in the Intergrowth-21st standards remained healthy, with adequate growth and motor development up to 2 years of age, which would support, according to the authors, their suitability for the construction of international standards for premature fetal growth and postnatal development27.
The studies published in the AJOG allow us to infer that tables based on "classical" percentiles with curves adjusted to the Gaussian norm, and with pretensions of universal acceptance will become part of history, and that for greater diagnostic accuracy of fetal growth and its deviations, we must try to devise new tools that facilitate the work of the fetal clinician.
Conclusions
Having a method that evaluates the potential for fetal growth is an unmet need in our discipline, and imposes the need for an individualized assessment of growth, through integrated multi-parameters. The CAF index is a method that establishes criteria for a set of anatomical parameters, incorporated into a practical formula, which allows, through serial evaluations, to determine the expected individual growth potential (each individual is his own control) and potentially identify the growth pathology as deviations from these criteria. The deviation of the distance between the current value and the expected value, allows locating in a first approximation if the multi-parametric biometry, deviates or not from the expected, for the time in which the study is carried out, and in successive measurements will allow to know the behaviour of these integrated parameters as a function of time (speed of CAF index).
The biggest advantage of CAF index is that it avoids the fetal weight prediction or calculation based on the equations most frequently used for this purpose and whose margins of error vary, this means, it replaces "weight estimation" by "growth types" in : adequate (AGA), small (SGA) or large (LGA) for each gestational age, terms that in addition , are much more understandable for the patient, and which permits to reduce the anxiety generated by the report of location inpercentiles or weight expressed in grams.
The diagnostic capability of the tool in a single moment of pregnancy would not have the expected diagnostic sensitivity for growth deviations, therefore, we recommend obtaining two separate indices, for an interval of "n" weeks, to calculate fetal growth rate. In addition to having a more precise gestational age, it is essential to know the parents' history (birth weight), maternal weight gain, risk factors, etc., in order to monitor CAF in 3 or 4 weeks, and at 37 or more, to establish its values and correlate them with the weight of the newborns. The diagnostic capacity for growth deviations (SGA and LGA), will be the reason for the next communication, since the data accumulated so far, allow us to formulate the hypothesis that the CAF index could be useful for an adequate management of cases with growth deviations, through the use of complementary methods such as the relationship between cerebellum/abdominal ellipses, and fetal-placental hemodynamic profile by Doppler flow measurements.
It is expected that the proposed tool will facilitate reproducible research in the field of fetal growth assessment, and allow a rapid assessment of the adequacy or otherwise of the fetal growth curve, including the calculation of fetal growth velocity as a function of CAF index, when more than two assessments have been performed in a period of time, as proposed, using other criteria, Grantz et al.28.
REFERENCES
1. Kiserud T, Benachi A, Hecher K, Perez RG, Carvalho J, Piaggio G, Platt LD. The World Health Organization fetal growth charts: concept, findings, interpretation, and application. Am J Obstet Gynecol. 2018 Feb;218(2S):S619-S629. doi: 10.1016/j.ajog. 2017.12.010 [ Links ]
2. Capmas P, Salomon LJ, Picone O, Fuchs F, Frydman R, Senat MV. Using Z-scores to compare biometry data obtained during prenatal ultrasound screening by midwives and physicians. Prenat Diagn. 2010 Jan;30(1):40-2. doi: 10.1002/pd.2417 [ Links ]
3. Chitty LS, Altman DG, Henderson A, Campbell S. Charts of fetal size: 2. Head measurements. Br J Obstet Gynaecol. 1994;101:35-43. PMID: 8297866 [ Links ]
4. Chitty LS, Altman DG, Henderson A, Campbell S. Charts of fetal size: 3. Abdominal measurements. Br J Obstet Gynaecol. 1994;101:125-31. [ Links ]
5. Chitty LS, Altman DG, Henderson A, Campbell S. Charts of fetal size: 4. Femur length. Br J Obstet Gynaecol. 1994;101:132-5. [ Links ]
6. Deter RL, Lee W, Yeo L, Erez O, Ramamurthy U, Naik M, Romero R. Individualized growth assessment: conceptual framework and practical implementation for the evaluation of fetal growth and neonatal growth outcome. Am J Obstet Gynecol. 2018 Feb;218(2S):S656-S678. doi: 10.1016/j.ajog.2017.12.210 [ Links ]
7. Francis A, Hugh O, Gardosi J. Customized vs INTERGROWTH- 21st standards for the assessment of birthweight and stillbirth risk at term. Am J Obstet Gynecol. 2018 Feb; 218(2S):S692-S699. doi: 10.1016/j.ajog.2017.12.013 [ Links ]
8. Gardosi J, Francis A, Turner S, Williams M. Customized growth charts: rationale, validation and clinical benefits. Am J Obstet Gynecol. 2018 Feb;218(2S):S609-S618. doi: 10.1016/j.ajog.2017.12.011 [ Links ]
9. Hiersch L, Melamed N. Fetal growth velocity and body proportion in the assessment of growth. Am J Obstet Gynecol. 2018 Feb;218(2S):S700-S711.e1. doi: 10.1016/j.ajog.2017.12.014 [ Links ]
10. Hoopmann M, Kagan KO, Sauter A, Abele H, Wagner P. Comparison of errors of 35 weight estimation formulae in a standard collective. Geburtshilfe und Frauenheilkunde. 2016 Nov;76(11):1172-9. doi:10.1055/s-0042-118598 [ Links ]
11. Koenker R, Bassett G. Regression quantiles. Econométrica. 1978 Jan;46(1):33-50. [ Links ]
12. Romero R, Tarca AL. Fetal size standards to diagnose a small- or a large-for-gestational-age fetus. Am J Obstet Gynecol. 2018;218(2S):S605-S607. doi:10.1016/j.ajog.2017.12.217 [ Links ]
13. Romero R, Kingdom J, Deter R, Lee W, Vintzileos A. Fetal growth: Evaluation and management. Am J Obstet Gynecol. 2018;218(2S):S608. doi:10.1016/j.ajog.2018.01.010 [ Links ]
14. Salomon LJ, Bernard JP, Ville Y. Estimation of fetal weight: reference range at 20-36 weeks' gestation and comparison with actual birth-weight reference range. Ultrasound Obstet Gynecol. 2007 May;29(5):550-5. DOI: 10.1002/uog.401921 [ Links ]
15. Sarris I, Ioannou C, Chamberlain P, Ohuma E, Roseman F, Hoch L, Altman DG, Papageorghiou AT. Intra- and interobserver variability in fetal ultrasound measurements International Fetal and Newborn Growth Consortium for the 21st Century (INTERGROWTH-21st). Ultrasound Obstet Gynecol. 2012 Mar;39(3):266-73. doi: 10.1002/uog.10082 [ Links ]
16. Sarris I, Ioannou C, Dighe M, Mitidieri A, Oberto M, Qingqing W, Shah J, Sohoni S, Al Zidjali W, Hoch L, Altman DG, Papageorghiou AT. Standardization of fetal ultrasound biometry measurements: improving the quality and consistency of measurements. International Fetal and Newborn Growth Consortium for the 21st Century. Ultrasound Obstet Gynecol. 2011 Dec;38(6):681-7. doi: 10.1002/uog.8997 [ Links ]
17. Owen P, Ogston S. Conditional centiles for the quantification of fetal growth. Ultrasound Obstet Gynecol. 1998;11:110-7. DOI: 10.1046/j.1469-0705.1998.11020110.x [ Links ]
18. Salomon LJ, Bernard JP, Duyme M, Buvat I, Ville Y. The impact of choice of reference charts and equations on the assessment of fetal biometry. Ultrasound Obstet Gynecol. 2005;25:559-65. DOI: 10.1002/uog.1901 [ Links ]
19. Sananes N, Guigue V, Kohler M, Bouffet N, Cancellier M, Hornecker F, Hunsinger MC, Kohler A, Mager C, Neumann M, Schmerber E, Tanghe M, Nisand I, Favre R. Use of Z-scores to select a fetal biometric reference curve. Ultrasound Obstet Gynecol. 2009 Oct;34(4):404-9. [ Links ]
20. Álvarez Moya E, Sosa Olavarría A. Índice CAF nueva herramienta para evaluar el crecimiento fetal y sus desviaciones. Ultrasonografía y Clínica Embrio-Fetal. 2012;6:40-8. [ Links ]
21. Altman DG, Chitty LS. Charts of fetal size: 1. Methodology. Br J Obstet Gynaecol. 1994;101:29-34. [ Links ]
22. DeVore GR, Cuneo BF, Satou G, Sklansky M. How to determine the percentage of study subjects <5th or> 95th centile using the control group when only the mean and standard deviation are provided. Ultrasound Obstet Gynecol. 2019;54(1):139-41. doi: 10.1002/uog.20110 (Appendix S1 Calculator for determining percentage of study group with values <5th or >95th centile using mean and SD of study and control groups. uog20110-sup-0001-AppendixS1.xlsx) [ Links ]
23. Karlsen HO, Johnsen SL, Rasmussen S, Kiserud T. Prediction of adverse perinatal outcome of small-for-gestational-age pregnancy using size centiles and conditional growth centiles. Ultrasound Obstet Gynecol. 2016;48:217-23 doi: 10.1002/uog.15835 [ Links ]
24. World Health Organization (WHO). Physical status: The use and interpretation of anthropometry. WHO Technical Report Series number 854. WHO: Geneva, 1995. [ Links ]
25. Bhatti G, Romero R, Cherukuri K, Yeo L, Kavdia M, Tarca AL. Fetal growth percentile software: a tool to calculate estimated fetal weight percentiles for 6 standards. Am J Obstet Gynecol. 2020;222(6):625-8. doi:10.1016/j.ajog.2020.02.006 [ Links ]
26. Sovio U, Smith GCS. The effect of customization and use of a fetal growth standard on the association between birthweight percentile and adverse perinatal outcome. Am J Obstet Gynecol. 2018;218(2S):S738-S744. doi:10.1016/j.ajog.2017.11.563 [ Links ]
27. Villar J, Cheikh Ismail L, Staines Urias E, Giuliani F, Ohuma DPhil EO, Victora CG, et al. The satisfactory growth and development at 2 years of age of the INTERGROWTH-21st Fetal Growth Standards cohort support its appropriateness for constructing international standards. Am J Obstet Gynecol. 2018;218(2S):S841-S854.e2. doi:10.1016/j.ajog.2017.11.564 [ Links ]
28. Grantz KL, Kim S, Grobman WA, Newman R, Owen J, Skupski D, et al. Fetal growth velocity: the NICHD fetal growth studies. Am J Obstet Gynecol. 2018;219(3):285.e1-285.e36. doi:10.1016/j.ajog.2018.05.016 [ Links ]
Received: September 08, 2020; Accepted: September 24, 2020
 Este es un artículo publicado en acceso abierto bajo una licencia Creative Commons
