


Servicios Personalizados
Revista

Articulo
 texto en
  Inglés (pdf)
 Articulo en XML
 Referencias del artículo
 Enviar articulo por email
Indicadores
-
 Citado por SciELO
Links relacionados
-
 Similares en
SciELO
Similares en
SciELO
Compartir

 Permalink
Revista Peruana de Ginecología y Obstetricia
versión On-line ISSN 2304-5132
Rev. peru. ginecol. obstet. vol.67 no.1 Lima ene./mar 2021
http://dx.doi.org/10.31403/rpgo.v67i2300
Original Articles
Umbilical artery pulsatility index reference chart selection

1. Gynecologist and Obstetrician, Fetal Medicine Center, Clínica Santa Isabel, Lima, Peru
2. Gynecologist and Obstetrician, Fetal Medicine Center, Ministerio de Salud, Peru
3. Gynecologist and Obstetrician, Fetal Medicine Center, Lima, Peru
Umbilical arteries (UA) resistance is assessed to detect growth restriction due to an inadequate placentation in small infants at risk of perinatal death and longterm incapacity. The umbilical artery pulsatility index (UA PI) must be compared with a statistically selected reference chart.
Objective:
To identify the pulsatility index (PI) reference curve whose critical value best matches our population data.
Methods:
The cohort was described in a previous study of 1 753 fetuses with 2 031 measurements of the PI of the uterine arteries and umbilical arteries with normal maternal-perinatal outcome.
Results:
PI UA had a significant negative correlation (r= -0.42) with gestational age (GA). The 95th percentile of our patients was significantly different from those published by Arduini, Acharya, Ciobanu, Baschat and Limay.
Conclusion:
The umbilical artery pulsatility index figures obtained conform better to Parra’s reference curves.
Key words: Umbilical arteries; Doppler color ultrasonography
Introduction
Measurement of umbilical artery (UA) resistance is used to evaluate small for gestational age fetuses due to inadequate placentation1. The assessment of UA resistance has a qualitative component (the diastolic flow) that can be anterograde, reverse (retrograde) or absent [1] and a quantitative part (estimation of resistance) obtained by parameters2-15, among them, the pulsatility index (UA PI)2-8.
UA PI is affected by fetal respiratory movements, fetal heart rate, fetal body movements, cord compression, maternal position, gestational age (GA), sampling site, among others.
IP AU measured in different portions of the umbilical artery has been reported to differ. The 'free loop' and placental end are similar, but the
fetal and intra-abdominal end are higher. That is why the UA PI measurement should be compared with the correct reference chart.
To select the best reference chart for our service, we compared our IP AU measurements in women with normal maternal and perinatal out-comes with the published ones.
Methods
This is a retrospective cross-sectional study. Data was prospectively collected from patients referred for prenatal care at the institution and analyzed retrospectively. The cohort was described in a previous publication [16]. Data were obtained from all pregnant women with at least 24 weeks gestational age (GA) confirmed by a first trimester ultrasound. Pregnant women with preeclampsia, diabetes, multiple pregnancy, abnormal and small for GA (SGA) fetuses, as welln as pregnancies with more than two ultrasound evaluations were excluded.
The age and parity of the mothers were recorded as demographic data. Resistance mas measured in both uterine arteries below the junction with the external iliac, via the abdominal route. The resistance of one of the umbilical arteries (UA PI) was measured in a free loop portion. The measurement had to have at least 3 identical waves in a period without fetal respiration. The measurements were transferred electronically to the institution’s database.
The Excel program (Microsoft ®) was used to perform the statistical evaluation and graph design. First, the normality of the UA PI distribution was assessed. The UA PI data were tabulated by week of gestational age. The mean UA PI of each gestational week was compared to see if they were significantly different (ANOVA, Snedecor's F). Using the least squares method, PI AU regressions were performed, and the 95th percentile for each week of GA was obtained. The residual curves were visually evaluated to identify biases. Pearson's correlation coefficient and coefficient of determination were measured to measure the strength of the association of UA PI with UtA PI and with gestational age. A significance level of 5% was used.
The 95th percentile of the PI AU was compared with the reference curves published by Arduini, Acharya, Parra, Ciobanu, Baschat and Limay. As our population had normal results, the percentage of values above the 95th percentile represent the false positive rate obtained with each curve. The false positive rate obtained by comparing the measurements of our population with the different curves was compared.
Results
The cohort of 1 753 fetuses with 2 031 measurements of UA PI and PI of the uterine arteries (UtA PI) has been described in a previous work (16). The distribution of the number of measurements in relation to gestational age is shown in Table 1 and Figure 1.
Table 1 95th percentile of the umbilical artery pulsatility index of different authors and percentage of false positives when using it in our population.
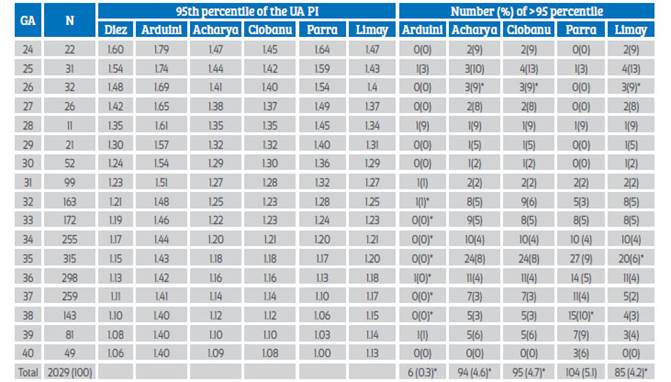
*p<0.05. GA=gestational age. N=number of measurements.
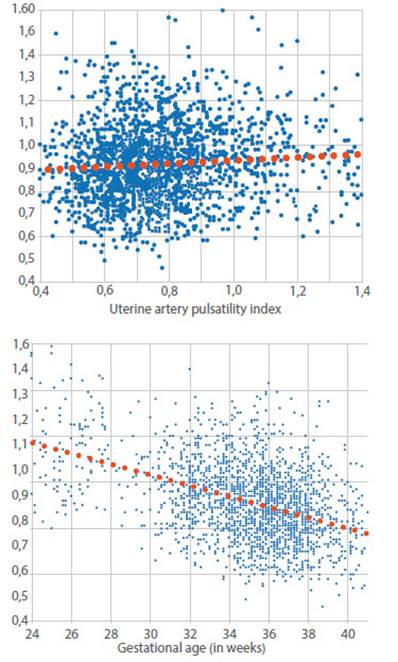
Figure 1 Dot plot and linear relationship between umbilical and uterine artery pulsatility index and between umbilical artery pulsatility index and gestational age.
The correlation of uterine and umbilical artery IP was weak (graph 1), but significant (r=0.10, p<0.05), implying that the variation in uterine artery resistance only explains 1% of the variation in umbilical artery resistance between 24 and 40 weeks. A significant negative correlation of UA PI with gestational age was appreciated (r=-0.42; p<0.05) (Graph 1). The coefficient of determination r2 tells us that gestational age explains 18% of the variation in umbilical artery resistance between 24 and 40 weeks.
The best regression was with a straight line in which the UA PI decreases 2% each week: UA PI A U = - 0.023EG + 1.7225; ( where E G i s g estational age in weeks; R² = 0.18; graph 1). Graph 2 compares the distribution of the UA (regression curve and the 5th and 95th percentiles) with other published studies3-8).
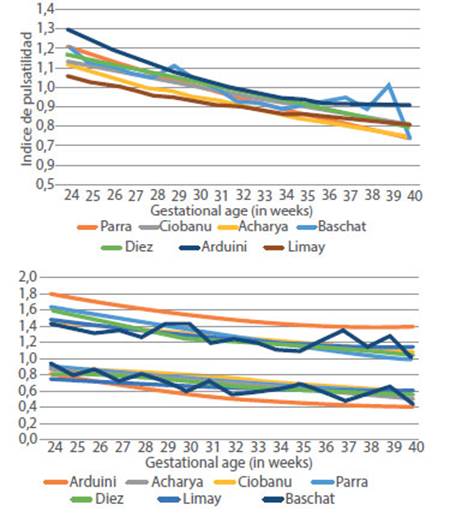
Figure 2 Comparison of the 50th, 5th and 95th percentiles of the AU PI between 24 and 40 weeks with different publications.
Graph 3 shows the distribution of the UA PI (mean 0.92, median 0.91 and mode 0.87; range 0.46 to 2.19, SD 0.18, IQ 0.649 to 0.895, p5= 0.515, p95= 1.22), which has lower right skewness (0.8 vs 1.9) and lower kurtosis (2.8 vs 6.3) than the UtA PI. The UA PI curve is shifted to the right in relation to UtA PI.
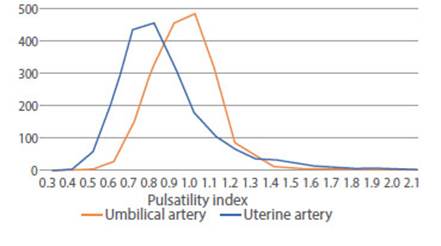
Figure 3 Distribution of the number of cases of umbilical and uterine artery pulsatility index between 24 and 39 weeks.
Table 1 shows the number and percentage of false positives. The rate of false positives (FPR) in our population was significantly different at 5% when using the Arduini, Acharya, Ciobanu, Limay and Baschat charts; with Arduini, specifically between 32 and 39 weeks, and with Baschat, between 34 and 38 weeks. Graph 2 clearly shows the discrepancy of the 5th and 95th percentiles between the Arduini curve and the others.
Discussion
From Arduini's publication3 to Ciobanu's5, 30 years have passed, during which, thanks to technological developments, the quality of obstetric ultrasound images has improved, a fact that may have influenced the results. There are also notable differences in the methodology, the number of patients and the way in which they were selected to construct the reference curves.
In the first study of the Fetal Medicine Foundation (FMF), Mauro Parra6 evaluated 172 pregnant women referred for growth assessment in the third trimester. Unlike the Ciobanu study, it was done in a population with normal perinatal maternal outcome. Gestational age was established based on the date of last menstrual period (LMP) and confirmed by crown buttock length (CLL). It excluded cases of chromosomal abnormalities and malformations. It also did not include patients with preeclampsia, insulin-dependent diabetes, pregnant women taking antihypertensive drugs or fetuses with abdominal circumference below the 5th percentile. Further more, it only included the first of the measures. Its reference ranges were established based on weekly intervals, and it normalized the measurements based on estimated fetal weight (EFW), excluding the measurements of fetuses whose EFW was above or below 1.5 SD. The reference interval was defined as mean+/-1.645 SD. Their population was even younger (29+/- 5.6 years). The mean was described by the formula UA PI = ^(-0,0134*EG+0,405), where EG is gestational age in weeks. This is the curve that has the best correspondence with our normal population.
The Anca Ciobanu reference curve5 (also from the FMF) was obtained to evaluate the effect of prevalent diseases and maternal conditions, so it includes patients with preeclampsia, suspected IUGR or diabetes mellitus, but only incorporates the last evaluation of each patient. Gestational age was estimated on the basis of chorionic buttock length measured in the first trimester and data were tabulated on the basis of one-day periods. Medians were obtained with a regression curve assuming a log-normal distribution. Standard deviations were also log-transformed and then fitted with quadratic regression. It recorded more than 72 000 observations, 67 000 of them between 31 and 36 weeks. It was a multicenter study with more than 500 sonographers involved. Their patients were younger than ours (23 to 38.2 years vs. 28.4 to 39.2 years). They emphasize that this is not a normality curve, but a reference curve to identify the effect of maternal characteristics on PI. The origin of the discrepancy with their tables could be that our population had normal results, whose gestational age was established by LMP and confirmed with LCN, but it could also be originated in the way they tabulated their data (daily instead of weekly, like the others).
The Acharya studies2, from the Kiserud group, were published in 2005. They had a longitudinal design in 130 pregnant women recruited specifically for the study, who underwent ultrasound scans every 4 weeks (longitudinal model). Gestational age was confirmed by ultrasound before 20 weeks, and they had no complications prior to recruitment. Smokers and pregnant women with a history of preeclampsia, placental abruption, growth restriction, preterm delivery, as well as maternal diseases, fetal malformations or multiple pregnancies were excluded. Used a sample size of 10 to 12 mm (far from the current standard of 2 mm).
Baschat4 elaborated his table based on normal fetuses referred between 20 and 40 weeks for growth assessment, with gestational age estimated by LMP and confirmed by ultrasound before 20 weeks and uterine artery resistance within the normal range. He collected 306 patients, with an intraobserver variability of 5%. He found a significant relationship of resistance with gestational age (r2=0.40), represented by the linear regression IP AU=-0.0246*EG+1.779. Our data agree with those of Baschat in the shape of the average PI curve (linear with a slope of 0.02) and the correlation of 0.4. However, the reference curve he presents assumes a normal distribution of the PI, so their critical values differ.
Arduini3 worked with fetuses referred for ultrasound, with age confirmed by LCN or biparietal diameter (BPD). The patients were younger than ours (29 years versus 33.4 years) and of higher parity. The PI calculation was performed manually (it was not yet automatic by the equipment). The distribution of the number of measurements by gestational age in their sample was contrary to those of the other studies, with a peak of patients between 26 and 30 weeks (which coincides with the nadir of the others). He mentions that the inter- and in-tra-observer measurement variation was less than 14%. The best correlation he finds for the mean is quadratic polynomial: IP AU = 3.653-0.163xEG+0.02xEG2 (EG=gestational age). The variation in interobserver measurements could partially explain the discrepancy with our values.
Shortly thereafter, Limay8 published a large national effort to establish a reference curve. He mentions that he used 2 613 umbilical artery PI measurements between 2013 and 2018, but it is not clear how he selected the patients used in the study or how many measurements were made on each patient. He extended the curve period from 14 to 40 weeks, with at least 42 cases per week. He excluded IUGR, macrosomics, those with incomplete data, and high-risk pregnant women with comorbidities and abnormal fetuses. He constructed his reference curve based on a logarithmic transformation and third-degree exponential regression (methodology similar to that used by Acharya).
The objective of our study was to identify the curve whose critical value (95th percentile) selects 5% of the normal pregnant women in our institution. Based on the statistical difference with the curves presented, our results justify the selection of the Parra curve, which is the only one that does not present significant differences with our data.
A second contribution of our study is the evaluation of the distribution of the UA PI; at any gestational age it presents an evident deviation from normality. The right asymmetry originated by its calculation formula causes great dispersion of the high values of resistance, causing the need for logarithmic transformation to generate a normal distribution curve. This is the reason why a larger sample - more than 300 measurements per week - is necessary to construct a curve with the true 95th percentile.
When it is necessary to measure umbilical artery resistance at the fetal pole or placental pole, specific curves such as those published by Acharya2 or Sonesson10 should be used.
During the evaluation of this article, Ruiz Martínez17 published a similar study comparing the 95th percentile of the UA PI of 19 different publications, finding variation between 20 and 40% of this critical value among them, throughout pregnancy.
We must recognize the limitations of our study. The first is the lack of long-term follow-up, since we only used normal perinatal outcomes. The second is the non-uniform size of measurements by gestational age (which most cross-sectional studies suffer from). To construct the reference tables properly will require pooling around at least 300 weekly measurements between 24 and 41 weeks and having the perinatal results of all of them. Measure resistance at the fetal abdomen (useful for double pregnancies), at the free loop and at the cord insertion. In addition, it will be important to rule out if the measurement is similar with different transducers or brands of equipment, a multicenter study in the country with subsequent prospective evaluation.
In conclusion, the reference curve for the pulsatility index of the umbilical arteries between 24 and 40 weeks of gestation that best fits our population is that of Parra. Larger prospective studies in a normal population and in small fetuses are required to demonstrate the usefulness of the selected curve
REFERENCES
1. The GRIT Study Group. A randomised trial of timed delivery for the compromised preterm fetus: short term outcomes and Bayesian interpretation. Br J Obstet Gynaecol. 2003;.110:.27-32. doi: 10.1016/s1470-0328(02)02514-4 [ Links ]
2. Acharya G, Wilsgaard T, Berntsen GK, Maltau JM, Kiserud T. Reference ranges for serial measurements of blood velocity and pulsatility index at the intra-abdominal portion, and fetal and placental ends of the umbilical artery. Ultrasound Obstet Gynecol. 2005 Aug;26(2):162-9. doi: 10.1016/j.ajog.2004.09.019 [ Links ]
3. Arduini D, Rizzo G. Normal values of pulsatility index from fetal vessels: a cross sectional study on 1556 healthy fetuses. J Perinat Med. 1990;18:165-72. doi: 10.1515/jpme.1990.18.3.165 [ Links ]
4. Baschat AA, Gembruch U. The cerebroplacental Doppler ratio revisited. Ultrasound Obstet Gynecol. 2003 Feb;21(2):124-7. DOI: 10.1002/uog.20 [ Links ]
5. Ciobanu A, Wright A, Syngelaki A, Wright D, Akolekar R, Nicolaides KH. Fetal Medicine Foundation reference ranges for umbilical artery and middle cerebral artery pulsatility index and cerebroplacental ratio. Ultrasound Obstet Gynecol. 2019;53(4):465-72. doi: 10.1002/uog.20157 [ Links ]
6. Parra-Cordero M, Lees C, Missfelder-Lobos H, Seed P, Harris C. Fetal arterial and venous Doppler pulsatility index and time averaged velocity ranges. Prenat Diagn. 2007;27:1251-7. DOI: 10.1002/pd.1868 [ Links ]
7. Acharya G, Wilsgaard T, Berntsen GK, Maltau JM, Kiserud T. Reference ranges for serial measurements of umbilical artery Doppler indices in the second half of pregnancy. Am J Obstet Gynecol. 2005 Mar;192(3):937-44. DOI: 10.1016/j.ajog.2004.09.019 [ Links ]
8. Limay Ríos A, Espínola-Sánchez, M, Huertas-Tacchino E, Castillo Urquiaga W, Ventura Laveriano W, Ingar Pinedo J, et al. Referential intervals of the pulsatility index of fetal umbilical artery in Peruvian population. Prog Obstet Ginecol. 2020;63(1):17-22. [ Links ]
9. Castillo-Urquiaga W, Ventura-Laveriano W, Limay-Ríos OA, Zárate-Girao M, Sugajara-Rosario R, Ingar-Pinedo J, et al. Tabla de referencia para la evaluación Doppler de la arteria umbilical. Rev Peru Investig Materno Perinat. 2018;7(1):68-75. [ Links ]
10. Sonesson, SE, Fouron JC, Drblik SP, Tawile C., Lessard M, Skoll A, et al. Reference values for Doppler velocimetric indices from the fetal and placental ends of the umbilical artery during normal pregnancy. J Clin Ultrasound. 1993;21(5):317-24. doi:10.1002/jcu.1870210505 [ Links ]
11. Abramowicz JS, Warsof SL, Arrington J, Levy DL. (1989). Doppler analysis of the umbilical artery. The importance of choosing the placental end of the cord. J Ultrasound Med. 1989;8(4):219-21. doi:10.7863/jum.1989.8.4.219 [ Links ]
12. Kurmanavicius J, Florio I, Wisser J, Hebisch G, Zimmermann R, Müller R, Huch R, Huch A. Reference resistance indices of the umbilical, fetal middle cerebral and uterine arteries at 24-42 weeks of gestation. Ultrasound Obstet Gynecol. 1997 Aug;10(2):112-20. doi: 10.1046/j.1469-0705.1997.10020112.x [ Links ]
13. Stuart B, Drumm J, FitzGerald DE, Duignan NM. Fetal blood velocity waveforms in normal pregnancy. BJOG. 1980;87(9):780-5. doi:10.1111/j.1471-0528.1980.tb04613.x [ Links ]
14. Trudinger B J, Giles W B, Cook, C M. Uteroplacental blood flow velocity-time waveforms in normal and complicated pregnancy. BJOG. 1985;92(1):39-45. doi:10.1111/j.1471-0528.1985.tb01046.x [ Links ]
15. Schulman H, Fleischer A, Stern W, Farmakides G, Jagan, N, Blattner P. Umbilical velocity wave ratios in human pregnancy. Am J Obstet Gynecol. 1984;148(7):985-90. doi:10.1016/0002-9378(84)90541-6. [ Links ]
16. Diez G, Bazan M, Lacunza R, Elias J, Huertas E. Selección de la curva de referencia del índice de pulsatilidad de las arterias uterinas entre las 24 y 40 semanas de gestación para una institución de salud. Lima Peru. Rev Peru Ginecol Obstet. 2020;66(4). DOI: 10.31403/rpgo.v66i2274 [ Links ]
17. Ruiz-Martinez S, Papageorghiou AT, Staines-Urias E, Villar J, Gonzalez de Agüero R, Oros D. Clinical impact of Doppler reference charts on management of small for gestacional age fetuses: need for standardization. Ultrasound Obstet Gynecol. 2020 Aug;56(2):166-72. doi: 10.1002/uog.20380 [ Links ]
Received: June 14, 2020; Accepted: November 03, 2020
 Este es un artículo publicado en acceso abierto bajo una licencia Creative Commons
