


Services on Demand
Journal

Article
 text in
  English (pdf)
 Article in xml format
 Article references
 Send this article by e-mail
Indicators
-
 Cited by SciELO
Related links
-
 Similars in
SciELO
Similars in
SciELO
Share

 Permalink
Revista Peruana de Ginecología y Obstetricia
On-line version ISSN 2304-5132
Rev. peru. ginecol. obstet. vol.68 no.1 Lima Jan./Mar. 2022 Epub Feb 24, 2022
http://dx.doi.org/10.31403/rpgo.v68i2384
Original article
Cesarean section classification according to Robson's system in a private HSPI in Cali, 2017
1 Universidad Libre Seccional Cali, Colombia; Clínica Versalles S.A. Cali, Colombia
2 Research Group: Grupo Interinstitucional de Ginecología y Obstetricia - GIGYO, Universidad Libre Seccional Cali, Colombia.
Objective
: To characterize cesarean sections according to the Robson classification system in a private high complexity HPSI, in the period between January 1 December 31, 2017.
Methods
: Descriptive, retrospective, cross-sectional study conducted in a private HPSI in the city of Cali. The study included pregnant women admitted for delivery care in 2017. A database was constructed in Microsoft Excel 2010, with the variables defined in Robson's classification. The rate of cesarean sections, the relative size of each group and the relative contribution of each group to the overall rate of cesarean sections were calculated, as well as the causes of cesarean sections were analyzed. The results are presented in tables.
Results
: The overall cesarean section rate was 35.4 %. The groups with the highest contribution to the total percentage of cesarean sections were groups 2, 1 and 10 with 20.4 %, 3.9 % and 3.3 %, respectively. History of previous cesarean section was the main cause. Conclusions: Using Robson's classification, it can be concluded that it is possible to reduce the rate of cesarean section rate by 14 % by intervening in the history of previous cesarean section.
Key words: Cesarean section; classification; Vaginal birth after cesarean
INTRODUCTION
The World Health Organization (WHO), concerned about the increase in cesarean sections, has developed strategies to reduce their rates. Since 1985 there has been a consensus on the acceptable or ideal cesarean section rate to reduce maternal and neonatal mortality, which is between 10% and 15%. Today, 36 years later, is this still the recommended rate?1).
In response to the previous question, a systematic review was carried out in 2011 and information was collected between 1968 and 2008. Twenty-seven publications were included for analysis, grouped into twelve publications based on indications, five according to the degree of urgency and the remaining as other classifications. The study concluded that the indication-based technique is highly accurate and recommends Robson's classification; it would also facilitate auditing, analysis and comparison of rates and help create and implement strategies aimed at optimizing rates2).
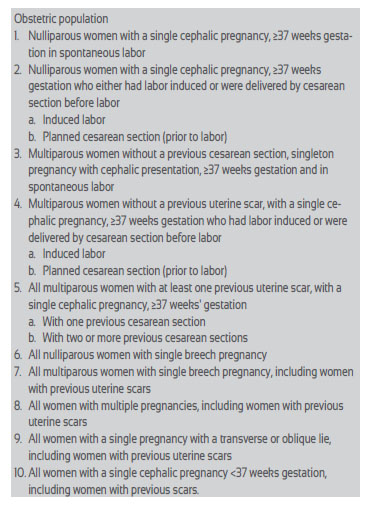
Robson, in 2001, in the absence of internationally standardized methodologies, presented a classification system in which parameters such as obstetric history, labor onset condition, fetal presentation and gestational age at delivery are established. The system guides obstetric decisions, grouping them into ten categories(3,4).
The use of the Robson classification as an evaluation tool has been applied to more than 33 million women and this methodology has shown strengths such as simplicity, efficacy, reliability and flexibility5).
The Latin America and Caribbean region have the highest cesarean section rates, 40.5 %, followed by North America with 32.3 %, Oceania with 31.1 %, Europe with 25 %, Asia with 19.2 % and Africa with 7.3 %6).Figure 1.
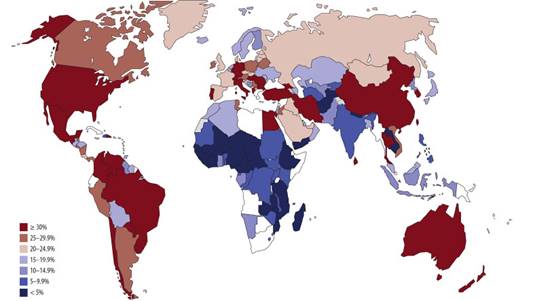
Source: Betrán AP, et al. The Increasing trend in caesarean section rates: global, regional and national estimates: 1990-2014. PLoS One. 2016 Feb 5;11(2):e0148343. doi: 10.1371/journal.pone.0148343 (6)
Figure 1. Percentage oF cesarean sections by country.
In Colombia, according to information from the National Administrative Department of Statistics (DANE), cesarean section reached 45.5 % of all births in the country. It went from a proportion of cesarean sections of 37.2 % in 2008 to 45.5 % in 2017 7. In Cali, the cesarean section rate varies between 20 % and 85 %8).
The WHO, in 2015 launched the declaration of the cesarean rate and as such promotes the Robson Classification for the analysis of the cesarean rate9, and in 2018 issued the manual for the application of the Robson classification10).
Colleges, such as the American College of Obstetrics and Gynecology (ACOG), and protocols carried out by institutions such as the Clinic of Barcelona, have made recommendations on the indications for cesarean section. The following are accepted as elective cesarean sections indications: breech, transverse or oblique presentation, fetal macrosomia, iterative cesarean section (>2 previous cesarean sections), history of uterine rupture (risk of recurrence from 6 to 40 %), pregnant women undergoing previous uterine surgery with cavity entry (myomectomy), previous cesarean section with vertical or classic corporal uterine incision or extended transverse "T" hysterotomy (risk of uterine rupture of 1.6 % and 6 %, respectively), placenta previa, and vasa previa. Also, maternal infections such as condyloma acuminatum that extensively affect the birth canal, patients with acquired immunodeficiency virus (HIV), active genital herpes lesions and maternal medical pathology that discourages vaginal delivery. Fetal conditions such as prematurity, intrauterine growth restriction (IUGR) and multiple gestations will depend on the individual circumstances of each case, which are important criteria for the analysis of each Robson group11).
The present study characterizes cesarean sections performed in a private high complexity health service provider institution (HSPI), using Robson's classification system (Table 1), in 2017.
METHODS
This is a descriptive, retrospective, cross-sectional study carried out in a high complexity private HSPI in the city of Cali, a referral center for the contributory health care system in the southwestern part of Colombia.
All pregnant women admitted for delivery care and who terminated their pregnancy at this institution during the period January 1 to December 31, 2017 were included. Pregnant women with a fetus weighing less than or equal to 500 g or less than or equal to 22 weeks of gestation and/ or patients who presented incomplete information in the database were excluded. The Robson Classification was used, which discriminated the population attended into ten groups based on four obstetric concepts: fetal presentation as singleton cephalic, singleton breech, singleton oblique or transverse and multiple pregnancy; previous obstetric history: nulliparous, multiparous without previous cesarean, multiparous with previous cesarean; onset of labor: spontaneous delivery, induction of labor, elective cesarean before labor; gestational age in completed weeks at the time of delivery. The definitions contained in the variables are those established in the WHO Manual10.
The information was collected in a database in Microsoft Excel 2010, with the variables of Robson's classification. Clinical histories were reviewed and maternal, fetal and ovarian characteristics were recorded.
The overall cesarean section rate, the relative size of each group (number of patients attended belonging to each group / [total number of patients attended, both vaginally and via cesarean section] x 100), the relative contribution of each group to the overall cesarean section rate and in each group the indication for cesarean section were calculated. The data were organized in tables of frequencies and percentages.
The present research work was approved by the ethics committee of the Clínica Versalles S.A. and the Universidad Libre Seccional Cali.
RESULTS
The private HSPI provided the database. A total of 6,927 patients were reported, of which three3 were excluded (two abortions and one medical history with incomplete data), leaving 6,924 patients for analysis.
The cesarean section rate in this study was 35.4 % (2,452 cases). The rate of vaginal deliveries was 64.6 % (4,465 cases).
From the analysis of each of the variables of the pregnant women in the study, the following characteristics were found:
The average number of deliveries and cesarean sections was 577 per month. The average age of the patients was 26 years and the distribution by age group was: adolescent pregnant women (< 18 years) 8 % (554), late pregnant women (> 35 years) 7 % (461), and low-risk pregnant women by age (18 to 35 years) 85 % (5,909) (Table 2).
Table 2 characteristics of the study population.
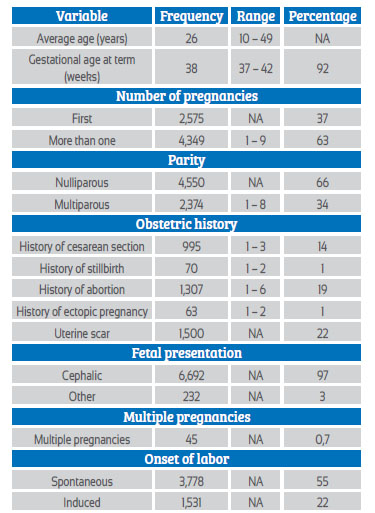
Source: Medical records analyzed by the authors.
* NA: Not applicable.
For pregnant women who completed their pregnancy at term, 92 % (6,376) were 37 weeks or more gestation.
With respect to pregnancy, 62.8 % had had one or more pregnancies. Sixty-six percent were nulliparous patients. As obstetric history relevant to the results obtained, 22 % had uterine scarring, including cases of myomectomy, and 14 % had a history of previous cesarean section. Regarding fetal presentation, 97 % were cephalic.
As to the variable onset of labor, 55 % started spontaneously, 22 % required induction and 23 % had cesarean section before the onset of labor.
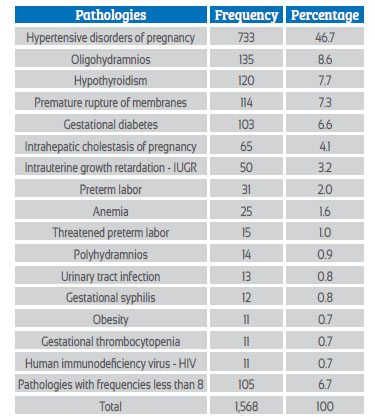
Maternal pathologies associated with gestation occurred in 1,568 patients (23 %). The most frequent were hypertensive disorders associated with pregnancy, oligohydramnios, hypothyroidism, premature rupture of membranes, gestational diabetes and intrahepatic cholestasis of pregnancy. Table 3.
ANALYSIS OF RESULTS BY MOST RELEVANT GROUPS ACCORDING TO ROBSON'S CLASSIFICATION
In group one, nulliparous women with a single cephalic pregnancy, ≥37 weeks of gestation in spontaneous labor, 28.9 % (2,002) met the criteria, 86 % had vaginal delivery and 13.5 % cesarean section. According to maternal age at risk (<18 years or >35 years), there were 27 patients corresponding to 1.3 % of the group. The most frequent causes of cesarean section were: history of previous cesarean section, stationary labor, prolonged labor, and unsatisfactory fetal status. 5.9 % had no justifiable cause for cesarean section.
Group two, nulliparous women with a single cephalic pregnancy, ≥37 weeks gestation who either had labor induced or were delivered by cesarean section before labor included 30% of cases (2,061); 68.4 % had cesarean section and 31.5 % vaginal delivery. The most frequent causes of cesarean section were: previous cesarean section 50.6 % (713), stationary labor 8 % (113), pelvic dystocia 7.9 % (111), fetal macrosomia 7.0 % (98) and unjustified 4.7 %.
Subgroup 2 A, pregnant women who had induced labor: 977 of 2,061 patients met the criteria (47.4%). 33 % (326) ended in cesarean section, and the most frequent causes of cesarean section were: stationary labor 34.7 %, unsatisfactory fetal status 17.5 % and failed induction 15 %.
Subgroup 2 B, cesarean sections scheduled prior to labor, 1,084 of 2,061 patients met the criteria (52.3 %). The most frequent indications for cesarean section in this subgroup 2 B were: previous cesarean section (65.8 %), fetal macrosomia (8.6 %), pelvic dystocia (8 %); unjustified, 3.3 %.
Group ten, all women with a single cephalic pregnancy <37 weeks gestation, including women with previous scars, were represented by 471 of 6,924 (6.8 %). A total of 48.6 % (229) terminated the pregnancy by cesarean section. The most frequent causes were: previous cesarean section (19.7 %), compromised fetal status during labor (9.6 %), severe preeclampsia (9.2 %), unjustified (8.3 %).
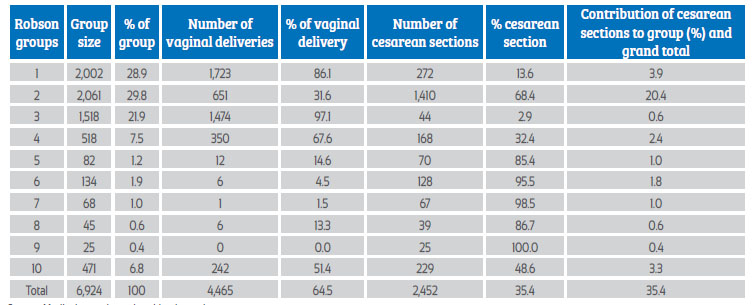
Once the distribution of patients in each of the categories were identified, the analysis was summarized in the following table which presents the proportion of cesarean sections and vaginal delivery in the Robson classification categories (Table 4).
DISCUSSION
The application of the Robson classification model identified that the proportion of cesarean sections was 35.4 %. This proportion, compared to that indicated by the WHO (10-15 %)(1), is three times the expected. It is lower compared to a private hospital in Buenos Aires, where according to Dr. Paleari the cesarean section rate was 53.5 %(11), and to countries such as Mexico, whose reported cesarean section rate is 46.2 %(11) and Colombia's 45.5 %7).
Over the years, the proportion of cesarean sections has progressively increased. This is evidenced in the literature: in Spain, Dr. Cabeza showed an increase from 14 to 18.6 %13). In Singapore, Dr. Chong found an increase from 19.9 to 29.6 %(14). In Italy, Dr. Ciriello, over a 10year period described that the cesarean section rate increased from 12.5 to 18 %15). In Chile, Dr. Vera reported an increase from 23.9 to 30 %(16). In Colombia there was a tendency for cesarean section to increase from 24.9 % in 1998 to 45.7 % in 201318).
In our study, the groups with the highest contribution to the total percentage of cesarean sections were group two2 with 20.4 %, followed by group one1 with 3.9 % and group ten10 with 3.3 %. This coincides with that presented in previous studies, where Drs. Zuleta and Jarrod reported that groups 1, 2, 3 and 10 concentrated the highest number of patients12).
In the present study, the specific proportion of cesarean section found in group 2 was 68.4 %, that is, more than half ended in cesarean section. The cause of cesarean section was a history of previous cesarean section, with a percentage of 50.6%, which is not an iterative indication for cesarean section. This figure is considerably higher than that reported in comparative studies, in which in general it does not exceed 30 %12-16).
During the analysis of group two regarding the history of previous cesarean section, many of the medical records did not specify the time interval between the previous cesarean section and the current pregnancy. And regarding the second most frequent cause (stationary labor), all had this criterion before the onset of the active phase of labor.
Cesarean section by maternal request is a frequent indication nowadays. Therefore, it can be presumed that it makes some contribution to the specific proportion of cesarean section in the group. However, in our study the percentage was very low, only 0.21 % (3 patients).
The next group with the greatest impact on the overall proportion of cesarean section is group 1, with a contribution of 3.9 %. This group is the second with the second highest number of patients, corresponding to 28.9 % of the study population, with a specific cesarean rate of 13.5% which is considered adequate with respect to what is suggested by the WHO (10-15 %). The results in this group are comparable with most of the studies reviewed12-16).
Group ten 10 contributes 3.3 % to the overall proportion of cesarean sections, being the third group with the greatest impact. The literature reviewed shows similar results, where the percentage that this group contributes to the overall proportion of cesarean sections is close to or less than 10 %12,19 -21).
The specific proportion of cesarean sections found in group ten (10) was 49 %, in agreement with studies carried out in the cities of Bogotá, Medellín and Cartagena with 43 %, 35 % and 52 %, respectively12,19,20). Given the variability found in the indications for cesarean delivery in group ten 10 such as history of previous cesarean section, severe hypertensive disorders of pregnancy, compromised fetal status during labor and failed induction, unjustified cesarean sections -, it is considered a difficult group to intervene, leaving only the discussion of the history of previous cesarean section, which is not in itself an indication for cesarean section.
In general, groups six, seven, eight and nine in our study behave very similarly to those found in the various reviews studied12-16).
In group six 6, cesarean section was expected in 100 % of the patients; however, 4.5 % ended the pregnancy by vaginal delivery. Although the worldwide indication is cesarean section in nulliparous pregnant women with breech fetus, in our study there were six 6 cases of vaginal delivery, five 5 of which were less than 28 weeks of gestation with fetal death, which complies with the indication.
The strength of this study is to have taken all the events of the year, allowing the review of 6,924 patients, which made it easier to evaluate the main indications for cesarean section with a sufficient number of participants in each of the groups of the Robson classification groups.
The limitation was the quality of the information collected in the medical records, since the data on the precise indications for cesarean section in a group of patients were unknown.
CONCLUSIONS
The cesarean section rate was 35.4 % and although it is lower than the rate reported in the country (45.5 %), it exceeds the recommendation of the World Health Organization.
The recommendation suggested by the research is to analyze the indication for cesarean section in nulliparous pregnant women with term pregnancy, for whom the indication for cesarean section is double compared to other researches.
The intervention is clear on pregnant women with a history of previous cesarean section, as it is the highest contributor to the overall proportion of cesarean section in this HSPI. By intervening in this cause, the overall cesarean rate could possibly be reduced by 14 %.
It is suggested to improve the quality of recording indications for cesarean section.
This study showed that the Robson classification system is a useful tool that, if implemented, would allow the planning of strategies based on the evaluation of specific groups for the reduction of cesarean section rates and the shortand long-term reduction of maternal morbidity and mortality.
REFERENCES
2. Torloni MR, Betran AP, Souza JP, Widmer M, Allen T, Gulmezoglu M, et al. Classifications for cesarean section: A systematic review. PLoS ONE. 2011;6:e14566. https://doi.org/10.1371/journal.pone.0014566 [ Links ]
3. Organización Panamericana de la Salud. La clasificación de Robson: Manual de aplicación 2018. http://www.clap.opsoms.rg/publicaciones/9789275320303esp.pdf [ Links ]
4. Robson MS. Classification of caesarean sections. Fetal and Maternal Medicine Review. Cambridge University Press 2001 Dec;12(1):23-39. https://doi.org/10.1017/S0965539501000122 [ Links ]
5. Vogel JP, Betrán AP, Vindevoghel N, Souza JP, Torloni MR, Zhang J, et al. on behalf of the WHO Multi-Country Survey on Maternal and Newborn Health Research Network. Use of the Robson classification to assess caesarean section trends in 21 countries: a secondary analysis of two WHO multicountry surveys. Lancet Global Health. 2015;3(5):e260-70. https://doi.org/10.1016/S2214-109X(15)70094-X [ Links ]
6. Beltrán AP. La tendencia creciente en las tasas de cesáreas: estimaciones mundiales, regionales y nacionales: 1990-2014. PLoS One. 2016 Feb;11(2). [ Links ]
7. DANE. DANE. [Online].; 2018 [cited 2018-04-11]. https://www.dane.gov.co/files/investigaciones/poblacion/cifras-definitivas-2017.pdf [ Links ]
8. Cobo CE. Tasas de cesárea en la Fundación Clínica Valle del Lili. ¿Es posible reducirlas? [Internet]. 1 [cited 13 Nov 2020];29(2,3):53-1. https://colombiamedica.univalle.edu.co/index.php/comedica/article/view/91 https://doi.org/10.18597/rcog.665 [ Links ]
9. OMS. Declaración de la OMS sobre tasas de cesárea. [Online]. 2015 [cited 2017-03-03]. https://apps.who.int/iris/bitstream/handle/10665/161444/WHO_RHR_15.02_spa.pdf;jsessionid=5E41115DBF8A6B5CA49DE9A5F615DE67?sequence=1 [ Links ]
10. OPS. La clasificación de Robson. Ejemplo de informe tabular de Robson y su interpretación OPS/FPL-CLAP/18-039. [Online].; 2019 [cited 05-05-05]. http://www.clap.ops-oms.org/publicaciones/OPS-FPL-CLAP-18-039.pdf [ Links ]
11. Hospital Clínic, Hospital Sant Joan de Déu, Universitat de Barcelona, Protocolo: Cesárea. Protocolos de Medicina Maternofetal. 2013. https://medicinafetalbarcelona.org/protocolos/es/obstetricia/cesarea.pdf/https://creativecommons.org/licenses/by-nc-sa/3.0/igo [ Links ]
12. Zuleta-Tobón JJ, Quintero-Rincón F, Quiceno-Ceballos AM. Aplicación del modelo de Robson para caracterizar la realización de cesáreas en una institución de tercer nivel de atención en Medellín, Colombia: estudio de corte transversal. Rev Colomb Obstet Ginecol. 2013;64:90-9. https://doi.org/10.18597/rcog.115 [ Links ]
13. Cabeza Vengoechea PJ, Calvo Pérez Betrán AP, Mas Morey M, Febles Borges MM, Alcácer PX, Ramallo Alcocer A, et al. Clasificación de cesáreas por Grupos de Robson en dos periodos comparativos en el Hospital de Manacor. Prog Obstet Ginecol. 2010;53(10):385-90. https://doi.org/10.1016/j.pog.2010.05.003 [ Links ]
14. Chong C, Su LL, Biswas A. Changing trends of cesarean section births by the Robson Ten Group Classification in a tertiary teaching hospital. Acta Obstet Gynecol Scand. 2012 Dec;91(12):1422-7 https://doi.org/10.1111/j.1600-0412.2012.01529.x [ Links ]
15. Ciriello E, Locatelli A, Incerti M, Ghidini A, Andreani M, Plevani C, Regalia A. Comparative analysis of cesarean delivery rates over a 10-year period in a single Institution using 10-class classification. J Matern Fetal Neonatal Med. 2012 Dec;25(12):2717- 20. https://doi.org/10.3109/14767058.2012.712567 [ Links ]
16. Vera C, Correa R, Neira J. Utilidad de la evaluación de 10 grupos clínicos obstétricos para la reducción de la tasa de cesárea en un hospital docente. Rev Chil Obstet Ginecol. 2004;69:219-26. https://doi.org/10.4067/S0717-75262004000300007 [ Links ]
17. Paleari L, Gibbons L, Chacon S, Ramil V, Belizan JM. Tasa de cesáreas en dos hospitales privados con normativas diferentes: abierto y cerrado. Ginecol Obstet Mex. 2011. 2012;80(4):263-9. [ Links ]
18. República de Colombia. Departamento Administrativo Nacional de Estadística (DANE). Nacimientos por tipo de parto según departamento de ocurrencia [visitado 2017 mayo 9]. http//:www.dane.gov.co/ [ Links ]
19. Jiménez-Hernández DL, Guevara-Rodríguez A del P, Zuleta-Tobón JJ, RubioRomero JA. Tasa de cesáreas por grupos de Robson en una institución de mediana complejidad de la ciudad de Bogotá, 2012-2014. Rev Colomb Obstet Ginecol. 30 de junio de 2016;67(2):101-11. https://doi.org/10.18597/rcog.381 [ Links ]
20. Sánchez Pacheco N, Méndez Rodríguez RR, Ramos Clason EC. Caracterización de las cesáreas por modelo Robson en la Clínica de Maternidad Rafael Calvo de Cartagena. Diss. Universidad de Cartagena, 2017. [ Links ]
21. Aguilar Redondo R, Manrique Fuentes G, Aisa Denaroso LM, Delgado Martínez L, González Acosta V, Aceituno Velasco L. Uso de la clasificación de Robson en un Hospital Comarcal de España para reducir la tasa de cesáreas. Rev Chil Obstet Ginecol. Abril de 2016;81(2):99-104. https://doi.org/10.4067/S0717-75262016000200003 [ Links ]
Ethical aspects: The present work was approved by the Ethics Committee of the Clínica Versalles S.A. of the city of Cali, with act number: 36-Cal-9
Cite as: Mosquera Agudelo JL, Martínez Buitrago DM, Guevara Chaux CL, Navas Jojoa MA, Erazo Barahona MI, Paz FF, Figueredo Satizábal MF, Gaviria Criollo CA. Cesarean section classification according to Robson's system in a private HSPI in Cali, 2017. Rev Peru Ginecol Obstet. 2022;68(1). DOI: 10.31403/rpgo.v68i2384
Received: January 02, 2021; Accepted: December 30, 2021
 Este es un artículo publicado en acceso abierto bajo una licencia Creative Commons
