


Servicios Personalizados
Revista

Articulo
 texto en
  Inglés (pdf)
 Articulo en XML
 Referencias del artículo
 Enviar articulo por email
Indicadores
-
 Citado por SciELO
Links relacionados
-
 Similares en
SciELO
Similares en
SciELO
Compartir

 Permalink
Revista de la Facultad de Medicina Humana
versión impresa ISSN 1814-5469versión On-line ISSN 2308-0531
Rev. Fac. Med. Hum. vol.20 no.1 Lima ene./mar. 2020
http://dx.doi.org/10.25176/rfmh.v20i1.2555
Review article
Case-control Studies
1Research Institute in Biomedical Sciences, INICIB, Ricardo Palma University. Lima, Peru.
2Department of Medicine National Hospital Hipólito Unanue. Lima, Peru.
Case-control studies are analytical observational epidemiological studies generally devoted to evaluate factors associated with infrequent diseases. Its hierarchy within the pyramid of evidence lies in an intermediate place between cross sectional and cohort studies. The measure of association used for these studies is the Odds Ratio. Some variants of this design, such as incident and nested case studies and nested case-control studies (within a cohort) can reduce the risk of selection bias. The basic concepts related to this type of studies are reviewed.
Key words: Epidemiology; Causality; Observational study.
BASIC CONCEPTS
Case-Control studies are epidemiological studies of anobservationaltype, due to the fact that an intervention is not performed but the occurrence of events is “observed”, and they are analytical since they allow to formulate a hypothesis in relation to evaluating the association between two or more variables, also having a contrasting group which is called “Control”1-3in this case.
Its hierarchy in the pyramid of evidence is located in an intermediate place, generally with a level of evidence considered higher than cross-sectional studies and lower than cohort studies. They are useful for assessing the relationship between possible exposures and effects, starting from the presence of an event of interest and retrospectively evaluating the temporality of the association with one or more exposures.
Case-control studies assume the presence of an event (EFFECT, also calledoutcome) identifying people or patients with the presence of this event and comparing them with a group of similar characteristics, but without the presence of it. People with the event of interest are called CASES, while those chosen to serve as comparators are called CONTROLS. It is important to highlight 2 aspects in the controls since it is their proper selection is a key aspect to this design: the controls must start from the same population that gave origin to the cases, and they must also be similar to these, except for the exposure1.
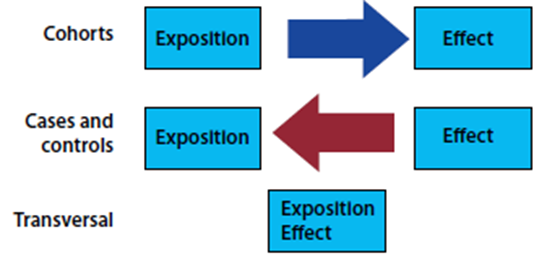
Once the cases and controls have been identified, the presence of the EXPOSURE in each of the groups should be evaluated. In other words, temporality is retrospectively identified in the presence or absence of exposure. Temporality is a very important point to be able to differentiate between the 3 designs of observational analytical studies. In cohort studies, exposure to the effect is discontinued, and in cross-sectional studies these are measured in parallel; in case-control studies, the effect towards exposure is the start (Figure 1).
ODDS RATIO AS A MEASURE OF ASSOCIATION IN CASE-CONTROL STUDIES
Odds is a reason between two mutually exclusive events. This English word does not have a specific Spanish translation, but historically it comes from gambling, where the reason is to win or lose. In scientific research, this is a reason between the occurrence or not of an event. For example, if we have 100 people and 20 of them die and the other 80 survive, the Odds of dying will be 20 to 80, or 20/80=0.25. This Odds of dying is equivalent to a probability of dying of (20/20+80) = 0.2. Odds is then an estimator that correlates with the probability of an event. In particular it has near-probability figures when Odds (and probabilities) are low, and for the purposes of evaluating the association between two variables we can compare exposure Odds between people with and without the disease. This reason of Odds is called Odds Ratio or Ratio of momios and is the measure of association of the design of case-control type1,4,5. This is shown graphically inFigure 2.
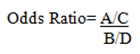
Where A= Number of Cases with exposition B= Number of Controls with exposition C= Number of Cases without exposition D= Number of Controls without exposition A/C= Odds of Exposition in Cases B/D= Odds of Exposition in Controls
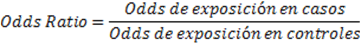
Based on the data in Figure 2 we can present the Odds Ratio as:
Odds Ratio=Exposure Odds in Cases/Exposure Odds in controls
Rearranging that Ratio:
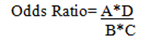
This equivalence is called the "cross product".
The general interpretation of an Odds ratio is as follows:
OR=1 Equal exposure odds in cases and controls: No association. OR<1 factor associated with lower event Odds (protective factor). OR>1 factor associated with higher event Odds (risk factor).
However, it should be remembered that not only the numerical value of the submitted Odds Ratio should be evaluated. It is important to assess that reason in the context of its confidence interval and the statistical significance given by the value of p.
CONSIDERATIONS FOR THE DESIGN
Statistical efficiency
Statistical efficiency can be increased by the number of controls. However, it should be considered that beyond 4 controls for case, the increase in statistical efficiency is low and it is not recommended to exceed this number.
Calculation of sample size
We know that in order for a sample to be representative of the population, and in that sense allow inferences to be made towards it, it must have both an adequate sample size calculation and a random sampling. In this section for academic purposes, we present the formula for calculating sample size in this design when cases and controls are not paired. At present, statistical programs such as STATARand platforms such as OpenEpiRallow researchers to save time in developing step by step mathematical calculations, by entering the data required by the software6. However, this should in no way be done in isolation or detached from the theoretical knowledge of design and its statistical aspects.
The statistical formula for nonpaired Case-Control type studies is as follows4,7:
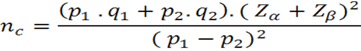
Where:
nc= Number of cases and number of controls without adjustment p1= Expected factor ratio in cases q1= 1-p1 p2= Expected factor ratio in controls q2= 1-p2
Note that if there is an unequal relationship between cases and controls, if the reason for controls/cases is different from 1, an adjustment should be made to the result of nc:
Where:
na= Number of controls adjusted nc= Number of controls without adjustment c= ratio of dividing controls between cases
Choice of the Cases:
Prevalent cases:These are the cases existing at the time of the study. Example: patients who have had heart attacks in a hospital at a given time.
Incident cases:a prospective follow-up is carried out to identify the occurrence of cases. Example: follow-up of patients admitted with chest pain and prospective identification of patients with infarction.
Prevalent cases show an increased risk of bias, particularly if staying or not hospitalized depends on factors associated with exposure of interest. Lower-risk cases may be discharged early, while more serious cases may die and not be evaluated
Choice of the Controls
The choice of controls is possibly the most relevant methodological aspect in case and control studies. As mentioned above, we return to the importance of the control group coming from the same population and being similar to the CASO group with the sole exception of exposure. The improper choice of the control group is one of the main sources of systematic errors in this type of design.
Hospital vs Community Controls
In many studies the cases are patients who are hospitalized for some specific clinical condition, and the controls should be people who, if they had fallen ill, would be included as cases. In this sense, it is controversial in many cases to use hospital controls since they can start from populations that are not necessarily similar to those from which the cases come. For example, in a Tuberculosis Referral Center that receives population from many of the regions at the national level, we could not use as controls on patients from Medical Services, in which case the scope of the Service may be much more local. This often leads to the use of community controls that differ only from the cases in the presence of the effect or event of interest. One way to reduce the risk of bias in the choice of hospital controls is to use the concept of incident cases.
Paired vs Non-paired Controls
One of the ways to make cases and controls as homogeneous as possible is to pair them according to certain characteristics. Matching will be more effective if the variable(s) are related to the result of interest. For example, in a study on the effect of comorbidity on mortality in patients with pneumonia, cases of pneumonia may be associated with controls of the same age. Since age is an important predictor of mortality in pneumonia, its effect is removed from the association and the differences may be more plausibly due to the studied factor.
However, there are some disadvantages of pairing. In terms of feasibility, it can be more laborious and sometimes logistically impossible to make the pairing more important the more demanding the same. On the other hand, the variables used to match the cases and controls cannot be further analyzed as possible predictors or covariates in the adjusted models.
Nested Case and Control Studies (in a cohort)
These studies are useful when working with infrequent events and in which the determination of exposure or effect involves high costs, so that only a limited number of participants can be studied. In this particular case and control design, nested within a cohort (usually several hundred or thousands of patients), those patients who develop the event and are compared with controls are selected (usually randomly selected among those participants who do not develop the event of interest).
STATISTICAL ANALYSIS
The Case and Control studies, being observational studies, have an appreciable probability of presenting confusion, i.e., distortion of a relationship between exposure and effect due to a third variable (confusing variable) associated with both exposure and effect). An important aspect of the analysis of case and control studies involves adjusting the Odds Ratio to the presence of potential confusors. This is usually done using a binary multiple logistic regression analysis8. If the findings of the crude and adjusted analysis are consistent, this gives greater reliability to the results obtained.Table 1presents the comparison of crude OR (analysis without adjustment) and adjusted OR. The left column shows the analysis of variable 3 (dependent) for variables 1 and variables 2 separately. In the column on the right, we can see the analysis of variable 3 against variable 1 adjusted by variable 2 (taking into account that the effect of variable 2 may influence both variable 1 and variable 3). In this case it can be observed that the adjusted analysis decreases the magnitude of the association, judging by the decrease in the value of the OR. It should be noted that the different regression techniques depend to a large extent on the number of observations and variables included. It is also appropriate to assess the suitability of the models by means of tests such as Hosmer and Lemeshow8.
ADVANTAGES AND DISADVANTAGES
All designs have limitations that lead to advantages and disadvantages. There is no perfect design and the researcher should keep that in mind when choosing the best design to answer his research question. It is considered a good practice in research to indicate the methodological limitations of the design, so that other researchers know about them when trying to replicate the study.
Case studies and controls are generally relatively simple and inexpensive studies. Their execution is relatively rapid. Case studies and controls allow the evaluation of multiple exposures and the most appropriate scenario is that of infrequent conditions (effects) or with prolonged latency periods.
The main disadvantage of the case study and controls is the selection bias1. Another common bias is memory bias1that usually occurs when controls are more likely to remember possible exposure.
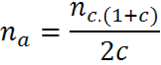
On the other hand, an important limitation of case studies and controls is that it does not allow the estimation of prevalence, since the proportion of people with and without the event is fixed, being determined by the investigator in the calculation of the sample size when entering the ratio between exposed and not exposed1. Another important limitation is that it is not a useful study for infrequent exposures. Finally, the measure of association used in these studies is inappropriate for the case of frequent diseases, as it tends to overestimate the magnitude of the effect of the association compared to the relative risk9.Figure 5shows that the OR always has a more extreme value than the relative risk, being the difference more evident as the values move further away from the unit.
CONCLUSIONS
Case-control studies are relatively easy and quick studies in their implementation. They are a relatively simple approach, although especially subject to bias (particularly selection and memory), being particularly useful in the study of infrequent conditions.
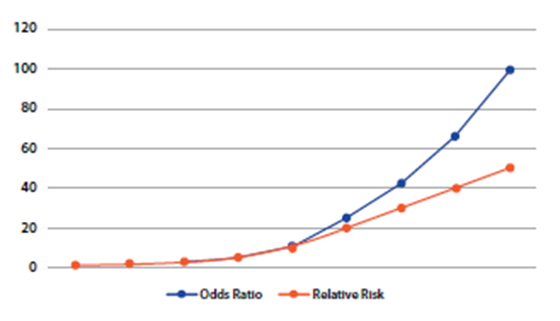
The figure shows the overall process in the development of a case study and controls including the salient aspects in the case selection, control selection, data analysis and interpretation of results. Although this type of studies has been classically linked to a high risk of bias, the use of incident controls and nested models in a cohort offer a significant reduction in the risk of bias and thus a higher level of evidence.
REFERENCES
1. Gordis, Leon. Epidemiología. Quinta. Barcelona, España: Elsevier Saunders; 2014. 391 p. [ Links ]
2. Argimon Pallás, Josep M., Jiménez Villa, Josep. Métodos de Investigación Clínica y Epidemiológica. Cuarta. Barcelona, España: Elsevier Saunders; 2013. 402 p. [ Links ]
3. García Villar C. Introducción a la lectura crítica de artículos: diseño de estudios y sesgos. Radiología (Internet). enero de 2015 (citado 13 de junio de 2019);57:3-13. Disponible en: https://linkinghub.elsevier.com/retrieve/pii/S0033833814001441 [ Links ]
4. Camacho-Sandoval J. Nota estadística Tamaño de muestra en estudios clínicos. Acta Médica Costarricence. 2008;50(1):2 [ Links ]
5 5. Cerda J, Vera C, Rada G. Odds ratio: aspectos teóricos y prácticos. Rev Médica Chile (Internet). octubre de 2013 (citado 13 de junio de 2019);141(10):1329-35. Disponible en: http://www.scielo.cl/scielo.php?script=sci_arttext&pid=S0034-98872013001000014&lng=en&nrm=iso&tlng=en [ Links ]
6. Juul S, Frydenberg M. An introduction to Stata for health researchers. 3rd ed. College Station, Tex: Stata Press; 2010. 340 p. [ Links ]
7. Velasco Rodríguez, Víctor, Martínez Ordaz, Verónica, Ruiz Hernándes, José. Muestreo y tamaño de muestra: Una guía práctica para personal de salud que realiza la investigación. 1era ed. Coahuila, México: Buenos Aires; 2002. [ Links ]
8. Michael J Campbell. Statistics at Square two- Understanding modern statistical applications in Medicine. 2nd ed. UK: Blackwell; 2006. 133 p. [ Links ]
9. Knol MJ, Le Cessie S, Algra A, Vandenbroucke JP, Groenwold RHH. Overestimation of risk ratios by odds ratios in trials and cohort studies: alternatives to logistic regression. CMAJ Can Med Assoc J (Internet). 15 de mayo de 2012 (citado 17 de junio de 2019);184(8):895-9. Disponible en: https://www.ncbi.nlm.nih.gov/pmc/articles/PMC3348192/ [ Links ]
Received: November 15, 2019; Accepted: December 26, 2019
 Este es un artículo publicado en acceso abierto bajo una licencia Creative Commons
