


Services on Demand
Journal

Article
 text in
  English (pdf)
 Article in xml format
 Article references
 Send this article by e-mail
Indicators
-
 Cited by SciELO
Related links
-
 Similars in
SciELO
Similars in
SciELO
Share

 Permalink
Revista de la Facultad de Medicina Humana
Print version ISSN 1814-5469On-line version ISSN 2308-0531
Rev. Fac. Med. Hum. vol.20 no.3 Lima Jul-Sep 2020
http://dx.doi.org/10.25176/rfmh.v20i3.2904
Original article
Factors associated with overweight and obesity in workers of Piura-Peru
1Universidad Continental. Lima, Perú
2Asociación Médica de Investigación y Servicios en Salud. Lima, Perú.
Methods:
A cross-sectional study, using secondary database. We used the occupational exam records of workers of companies in Sechura - Piura. The main variable was the BMI classification (normal/overweight/obese). Descriptive results and the association between the type of BMI and other variables were presented.
Results:
Of the 1203 workers who met the selection criteria, 93.2% (1121) were male, and had a median age of 31 (range: 18-63). Significant difference between BMI with respect to waist circumference, hip diameter, hemoglobin, cholesterol, triglycerides, HDL, LDL and glucose was found. In addition to gender, age and type of test (entrance/periodic/retirement). The study showed no significant differences from the place of birth or residence.
Conclusions:
There were differences in all the physio-anthropometric parameters evaluated with respect to BMI, except birthplace/residence, which shows that the risk of the working population should not be assessed by these demographic characteristics. Work programs to improve global health should be generated.
Keywords: Overweight; Occupational Health. (Source MeSH NLM).
INTRODUCTION
According to the WHO, there is approximately 2 billion overweight adults and a third of whom are obese1,in part due to the advancement in technology and the industry development which have generated that the productive processes depend greatly on machines, this has decreased the daily use of energy throughout the years; it is estimated at an average decrease of 100 calories/day/worker2, in addition to lifestyle changes, harmful habits and mental factors3-5. All of these could lead to problems related to their daily work, even reaching work termination6,7; becoming more serious in those jobs with greater tension within and outside of work8-10.
Nutrition in the workplace is another very important factor, little variety or the perception of unhealthy food is related to overweight among workers11; some reports indicate that one out of three professionals are overweight and one out of thirteen suffer from obesity12,13, more evident among lower income work groups14, those with seniority15,16, depending on their responsibility/hierarchy17,18, the type of activity they perform daily19,20, and even the field of the company21, in addition to finding elevated glucose and lipid panel levels6,12. This has not been studied in our environment, consequently the objective of this study was to determine the factors associated with overweight and obesity in Piura workers that are seen in a private health institution.
METHODS
Design and setting
A cross-sectional study, with secondary data base analysis. Database used was generated by the medical exams performed on the workers of diverse companies.
Population and sample
We evaluated workers examined in Cismedic, a private health entity in the Sechura district in Piura, in the north coast of Peru. The majority of these workers originated from the same city in Piura or surrounding cities, belonged to different socioeconomic levels, selected a census type sample of those attended. We included workers over the age of 18, who had an occupational exam that included the measured variables and whose weight was considered normal, overweight and or obese, we excluded 8 workers who had consumed psychoactive substances since this might interfere with the bloodwork results.
Variables and instruments
The main variables were the presence of overweight or obesity in the evaluated workers, defined by a body mass index (BMI) between 25-29.9 kg/m2 and >30 kg/m2, respectively. This was in contrast to those who had a weight considered normal (BMI between 18.5-24.9 kg/m2. Other variables obtained were worker gender (masculine/feminine), age (quantitative variable), place of birth and current residence (Piura, not Piura and northern, central, southern regions of Peru, and foreigner category), type of job they performed (administrative/laborer) and the type of medical occupational exam performed (entrance/periodic/retire).
Procedures
After obtaining the required consents, we had access to the medical records generated during the medical visit for each worker, these were created according to the laboratory results and the anthropometric measurements company forms. Then the data was passed to a sheet generated by the Microsoft Excel program (for Windows version). This was performed by a data entry person trained by the primary author of this study.
The circumference variables were taken according to the World Health Organization recommendations; the waist circumference was performed with the adequate intimacy to take these measurements, attempting without clothing, meaning directly over the skin, when this was unattainable, we considered it acceptable to measure the waist circumference over a fine fabric, but not over thick or voluminous fabric22. This measurement was taken after a normal exhalation, with arms relaxed to the sides, at the height of mid- axillary region, at the meeting point between the lower part of the last rib and the highest point of the hip. We stood next to the participant, tracing the lower point of the last rib and the iliac crest (highest point of the hip bone) which was marked with a fine point pen. With a measuring tape, we found the central point between these two marks. We placed the measuring tape over the point indicated in the prior phase and asked the participant to roll in it (making sure the tape was in a horizontal position surrounding the participant’s entire body). The participant was asked to stand with both feet together and arms at their sides with palms facing inward and exhale slowly. The waist circumference was measured, and the result was read with a 0.1cm precision on the tape.
The hip diameter was measured keeping the same adequate intimacy (with similar indications as the waist circumference). This measurement was taken with arms relaxed at their sides, at the widest location above the buttocks, standing next to the participant, the measuring tape was placed at the widest location of the buttocks, while asking the participant to remain standing, with feet together and arms at their side palms facing inward and exhaling slowly. We verified the tape was in a horizontal position surrounding the entire body. The hip diameter was measured, and the result was read with a 0.1 cm precision on the tape.
Furthermore, the laboratory test results were obtained for hemoglobin, cholesterol, triglycerides, HDL, LDL, and blood glucose. These were taken by a certified health professional, using adequate equipment for each case (colored tubes appropriate for each sample type), with a standard technique and explaining that this was part of the regular occupational exam. The blood samples were analyzed in a device that held the necessary certifications and that was constantly calibrated by trained personnel.
Statistical analysis
Prior to the statistical analysis, a data debugging process was carried out, in order to find anomalous and/or incongruent data. These data were eliminated to perform the analysis with the Stata version 11.1 statistical program.
The descriptive statistic was performed by means of frequencies and percentages for the categorical variables. The mean/standard deviation was used for the quantitative variables, except for the worker age variable, which was described by the median and the ranges due to it being of an abnormal type, post-evaluation by means of the Kolmogorov/Smirnov statistical test.
The chi squared test was used for the crossing of categorical variables. The Analysis of Variance (ANOVA) was used for the crossing of the categorical-quantitative variables. The values p<0.05 were considered statistically significant.
RESULTS
Of the 1203 workers who met the selection criteria, 93.2% (1121) were males and had a median age of 31 years (range: 18 to 63 years of age). The majority were born in Piura (62.3%) and currently reside in a city in the northern part of Peru (75.6%). 90.2% (1081) worked in a labor or field position. The labor characteristics of the workers are shown inTable 1.
Table 1. Labor characteristics of workers in a district of Piura.
| Variable | N | % |
| Sex | ||
| Masculine | 1121 | 93,2 |
| Feminine | 82 | 6,8 |
| Age (years)* | 31 | 18-63 |
| Birthplace£ | ||
| North | 932 | 77,8 |
| Center | 221 | 18,4 |
| South | 31 | 2,6 |
| Foreigner | 14 | 1,2 |
| Currently reside£ | ||
| North | 911 | 75,6 |
| Center | 267 | 22,2 |
| South | 18 | 1,5 |
| Foreigner | 5 | 0,4 |
| Type of job | ||
| Administrative | 118 | 9,8 |
| Laborer/Field work | 1081 | 90,2 *Median and range |
£ North: regions above the capital, Center: regions around the capital and South: regions below the capital.
Figure 1Shows the frequencies of BMI according to the place of birth (A), type of job position (B), and gender (C). We can observe that overweight is the most frequent category, with 4-5 for every 10 workers surveyed, obesity frequencies were always between 7-20%.
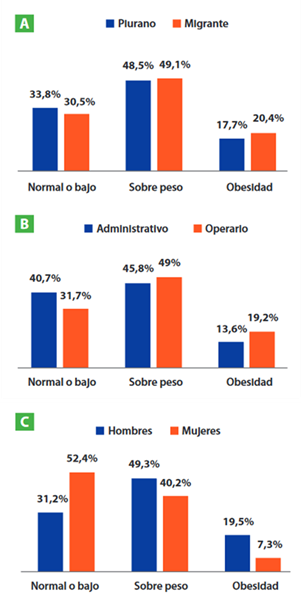
Figure 1 Body mass index type according to worker’s place of birth (A), type of job position (B) and gender (C) in a district of Piura.
Of all the occupational exams, 84.4% (105) were at entrance, 7.3% (88) were annual and 8.3% (100) were at retirement. When they were categorized according to their BMI, 32.7% (393) were normal or low weight, 48.7% (586) were overweight and 18.6% (224) were obese. The anthropometric and laboratory values were all different according to the BMI categories, shown inTable 2.
Table 2. Anthropometric and laboratory values according to the body mass index (BMI) of workers in a district of Piura.
| Variables | Medium according to body mass index (standard deviation) | p-value | ||
| Normal or low | Overweight | Obesity | ||
| Waist circumference | 80,3 (5,9) | 90,9 (6,3) | 102,4 (9,3) | <0,001 |
| Hip Diameter | 91,2 (4,8) | 98,3 (5,0) | 105,7 (12,6) | <0,001 |
| Hemoglobin | 14,9 (1,0) | 15,1 (1,0) | 15,3 (1,0) | <0,001 |
| Cholesterol | 155,3 (29,7) | 170,8 (32,8) | 184,2 (33,9) | <0,001 |
| Triglycerides | 114,3 (59,3) | 154,3 (78,0) | 190,4 (96,3) | <0,001 |
| HDL | 66,7 (11,1) | 68,7 (11,2) | 69,8 (10,4) | 0,003 |
| LDL | 71,6 (23,1) | 83,9 (25,1) | 95,2 (28,0) | <0,001 |
| Glucose | 82,8 (9,0) | 85,5 (15,5) | 89,2 (16,0) | <0,001 |
p-value obtained through Analysis of variance (ANOVA).
Once the BMI values were determined according to the workers’ characteristics, we observed that there was a statistically significant difference regarding the worker’s gender (p<0,001), given that the frequencies increase in men until they reach obesity. We also found differences in the age averages (p<0,001), given that those that were overweight and obese had 5.1 and 8.6 more years on average, respectively. We also found that, according to exam type, the frequencies of overweight and obesity varied. Type of worker showed no significant difference according to the BMI. When the BMI categories were crossed depending if worker was born in Piura (p=0,368) or born in another region (p=0,710), there were no statistically significant differences. Likewise, when they were asked if they currently resided in Piura (p=0,611) or in another region (p=0,386). These results are shown inTable 3.
Table 3. Workers’ socio-demographic characteristics according to workers’ body mass index (BMI) in a district of Piura.
| Variables | Frequency according to body mass index (percentage) | p-value | ||
| Normal or low | Overweight | Obesity | ||
| Gender | ||||
| Masculine | 350 (89,0) | 553 (94,4) | 218 (97,3) | <0,001 |
| Feminine | 43 (11,0) | 33 (5,6) | 6 (2,7) | |
| Age (years) | 29,0 (7,6) | 34,1 (9,3) | 37,6 (9,8) | <0,001 |
| Exam type | ||||
| Entrance | 342 (87,0) | 479 (81,7) | 194 (86,6) | 0,025 |
| Annual | 18 (4,6) | 51 (8,7) | 19 (8,5) | |
| Retirement | 33 (8,4) | 56 (9,6) | 11 (4,9) | |
| Type of Worker | ||||
| Administrative | 48 (12,3) | 54 (9,3) | 16 (7,1) | 0,096 |
| Laborer | 343 (87,7) | 530 (90,8) | 208 (92,9) | |
| Born in Piura | 252 (64,6) | 362 (62,0) | 132 (58,9) | 0,368 |
| Place of birth | ||||
| North | 314 (80,5) | 446 (76,4 | 172 (76,8) | 0,710 |
| Center | 65 (16,7) | 112 (19,2) | 44 (19,6) | |
| South | 7 (1,8) | 19 (3,3) | 5 (2,2) | |
| Foreigner | 4 (1,0) | 7 (1,2) | 3 (1,3) | |
| Residing in Piura | 270 (68,9) | 387 (66,0) | 147 (65,9) | 0,611 |
| Place of residence | ||||
| North | 309 (78,8) | 428 (73,0) | 174 (78,0) | 0,386 |
| Center | 79 (20,2) | 144 (24,6) | 44 (19,7) | |
| South | 3 (0,8) | 11 (1,9) | 4 (1,8) | |
| Foreigner | 1 (0,3) | 3 (0,5) | 1 (0,5) | |
p-value was obtained with chi square for gender, exam type and type of worker, in addition Analysis of variance (ANOVA) was used for age.
DISCUSSION
Overweight and obesity are directly related to the short-term and long-term increase in pathologies. Sleep apnea can be produced in the short-term23, musculoskeletal alterations can be produced in medium to long-term time frame, since the body supports the greater joint pressure in the spine23; and knees26for a long period of time. Likewise, there exists a relationship between obesity and coronary disease27.
The physio-anthropometric parameters showed differences in their median values, which is logical since BMI is actually a measure that adequately classifies the subjects according to their weight, which allows this division to be in agreement with the physiology of the subjects evaluated, a research performed on first level attention medical personnel in the region of Aguascalientes found differences existed according to their cardiovascular risk28.
There were differences in the workers’ gender, there were more overweight men than women (49.3% vs 40.2%) and more obese (19.5% vs 7.3%), similar results to those found by Ramón Arbués et al with respect to overweight in which men have a greater prevalence (45.2% in men and 24.8% in women), and this difference persisted in obesity cases (15.9% in men and y 8.7% in women) in a group of 23729 community workers of Aragon31. In another health group13, Myers et al found that 28% of dentists were overweight and 7% obese13. We also found statistically significant differences in age and exam type, due to physiological changes that originate as people increase in age and work seniority, as another local study shows, where we observe that workers with over 30 years of age have greater cardiovascular risks compared to younger workers29, another Peruvian report showed that age is a very influential in metabolic syndrome among miner workers30. This may be important for follow up in the male population, who are older and have longer time in the company, since they could be exposed to greater risks, reason why occupational medicine areas of each company should watch for the results and follow-up.
No statistical differences were found according to employee type, place of birth or residence, which agrees with a research performed by Proper et al., who found that those who work in commerce, industry, transportation, legislation and high administrative roles had frequencies only slightly higher than overweight (37% and 36%, respectively) and obesity (6.9% and 7.5%, respectively)21. All of this shows us that minimal differences exist between the work and residence subgroups, since some, due to their physical activity, generate a greater energy consumption, but in generating this, they also consume more food. We can also explain that no statistically significant differences were found between laborers and administrators because currently laborers do not engage in physical activity as in previous years; this due to the great technology that the industry now uses, which causes that physical exertion be reduced to the necessary minimum2. This is why monitoring programs should perform the follow-up equally to both work groups.
We were not able to study other variables because it was a retrospective study in which we used an already generated database, which made it impossible to manage other factors that could be just as important., as are measurements of other physiological and social parameters that may be important(13); furthermore, we performed a non-probability sampling and we counted with only one branch, however, the results presented were the first reported in this work population which include important work environment variables31 and that may serve as a basis for future research in this and other similar populations.
CONCLUSION
According to the population studied, we conclude that there exist statistically significant differences in the body mass index of workers according to their waist circumference and hip diameter, as well as, according to the laboratory exam values, the type of occupational exam, gender and worker age. We did not find differences in type of worker, place of birth or worker residence.
REFERENCES
1. Andersen LL, Izquierdo M, Sundstrup E. Overweight and obesity are progressively associated with lower work ability in the general working population: cross-sectional study among 10,000 adults. Int Arch Occup Environ Health. 2017;90(8):779-787. DOI :10.1007/s00420-017-1240-0. [ Links ]
2. Church TS, Thomas DM, Tudor-Locke C, Katzmarzyk PT, Earnest CP, Rodarte RQ, et al. Trends over 5 decades in US occupation-related physical activity and their associations with obesity. PloS One. 2011;6(5):e19657. DOI: 10.1371/journal.pone.0019657. [ Links ]
3. Melnyk BM, Hrabe DP, Szalacha LA. Relationships among work stress, job satisfaction, mental health, and healthy lifestyle behaviors in new graduate nurses attending the nurse athlete program: a call to action for nursing leaders. Nurs Adm Q. 2013;37(4):278-285. DOI: 10.1097/NAQ.0b013e3182a2f963. [ Links ]
4. Zabka JM, Lemon SC, Magner RP, Hale J. Lifestyle behaviours and weight among hospital-based nurses. J Nurs Manag. 2009;17(7):853-860. DOI: 10.1111/j.1365-2834.2008.00923.x. [ Links ]
5. Pappas NA, Alamanos Y, Dimoliatis ID. Self-rated health, work characteristics and health related behaviours among nurses in Greece: a cross sectional study. BMC Nurs. 2005;4(1):8. Disponible en: https://bmcnurs.biomedcentral.com/articles/10.1186/1472-6955-4-8. [ Links ]
6. Malinauskiene V, Leisyte P, Romualdas M, Kirtiklyte K. Associations between self-rated health and psychosocial conditions, lifestyle factors and health resources among hospital nurses in Lithuania. J Adv Nurs. 2011;67(11):2383-2393. DOI: 10.1111/j.1365-2648.2011.05685.x. [ Links ]
7. Robroek SJ, Schuring M, Croezen S, Stattin M, Burdorf A. Poor health, unhealthy behaviors, and unfavorable work characteristics influence pathways of exit from paid employment among older workers in Europe: a four year follow-up study. Scand J Work Environ Health. 2013;125-133. DOI: 10.5271/sjweh.3319. [ Links ]
8. Heponiemi T, Kouvonen A, Vänskä J, Halila H, Sinervo T, Kivimäki M, et al. Effects of active on-call hours on physicians' turnover intentions and well-being. Scand J Work Environ Health. 2008;356-363. DOI: 10.5271/sjweh.1278. [ Links ]
9. Kouvonen A, Kivimäki M, Väänänen A, Heponiemi T, Elovainio M, Ala-Mursula L, et al. Job strain and adverse health behaviors: the Finnish Public Sector Study. J Occup Environ Med. 2007;49(1):68-74. DOI: 10.1097/JOM.0b013e31802db54a. [ Links ]
10. Hannerz H, Albertsen K, Nielsen ML, Tüchsen F, Burr H. Occupational factors and 5-year weight change among men in a danish national cohort. Health Psychol. 2004;23(3):283. DOI: 10.1037/0278-6133.23.3.283. [ Links ]
11. Winston J, Johnson C, Wilson S. Barriers to healthy eating by National Health Service (NHS) hospital doctors in the hospital setting: results of a cross-sectional survey. BMC Res Notes. 2008;1(1):69. DOI: 10.1186/1756-0500-1-69. [ Links ]
12. Barcones-Molero MF, Sánchez-Villegas A, Martínez-González MA, Bes-Rastrollo M, Martínez-Urbistondo M, Santabárbara J, et al. Influencia de la obesidad y la ganancia de peso sobre la calidad de vida según el SF-36 en individuos de la cohorte dinámica Seguimiento Universidad de Navarra. Rev Clínica Esp. 2018;218(8):408-16. DOI: 10.1016/j.rce.2018.05.005. [ Links ]
13. Myers HL, Myers LB. "It's difficult being a dentist": stress and health in the general dental practitioner. Br Dent J. 2004;197(2):89-93. DOI: 10.1038/sj.bdj.4811476. [ Links ]
14. Rosmond R, Björntorp P. Occupational status, cortisol secretory pattern, and visceral obesity in middle-aged men. Obes Res. 2000;8(6):445-50. DOI: 10.1038/oby.2000.55. [ Links ]
15. Baranski B, Boczkowski A. Socio-demographic determinants of self-assessed health status and health complaints in the population employed in a large institution. Med Pr. 2009;60(4):289-301. Disponible en: https://www.ncbi.nlm.nih.gov/pubmed/19928429 [ Links ]
16. Caban AJ, Lee DJ, Fleming LE, Gómez-Marín O, LeBlanc W, Pitman T. Obesity in US workers: The national health interview survey, 1986 to 2002. Am J Public Health. 2005;95(9):1614-1622. DOI: 10.2105/AJPH.2004.050112 [ Links ]
17. Belkic K, Nedic O. Workplace stressors and lifestyle-related cancer risk factors among female physicians: Assessment using the Occupational Stress Index. J Occup Health. 2007;49(1):61-71. DOI: 10.1539/joh.49.61 [ Links ]
18. Welch R, Boorman S, Golding JF, Towell T, Roberts R. Variations in self-reported health by occupational grade in the British Post Office: The Q-health project. Occup Med. 1999;49(8):491-7. Disponible en: https://academic.oup.com/occmed/issue/49/8 [ Links ]
19. Yeary KHK, Chi X, Lensing S, Baroni H, Ferguson A, Su J, et al. Overweight and Obesity Among School Bus Drivers in Rural Arkansas. Prev Chronic Dis. 16 de 2019;16:E61. DOI: 10.5888/pcd16.180413 external icon [ Links ]
20. Mummery WK, Schofield GM, Steele R, Eakin EG, Brown WJ. Occupational sitting time and overweight and obesity in Australian workers. Am J Prev Med. 2005;29(2):91-7. DOI: 10.1016/j.amepre.2005.04.003 [ Links ]
21. Proper KI, Hildebrandt VH. Overweight and obesity among Dutch workers: differences between occupational groups and sectors. Int Arch Occup Environ Health. 2010;83(1):61. DOI: 10.1007/s00420-009-0438-1 [ Links ]
22. World Health Organization. Instrumento STEPS (Internet). 2015. Disponible en: https://www.who.int/ncds/surveillance/steps/instrument/es/ [ Links ]
23. Carrillo A, Mahecha-Matsudo S, Droppelmann D, Belén Fernández M, Yáñez D, Fernández V. Riesgo de apnea obstructiva del sueño y nivel de actividad física y su asociación con riesgo cardiovascular elevado en adultos chilenos. Rev Chil Enfermedades Respir. 2019;35(1):22-32. DOI: 10.4067/S0717-73482019000100022 [ Links ]
24. Rihn JA, Kurd M, Hilibrand AS, Lurie J, Zhao W, Albert T, et al. The influence of obesity on the outcome of treatment of lumbar disc herniation: analysis of the Spine Patient Outcomes Research Trial (SPORT). J Bone Joint Surg Am. 2013;95(1):1. DOI: 10.2106/JBJS.K.01558 [ Links ]
25. Conforme WAD, López JJA, Rodríguez LEB, Trujillo SES. Lumbalgia inespecífica. Dolencia más común de lo que se cree. RECIMUNDO Rev Científica Investig El Conoc. 2019;3(2):3-25. DOI: 10.26820/recimundo/3.(2).abril.2019.3-25 [ Links ]
26. Rubin DI. Epidemiology and risk factors for spine pain. Neurol Clin. 2007;25(2):353-371. DOI: 10.1016/j.ncl.2007.01.004 [ Links ]
27. Coggon D, Croft P, Kellingray S, Barrett D, McLaren M, Cooper C. Occupational physical activities and osteoarthritis of the knee. Arthritis Rheum Off J Am Coll Rheumatol. 2000;43(7):1443-49.DOI: 10.1002/1529-0131(200007)43:7 <1443::AID-ANR5>3.0.CO;2-1 [ Links ]
28. Mejía CR, Merino PA, Mescua L, Gomero R. Notificación de accidentes mortales en el sector de minería Peruana, 2000-2014. Accidentes mortales en minería peruana. Arch Med. 2015;11(4):11. Disponible en: https://www.archivosdemedicina.com/medicina-de-familia/notificacin-de-accidentes-mortales-enel-sector-de-minera-peruana-20002014accidentes-mortales-en-minera-peruana.php?aid=8058 [ Links ]
29. González P, Rosa S. Nivel de riesgo cardiovascular global con la escala de Framingham en la población de médicos de la UMF 8 del IMSS Delegación Aguascalientes. 2019; Disponible en: http://bdigital.dgse.uaa.mx:8080/xmlui/handle/11317/1693 [ Links ]
30. Arbués E-R, Martínez-Abadía B, Gracía-Tabuenca T, Yuste-Gran C, Pellicer-García B, Juárez-Vela R, et al. Prevalencia de sobrepeso/obesidad y su asociación con diabetes, hipertensión, dislipemia y síndrome metabólico: estudio transversal de una muestra de trabajadores en Aragón, España. Nutr Hosp. 2019;36(1):51-59. DOI : http://dx.doi.org/10.20960/nh.1980 [ Links ]
31. Mejia CR, Chacón JI, Cavero M, Orihuela R, Orihuela E. Factores sociolaborales asociados al riesgo cardiovascular según el score de Framingham en trabajadores de Lima, 2015. Rev Argent Endocrinol Metab. 2016;53(3):84-9. Disponible en: http://www.scielo.org.ar/scielo.php?script=sci_abstract&pid=S1851-30342016000300002 [ Links ]
Received: March 14, 2020; Accepted: April 17, 2020
 Este es un artículo publicado en acceso abierto bajo una licencia Creative Commons
