


Services on Demand
Journal

Article
 text in
  English (pdf)
 Article in xml format
 Article references
 Send this article by e-mail
Indicators
-
 Cited by SciELO
Related links
-
 Similars in
SciELO
Similars in
SciELO
Share

 Permalink
Revista de la Facultad de Medicina Humana
Print version ISSN 1814-5469On-line version ISSN 2308-0531
Rev. Fac. Med. Hum. vol.20 no.3 Lima Jul-Sep 2020
http://dx.doi.org/10.25176/rfmh.v20i3.2968
Original article
Association between hypoalbuminemia and hypophosphatemia with malnutrition in patients with chronic renal disease undergoing hemodialysis
1Hospital Nacional Guillermo Almenara Irigoyen. Lima, Perú.
2Instituto de Investigación en Ciencias Biomédicas, Universidad Ricardo Palma. Lima, Perú.
Introduction:
Malnutrition in hemodialysis patients is a consequence of various deficiency and hypercatabolic factors and constitutes a risk factor for morbidity and mortality.
Objective:
Determine the association between hypoalbuminemia and hypophosphatemia with the Subjective global assessment (SGA) C in patients with chronic renal disease on hemodialysis.
Methods:
Analytical cross-sectional study. Patients from the hemodialysis service of the Hospital Guillermo Almenara were studied. The Kruskal-Wallis test and multiple comparisons test were used for the association between continuous variables of malnutrition and the types of SGA. The square-chi test was used for the categorical variables hypoalbuminemia (≤3.5 g/dL) and hypophosphatemia (<3 mg/dL). The association with SGA C was analyzed.
Results:
131 patients were included and the median age was 63 years. 34% had hypoalbuminemia, 27% had hypophosphatemia and 14% had SGA C. 52% (68) of the patients presented alteration of at least one analyzed biomarker. Differences were found between SGA and albumin (p<0.001) and phosphorus (p=0.040). Patients with SGA C had a mean albumin of 3.1±0.74 and phosphorus of 2.88±1.54 and had a significant difference compared to those with SGA A (p<0.001 and P = 0.011, respectively). Chi-square analysis also demonstrated a significant association between SGA and hypoalbuminemia (p = 0.017) and hypophosphatemia (p=0.050).
Conclusion:
There is an association between SGA C and hypoalbuminemia and hypophosphatemia in patients with chronic kidney disease undergoing hemodialysis.
Keywords: Hypoalbuminemia; Hypophosphatemia; Malnutrition; Dialysis. (Source: MeSH NLM)
INTRODUCTION
Patients undergoing hemodialysis therapy are at increased risk of death and malnutrition. Protein-energy or Protein Calorie malnutrition is a pathological condition with loss of muscle and fat tissue. It is usually associated with clinical syndromes such as Marasmus, where sarcopenia develops gradually with worsening of anthropometric measurements; Kwashiorkor, where hypercatabolism predominates in the context of protein malnutrition; or a mix of these two conditions. Although weight loss is characteristic in malnutrition in the patient undergoing hemodialysis therapy, muscle tissue loss may coexist with the increase in extracellular fluid, so weight loss is not a highly specific indicator. On the other hand, factors that reduce the intake and increase the loss of nutrients during hemodialysis are anorexia, restrictive diets, the loss of 5 to 8 grams of amino acids per hemodialysis session, and the oral fragility of the elderly edentulous1,2,3.
The protein-energy wasting syndrome was introduced in 2007 by the International Society of Renal Nutrition and Metabolism, described as a disorder of catabolism. It is a product of metabolic and nutritional alteration of chronic kidney disease (CKD), has reported prevalence in hemodialysis between 28 and 54%4. Their diagnostic criteria need to meet at least one in three of four categories: biochemical (low level of albumin, transthyretin or pre-albumin, or cholesterol), reduced body mass (reduced body mass index or fat or weight loss), reduced muscle mass and decreased protein-calorie intake5,6. These criteria affect CKD patients, but present low reproducibility in our environment. They are perhaps in relation to the analysis not performed like transthyretin, unavailability and bias of bioelectrical impedance analysis to estimate the muscle and fat, the disuse of the anthropometric measurements, and the non-realization of calculations. Other calculations like dietary protein, which require surveys such as the 24-hour recall conducted by a nutritionist are not done extensively. The proposed approach ceases to be practical. Also, inadequate sensitivity to diagnostic criteria has been reported in dialysis populations7,8. However, the definition of protein-energy wasting syndrome in hemodialysis allows for a better pathophysiological understanding of the process of malnutrition linked to inflammation, which includes nonspecific processes such as metabolic acidosis, insulin resistance, increased oxidative stress, activation of system, ubiquitin-proteasome proteolytic and uremic toxins9-11.
Therefore, to identify the current state of malnutrition, we use other tools validated for the population with chronic kidney disease, such as the subjective global assessment (SGA). It allows the association with risk of mortality, has wide acceptance, and adequate reproducibility12. Among the biomarkers of malnutrition that allow for quick identification and correspond to the profile of our population. Hypoalbuminemia has been associated with a lower survival13,14and hypophosphatemia, which is a marker that is associated with malnutrition and is also associated with a higher risk of death from all causes13,15-18.
The study aimed to determine the association between hypoalbuminemia and hypophosphatemia with SGA C in patients with chronic renal disease on hemodialysis.
METHODS
Design and setting
The study design was cross-sectional, analytical, not experimental. The sample was obtained from patients with CKD undergoing hemodialysis therapy whose population belongs to the nephrology department of Hospital Guillermo Almenara.
Population and sample
Non-probability sampling was used. Patients over 18 years of age were included in 3-Session/week hemodialysis therapy. Those with sepsis, pregnant women, a morbid condition that does not allow the interview were excluded.
Variables and instruments
The clinical variables analyzed were gender, age, CKD etiology, time of hemodialysis, albumin, phosphorus, and SGA. The data collection instrument was performed using a standardized form through an interview with a review of the laboratory record analysis. The determination of albumin was by colorimetry with bromocresol green and phosphorus by spectrophotometry with molybdenum. All patients were dialyzed with high flow membrane, at least 3 hours 3 times/week with ultrapure water, and the calcium concentration in the dialysis solution was 1.75 mmol/L. The variables were expressed as mean and standard deviation (SD).
Procedure
The SGA is a tool for assessing nutritional status that evaluates 5 components of medical history (Weight Change, Diet, gastrointestinal symptoms, functional capacity and disease in relation to their nutritional requirements) and 3 components of the physical examination (loss of fat tissue, muscle, fluid balance changes). It defines well-nourished patients (SGA A), and malnourished patients (SGA B and C, with B moderately malnourished or at risk and C severely malnourished)12. This test has been validated in patients with chronic kidney disease and its detection of malnutrition is associated with mortality in dialysis patients19,20. In our country, SGA was used in a multicenter study of the Latin American Federation of Nutritional Therapy for the determination of malnutrition21.
Regarding biomarkers of malnutrition, the category of hypoalbuminemia less than or equal to 3.5 g / dL and hypophosphatemia less than 3 mg / dL was considered. The laboratory reference value for albumin at its lower limit is 3.8 g/dL by colorimetry with bromocresol green and some reports associate this value with malnutrition. The Kovesdy14study in its Cox regression supports a value of less than or equal to 3.5 g / dL associated with malnutrition and independent risk of mortality. Regarding phosphorus, a value <3 mg/dL was considered for the associative analysis due to the report of Kalantar15of more than 58 thousand patients, who studied the survival of patients with disorders of calcium, phosphorus, and parathormone. A value of less than 3 mg/dL adjusted for nutritional status variables was associated with a hazard ratio (HR) of mortality greater than 1 in patients undergoing hemodialysis therapy.
Statistical analysis
For the association between the continuous variables of malnutrition with non-normal distribution, the Kruskal Wallis test, and multiple comparison tests were used for the results with statistical significance. For categorical variables, the square chi test was used, the independent variable being SGA, and the dependent variables albumin and phosphorus. A descriptive evaluation of the prevalence of each biomarker should be carried out if any of them are present in normal values. The statistical software SPSS 25.0 was used.
RESULTS
A total of 131 hemodialysis patients were included. The mean age was 60 years (SD = ±5.9), 55% were male (72). 36.6% had diabetes, 19.8% had hypertension, 17.6% had no affiliation, 5.3% had glomerulonephritis, 3.8% had obstructive uropathy and the rest had less than 3% for each cause. The median time on hemodialysis was 4.6 years (SD = ±6). The characteristics and variables analyzed are shown intable 1.
Table 1. Descriptive characteristics of the hemodialysis patients studied.
| Parameters | Patients (n: 131) |
|---|---|
| Age (years) | 60 (DS=±15,9) |
| Hemodialysis time | 4,6 (DS=±6) |
| Albumin (mg / dl) | 3,6 (DS=±0,6) |
| Phosphorus (mg / dl) | 3,9 (DS=±2) |
| Subjective Global Assessment A | 38,2% (50) |
| Subjective Global Assessment B | 48,1% (63) |
| Subjective Global Assessment C | 13,7% (18) |
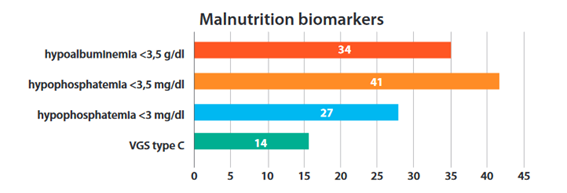
Regarding biomarkers, 34% of patients had hypoalbuminemia, 41% had hypophosphatemia, 27% had hypophosphatemia <3 mg / dL and 14% had a subjective global assessment C (Figure 1). It was evidenced that 52% (68) of the patients on hemodialysis presented at least one alteration (hypoalbuminemia, hypophosphatemia, or SGA C). We analyzed the mean calcium of 113 patients but included those who had hypophosphatemia, being 9.04 mg / dL (SD = ±0.84). Of the patients with hypophosphatemia <3 mg/dL, only 5% (2 patients) had calcium >10 mg / dL.
Regarding the descriptive and analytical analysis of the subjective global assessment with the continuous variables of albumin and phosphorus, this had a significant difference by Kruskal Wallis as shown in Table 2, where the time on hemodialysis was not associated with the SGA. Patients with a subjective global assessment C had albumin mean of 3.1 (SD=±0.74) and phosphorus mean of 2.88 (SD=±1.54).
Table 2. Analysis of the time (in years) of hemodialysis, albumin, and phosphorus according to levels of SGA.
| VGS | Time HD* | Albumin | Phosphorus | ||||||
| Mean | DS | Value of p** | Mean | DS | Value of p** | Mean | DS | Value of p** | |
| A | 3,95 | 5,79 | 0,635 | 3,90 | 0,48 | <0,001 | 4,19 | 2,05 | 0,040 |
| B | 4,32 | 5,45 | 3,60 | 0,48 | 3,94 | 1,91 | |||
| C | 7,43 | 8,07 | 3,13 | 0,74 | 2,88 | 1,54 | |||
*Hemodialysis time (in years) **Kruskal Wallis test
Considering the significant difference reported for the different types of SGA, we performed the statistical test of multiple comparisons (post hoc), reporting that the values of albumin in the group with an SGA C (malnourished, severe) differed significantly from the values of albumin from the group with SGA type (well-nourished) (p<0.001), with type B (p=0.027, as well as between A and B (p= 0.007). Similarly, phosphorus values in the group with SGA C differ from those of Type A (p=0.011), but not with Type B (P=0.057), nor between Type A and B (p=0.322), so the significant difference for both biomarkers occurs with SGA C. As for the chi-square analysis considering hypoalbuminemia and hypophosphatemia as categorical variables, a significant association with SGA was also demonstrated (p = 0.017 and P = 0.050, respectively), as shown intable 3.
Table 3. Analysis of the SGA with the categories of hypoalbuminemia and hypophosphatemia
| Overall Subjective Assessment | Total | Value p* | |||
|---|---|---|---|---|---|
| A | B | C | |||
| Albumin | |||||
| ≤ 3,5 mg/dL | 12 (25,5%) | 24 (51,1%) | 11 (23,4%) | 47 | 0,017a |
| >3.5 mg/dL | 38 (45,2%) | 39 (46,4%) | 7 (8,3%) | 84 | |
| Phosphatemia | A | B | C | ||
| <3 mg/dL | 10 (27,8%) | 17 (47,2%) | 9 (25%) | 36 | 0,050b |
| ≥3 mg/dL | 40 (42,1%) | 46 (48,4%) | 9 (9,5%) | 95 | |
| Total | 50 (38,2%) | 63 (48,1%) | 18 (13,7%) | 131 | |
*Chi- Pearson's square
a. 0 cells (0.0%) have expected a count less than 5. The minimum expected count is 6.46.
b. 1 cells (16.7%) have expected a count less than 5. The minimum expected count is 4.95.
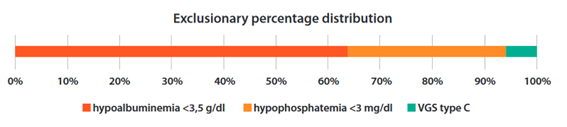
Considering that hypoalbuminemia was the most frequent alteration, followed by hypophosphatemia and then SGA C, its frequency was described in the same order, when the other markers had normal values. For example, when normoalbuminuria was present, 30% (N=21) of patients had hypophosphatemia and, if normoalbuminuria and normophosphatemia were present, 6% (n=4) had SGA C, as shown inFigure 2.
DISCUSSION
The nutritional status of patients undergoing hemodialysis therapy is a predictor of morbidity and mortality, so its identification is important. There are deficiency factors added to hypercatabolism that actively and progressively affect their condition. Albumin is a widely recognized biomarker and indicates a protein-energy deficiency state that does not replace the increase in metabolic demand. Although it is recognized for its sensitivity, it is not specific, since hypoalbuminemia is recognized with a negative acute phase reagent. As a result, it decreases in inflammatory processes as septic and, therefore, this characteristic was excluded in the sample. Pre-albumin is also used as a marker, due to its short Half-Life of 2 to 3 days, compared to 20-day albumin due to its correlation of current status, however, this characteristic is of little use in the identification of an active and chronic process in hemodialysis such as malnourishment1. The main difficulty with these markers is their reduced negative predictive value, so a normal value does not necessarily exclude the disease. Considering this background, the assessment of malnutrition requires complementary biomarkers that are of practical use to be able to intervene early in patients. The selection of hypoalbuminemia ≤3.5 g/dL is important because it is also associated with an independent risk of mortality. The results of this study found that it was the most prevalent biomarker of malnutrition, being found in 68% of patients in the context of chronic kidney disease undergoing hemodialysis. In this report, the analysis as a continuous variable had a value of albumin of 3.1 g/dL in patients with SGA C, having been reported by Kovesky14, an association as a continuous variable of 3.6 g/dl of albumin together with other biomarkers of malnutrition (lymphocytes and leukocytes) and a value of 3.2 g/dL to be associated with three biomarkers of malnutrition in patients with chronic kidney disease.
Hypophosphatemia is a biomarker, referred to in the literature, of lower sensitivity, since patients on hemodialysis may develop hyperphosphatemia, which separates patients into two groups, in those who suffer from Bone Mineral Disorder with hyperparathyroidism and hyperphosphatemia and, which reflects a higher protein and phosphate intake and, on the other hand, those who due to the protein deficiency is developing hypophosphatemia. This will depend on the population analyzed. In the Dialysis Outcomes and Practice Patterns Study (dopps) report, which analyses patients from the United States, France, Germany, Italy, Japan, Spain, and the United Kingdom, the prevalence of hyperphosphatemia was 57.9%18. In our reality, on the other hand, the National report22of hyperphosphatemia is 24.2% and the prevalence of malnutrition in our reality indicates that it is a biomarker to be taken into account. Its low specificity is another difficulty. Since the hypophosphatemia in hemodialysis may be associated with high blood calcium levels, which is reported in 29.6% of patients Nacional report22and that can be associated with a concentration of high calcium levels in the dialysis solution as in the present study. It was reported hypercalcemia only in 5% of patients with hypophosphatemia. Also, hypophosphatemia can be reduced by the use of phosphorus chelators but is usually discontinued when the patient has hypophosphatemia. Despite these considerations, in the context of reduced protein intake, it becomes a useful biomarker and is also associated with mortality18. In our report, in patients with chronic kidney disease, the prevalence of hypophosphatemia was high and was associated with SGA C. In clinical practice, the evaluation of hypoalbuminemia and hypophosphatemia in isolation can be misinterpreted and its importance in malnutrition is established when physical examination parameters are identified subjectively, as performed with the SGA test.
Physical examination and functional capacity, assessed by means of SGA, are relevant characteristics in the assessment of malnourished patients, adding that dialysis patients have markedly reduced physical activity that affects their muscular trophism. It has been reported that a reduction in the muscle mass and strength of the dialysis patient is associated with a worsening of survival in a 5-year follow-up with HR 1.93 (95% CI 1.01-3.73)23. SGA C, in particular, indicates a severe malnourished patient, its association with the other biomarkers is plausible, although it does not necessarily occur if the sensitivity of the other biomarkers with normal values24is affected. Other tools reported for assessing nutritional status will be bioimpedance, however, its difficulty will be its positive predictive value, since it can underestimate the measurement of extracellular water after dialysis up to 30% and, consequently, the calculation of lean tissue24. This overestimation of malnutrition occurs due to the change of electrolytes post dialysis and can affect the estimation of extracellular and intracellular water; moreover, its use is not routine and has not proven to be an indispensable tool but complementary. The biomarkers studied, on the other hand, allow a timely identification for early intervention, having reported the effect of the intervention since the SGA on the reduction of mortality in hemodialysis20.
REFERENCES
1. Cohen SD, Kimmel PL, Nutritional status, psychological issues and survival in hemodialysis patients. Contrib Nephrol. 2007;155:1-17. DOI: 10.1159/000100952 [ Links ]
2. Hanafusa N, Tsuchiya K, Nitta K, Malnutrition-Wasting Conditions in Older Dialysis Patients: An Individualized Approach. Contrib Nephrol. 2019;198:12-20. DOI: 10.1159/000496304 [ Links ]
3. Bailey JL, Franch HA, Nutritional considerations in kidney disease: Core Curriculum 2010, Am J Kidney Dis. 2010 Jun;55(6):1146-61. DOI: 10.1053/j.ajkd.2010.02.345 [ Links ]
4. Carrero JJ, Thomas F, Nagy K, et al, Global Prevalence of Protein-Energy Wasting in Kidney Disease: A Meta-analysis of Contemporary Observational Studies From the International Society of Renal Nutrition and Metabolism. J Ren Nutr. 2018 Nov;28(6): 380-392. DOI: 10.1053/j.jrn.2018.08.006. [ Links ]
5. Fouque D, Kalantar-Zadeh K, Kopple J, et al, A proposed nomenclature and diagnostic criteria for protein-energy wasting in acute and chronic kidney disease, Kidney International 2008; 73: 391-398. DOI: 10.1038/sj.ki.5002585. [ Links ]
6. Obi Y, Qader H, Kovesdy CP, et al, Latest consensus and update on protein-energy wasting in chronic kidney disease, Curr Opin Clin Nutr Metab Care 2015;18(3):254-62. DOI: 10.1097/MCO.0000000000000171. [ Links ]
7. Gracia-Iguacel C, González-Parra E, Mahillo I, Criteria for classification of protein-energy wasting in dialysis patients: impact on prevalence, Br J Nutr. 2019 Jun;121(11):1271-1278. DOI: 10.1017/S0007114519000400. [ Links ]
8. Leinig CE, Moraes T, Ribeiro S, Predictive value of malnutrition markers for mortality in peritoneal dialysis patients, J Ren Nutr 2011; 21(2):176-83. DOI: 10.1053/j.jrn.2010.06.026 [ Links ]
9. Hanna R, Ghobry L, Wassef O, A Practical Approach to Nutrition, Protein-Energy Wasting, Sarcopenia, and Cachexia in Patients with Chronic Kidney Disease, Blood Purif 2020;49:202-211. DOI: 10.1159/000504240 [ Links ]
10. Gracia-Iguacel C, González-Parra E, Barril-Cuadrado G, Definiendo el síndrome de desgaste proteico energético en la enfermedad renal crónica: prevalencia e implicaciones clínicas, Nefrología 2014;34(4): 507-19. DOI: 10.3265/Nefrologia.pre2014.Apr.12522 [ Links ]
11. Raj DS, Sun Y, Tzamaloukas AH, Hypercatabolism in dialysis patients, Current Opinion in Nephrology and Hypertension 2008, 17: 589-594. DOI: 10.1097/mnh.0b013e32830d5bfa [ Links ]
12. Steiber AL, Kalantar-Zadeh K, Secker D, Subjective Global Assessment in chronic kidney disease: a review, J Ren Nutr 2004;14(4):191-200. DOI: 10.1053/j.jrn.2007.05.004 [ Links ]
13. Oliveira T.S., Valente A.T., Caetano C.G., et al, Nutritional parameters as mortality predictors in haemodialysis: Differences between genders, Journal of Renal Care 2017, 20(11): 1-9. DOI: 10.1111/jorc.12201 [ Links ]
14. Kovesdy C, George S, Anderson J, Outcome predictability of biomarkers of protein-energy wasting and inflammation in moderate and advanced chronic kidney disease, Am J Clin Nutr 2009; 90: 407-14. DOI: 10.3945/ajcn.2008.27390 [ Links ]
15. Kalantar-Zadeh K, Kuwae N, Regidor DL, et al, Survival predictability of time-varying indicators of bone disease in maintenance hemodialysis patients, Kidney Int. 2006; 70(4):771-80. DOI: 10.1038/sj.ki.5001514 [ Links ]
16. Shinaberger CS, Greenland S, Kopple JD, et al, Is controlling phosphorus by decreasing dietary protein intake beneficial or harmful in persons with chronic kidney disease?, Am J Clin Nutr. 2008; 88(6):1511-8. DOI: 10.3945/ajcn.2008.26665. [ Links ]
17. Garagarza c, Ana Valente A, Caetano C, Hypophosphatemia: nutritional status, body composition, and mortality in hemodialysis patients, Int Urol Nephrol. 2017; 49(7):1243-1250. DOI: 10.1007/s11255-017-1558-2 [ Links ]
18. Tentori F, Blayney MJ, Albert JM, et al, Mortality risk for dialysis patients with different levels of serum calcium, phosphorus, and PTH: the Dialysis Outcomes and Practice Patterns Study (DOPPS). Am J Kidney Dis. 2008; 52(3):519-30. DOI: 10.1053/j.ajkd.2008.03.020. [ Links ]
19. Steiber A, Leon JB, Secker D, Multicenter study of the validity and reliability of subjective global assessment in the hemodialysis population, J Ren Nutr. 2007;17(5):336-42. DOI: 10.1053/j.jrn.2007.05.004 [ Links ]
20. Kwon YE, Kee YK, Yoon CY, Han IM, Change of Nutritional Status Assessed Using Subjective Global Assessment Is Associated With All-Cause Mortality in Incident Dialysis Patients, Medicine (Baltimore). 2016; 95(7): e2714. DOI: 10.1097/MD.0000000000002714 [ Links ]
21. Correia M, Campos A, Prevalence of Hospital Malnutrition in Latin America: The Multicenter ELAN Study, Nutrition 2003;19:823-5. DOI: 10.1016/s0899-9007(03)00168-0 [ Links ]
22. Informe del Registro Nacional de Diálisis (Rendes) - Essalud 2016. Subsistema De Vigilancia De Salud Renal (Visare), Oficina de Evaluación, Control e Inteligencia Sanitaria Centro Nacional de Salud Renal. Disponible en: https://www.spn.pe/archivos/ANALISIS%20DE%20LA%20SITUACION%20DE%20LA%20ENFERMEDAD%20RENAL%20CRONICA%20EN%20%20EL%20PERU%20(1).pdf [ Links ]
23. Isoyama N, Qureshi AR, Avesani CM, et al, Comparative associations of muscle mass and muscle strength with mortality in dialysis patients, Clin J Am Soc Nephrol. 2014 Oct 7;9(10):1720-8. DOI: 10.2215/CJN.10261013 [ Links ]
24. Espahbodi F, Khoddad T, Esmaeili L, Evaluation of malnutrition and its association with biochemical parameters in patients with end stage renal disease undergoing hemodialysis using subjective global assessment, Nephrourol Mon. 2014; 15,6(3):e16385. DOI: 10.5812/numonthly.16385 [ Links ]
25. Jaeger J, Mehta R, Assessment of Dry Weight in Hemodialysis: An Overview, J Am Soc Nephrol 1999;10(2): 392-403,. Disponible en: https://pubmed.ncbi.nlm.nih.gov/10215341/ [ Links ]
Received: May 01, 2020; Accepted: June 04, 2020
 Este es un artículo publicado en acceso abierto bajo una licencia Creative Commons
