


Servicios Personalizados
Revista

Articulo
 texto en
  Inglés (pdf)
 Articulo en XML
 Referencias del artículo
 Enviar articulo por email
Indicadores
-
 Citado por SciELO
Links relacionados
-
 Similares en
SciELO
Similares en
SciELO
Compartir

 Permalink
Revista de la Facultad de Medicina Humana
versión impresa ISSN 1814-5469versión On-line ISSN 2308-0531
Rev. Fac. Med. Hum. vol.21 no.1 Lima ene-mar 2021
http://dx.doi.org/10.25176/rfmh.v21i1.3069
Review article
Cross-sectional studies
1Instituto de Investigación en Ciencias Biomédicas, Universidad Ricardo Palma, Lima, Perú.
2Universidad Continental, Lima, Perú.
3Departamento de Medicina. Hospital Nacional Hipólito Unanue, Lima, Perú
4Servicio de Geriatría. Hospital Nacional Hipólito Unanue, Lima, Perú
5Facultad de Medicina Humana, Universidad Ricardo Palma, Lima-Perú.
Cross-sectional studies are epidemiological design which can be considered as descriptive or analytical designs depending on the general objective. This is a quickly and economical design and allows to calculate the prevalence of a condition. Also, the relationship of temporality between the exposition and the outcome is being measured simultaneously on a unique period, not being possible to identify a directionality in the temporality. When there is an analytic objective, the association measure used is the Prevalence Ratio (PR), specially when the prevalence of the outcome is more or equal to 10% or the Odds Ratio (OR) when that prevalence is lower. To quantify this association different regression models like Binomial log or Poisson log can be used, including generalized lineal models. If the association measure is OR, the most common used model is the multiple logistic regression.
Key words: Cross-sectional; Observational; Analytic; Design; Studies. (Source: MeSH NLM)
INTRODUCTION
Observational studies are defined on the basis of the absence of intervention by the researcher in the outcome to be evaluated. These designs can be descriptive, in which cross-sectional studies and descriptive cohort studies are included. They can also be analytical, in which case-control studies, classic cohort studies and cross-sectional studies1are included. In contrast to longitudinal studies that involve follow-up over time, the defining feature of a cross-sectional study is that it can do the research at a single point in time. Traditionally, cross-sectional studies have been considered useful for determining the prevalence of a condition, hence they are also known as “prevalence studies”. However, they can also evaluate the association between two or more variables, meaning having an analytical approach2. This is an attractive alternative for exploring associations in advance or in scenarios with limited resources.
To understand this idea, we must be very clear about the notion of temporality between the independent variable or covariate as appropriate, and the dependent variable (outcome). While in cohort-type analytical observation designs, temporality indicates a direction from exposure to outcome, and in case-control studies, direction from outcome to exposure; in cross-sectional studies with analytical objectives, exposure and outcome are measured simultaneously3. Therefore, it is also understood that the cross-sectional direction corresponds to a single measurement in a period of time, and that in this context, we plan to analyze the association relationship between the variables.
Moreover, in the scientific literature these studies are referred to as cross-sectional studies without making a distinction between descriptive and analytical, and identifying such distinction from the general objective of the study. However, for educational and undergraduate training purposes, it might be possible to make this distinction always highlighting its usefulness and indicating its appropriate use in the literature.
MEASURES OF ASSOCIATION
The traditional measure of association of analytical cross-sectional studies is the Odds Ratio (OR). However, the Prevalence Ratio (PR), which is defined in terms of “how many times are exposed individuals more likely to have the disease or condition than unexposed individuals”4, has been increasingly used in recent years. In the following, we will show the mathematical similarity of PR with the Relative Risk (RR), starting with the second one. Let Y be the outcome and X, the exposure factor. The graph is illustrated in a 2x2 table (Figure 1):
| Outcome Y | ||||
|---|---|---|---|---|
| Yes (+) | No (-) | |||
| Exposure to factor X | Yes | A | b | |
| No | C | d | ||
Figure 1. 2x2 table for the calculation of RR of an outcome Y from exposure to a factor X
In the calculation of the RR which corresponds to the cohort designs, the risk of a new case of outcome Y after exposure to a factor X is calculated, so the RR will be calculated from the cumulative incidence5,6of the outcome Y (Iexp) in the exposed group comparing it with the cumulative incidence in the unexposed group (Ino exp). This is shown below:
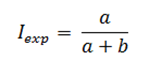
The cumulative incidence in exposed individuals (Iexp) based on figure 1 will be calculated as follows:
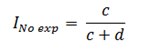
The cumulative incidence in unexposed individuals (Ino exp) based on figure 1 will be calculated as follows:
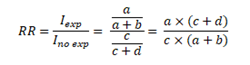
Finally, the RR will be calculated from the ratio of the cumulative incidence in exposed individuals to the cumulative incidence in unexposed individuals:
Once this has been clarified, we will proceed with the calculation of the PR showing the mathematical similarity with the RR. Before illustratingFigure 2, it is crucial to understand that based on an epidemiological criterion, Cohort studies are related to cumulative incidence, that is, new cases of a certain disease. In contrast, cross-sectional studies are not linked to this notion but to the frequency or prevalence of an event using the total number of cases (new and old) within a single measure. Let the outcome Y and the exposure to a factor X be measured simultaneously in a single moment. The graph is shown in a 2x2 table (Figure 2):
| Outcome Y | ||||
|---|---|---|---|---|
| Yes (+) | No (-) | |||
| Exposure to factor X | Yes | A | b | |
| No | C | d | ||
Figure 2. 2x2 table for the calculation of PR of an outcome Y from exposure to a factor X both simultaneously measured.
In the PR calculation, the ratio of the prevalence of outcome Y, in the group where the factor X (Pexp) is present, over the ratio of the prevalence of outcome Y, in the group where the factor X (Pno exp) is not present, is calculated. Therefore:
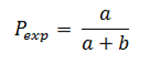
The prevalence of outcome Y in the group where the factor X is present, both simultaneously measured (Pexp) based onFigure 2will be calculated as follows:
The prevalence of outcome Y in the group where the factor X is not present, both simultaneously measured (Pexp), based onFigure 2will be calculated as follows:
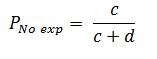
Finally, the PR will be calculated from the ratio of the prevalence in exposed individuals to the prevalence in unexposed individuals:
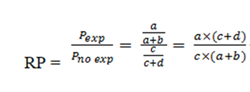
Therefore, the mathematical formula for both cases is the same but the epidemiological concepts are not the same. While in the cohort studies the RR uses the cumulative incidence, in the PR the prevalence is used.
Having explained this, we introduce the following concept: the measure of association in a cross-sectional study can be either the PR or OR (traditionally used in case-control studies) and the choice of the best measure of association depends on the initial observation of the outcome prevalence in the study.
Based on the observation of the prevalence of outcome, there are several reports in the academic literature that estimate a valid cut-off point for selecting the use of PR or OR, considering that above this cut-off point, the use of OR would overestimate PR, a similar concept to the one used in the RR4,7. It is considered that from an outcome prevalence greater than or equal to 10%, the PR should be used as an appropriate measure of association for the cross-sectional study since if the OR is used, the value of the PR would be overestimated8. Below 10% the OR may be used; however, the use of PR is recommended for cross-sectional studies with analytical purposes8-10.Figure 3is illustrated below. Although it was originally designed to compare OR vs. PR, it has already been explained that mathematically the calculation of RR and PR is similar, differing in its epidemiological interpretation, and therefore the outcome presented is valid and extrapolated for a comparison of OR vs. PR.
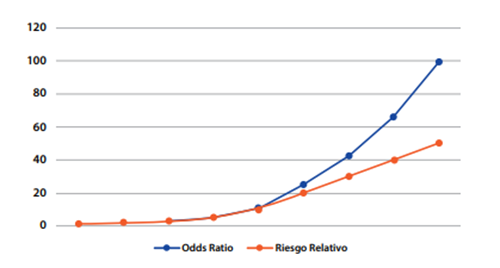
*Taken from: Soto A, Cvetkovic-Vega A. Estudios de casos y controles. Rev Fac Med Humana 2020, 20(1):138-43
Another criterion for defining the use of OR or PR is the possible cause-effect relationship between the variables. Thus, when there is a reasonable assumption about the variable considered as exposure and the variable considered as outcome, it is convenient to compare the prevalence of effect between exposed and non-exposed and to calculate the PR. When the causal relationship between the variables is not clear, the OR has the advantage of keeping the same numerical value regardless of its location in the contingency table. On the contrary, the PR will take different values depending on whether a variable is considered an exposure or an outcome.
To illustrate the previous concepts, let's compare some factors associated to early-onset neonatal sepsis from a prevalence of 30% of it and considering factors such as the gestational age, being an elderly pregnant woman, the prenatal controls and the premature rupture of membranes of more than 18 hours. Below, we provide the data obtained from a medical undergraduate thesis in which a comparison of the calculations of PR and OR in their crude (cPR and cOR) and adjusted (aPR and aOR) forms (Tabla 1) is made.
Table 1. Comparison between the PR and the OR in bivariate analysis
| Early-Onset Neonatal Sepsis | ||||
| Crude Prevalence Ratio (CI95%) | Crude Odds Ratio (CI95%) | Adjusted Prevalence Ratio (CI95% | Adjusted Odds Ratio (CI95%) | |
| Gestional age | 0,83 (0,76-0,9) | 0,71 (0,62-0,81) | 0,87 (0,8-0,96) | 0,76 (0,65-0,89) |
| Elderly pregnant woman | 1,64 (1,4-2,35) | 2,07 (1,2-3,55) | 1,77 (1,13-2,75) | 3,9 (1,91-8,01) |
| Adequacy of prenatal controls | 0,8 (0,76-0,85) | 0,66 (0,58-0,76) | 0,81 (0,74-0,89) | 0,62 (0,52-0,73) |
| Premature rupture of membranes >18h | 2,55 (1,82-3,58) | 4,69 (2,52-8,72) | 2,34 (1,5-3,68) | 7,95 (3,56-17,74) |
CI95%= Confidence Interval of 95%
For a prevalence of 30% for the outcome variable (early-onset neonatal sepsis), small differences, between the results of the PR and OR in their crude and adjusted forms for gestational age and the adequacy of prenatal controls, are observed. However, the difference increases when comparing the interval for aPR and aOR in the elderly pregnant woman variable. And it becomes clearer in the 18h premature rupture of membranes variable, where there is an evident overestimate when using the OR instead of the PR.
DESIGN CONSIDERATIONS
Statistical Efficiency
In a cross-sectional study, the notion of statistical efficiency is not applied since exposure and outcome are simultaneously measured.
Sample Size Calculation
It is important to understand that various formulas are used in the sample size for descriptive and analytical cross-sectional studies, since the former represent a single proportion (represented by the prevalence of an event) and the latter, two or more proportions (represented by the presence or absence of exposure to a factor and at a certain outcome).
For Descriptive Cross-Sectional Studies
In these studies, the sample size for a single proportion formula with a certain confidence level and margin of error is used. This formula can be solved and used in two contexts: for a population whose size is known and one whose size is not known11.
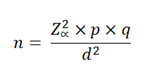
In the case of a population whose size is known, the formula to be used is:
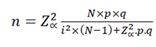
Where:
n: Sample size N: Population size p: Prevalence of the study event q: 1-p Zα: When α=0.05, the value in the Gaussian distribution is equal to 1,96 i: Error tolerance (When it is 95%, its value is of 5%).
In the case of a population whose size is unknown, the formula to be used is:
Where:
n: Sample size N: Population size p: Prevalence of the study event q: 1-p Zα: When α=0.05, the value in the Gaussian distribution is equal to 1,96 i: Error tolerance (When it is 95%, its value is of 5%).
For Analytical Cross-Sectional Studies
In this type of study there are different ways to calculate the sample size, for example by using prevalence ratios or through differences in proportions. In an academic and simple way, we will use the latter. The following is the general formula adapted and taking into accountFigure 2:
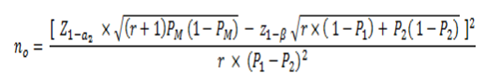
Figure 4. Statistical formula for sample size calculation in a mainly analytical target cross-sectional study
Where:
no: Total sample size
P1=Anticipated proportion of positive exposed
P2=Anticipated proportion of positive unexposed

r = ratio of negatives to positives in relation to the outcome Y
100(1-a) %: Confidence level
100 (1-β) %: Statistical power
When making this calculation, no refers to the total sample size which should be distributed between the group with positive Y-event and the group with negative Y-event following the calculated ratio. The reader is reminded that any sample size calculation can be done in a practical and simple way by using statistical programs and online platforms that have calculators for this purpose.
Choice of Positive and Negative Groups for an Outcome
In contrast to other studies, the criterion of selecting groups (similar to the criteria used in cases and controls) cannot be applied in these designs12since an entire population is examined; and the number of exposed and unexposed people, as well as the people with or without the outcome, is quantified.
STATISTICAL ANALYSIS
The calculation of PR as mentioned above is similar to the calculation of RR. For multivariate analysis in which the PR is adjusted to possible confounding variables, the PR for a certain relationship between variables along with their confidence interval and p-value can be calculated in different ways such as by Poisson regression with robust variances, or log-binomial regression(13). Another method is also generalized linear models with binomial family and log link function. When the use of OR is considered convenient, it is appropriate to use logistic regression.
ADVANTAGES AND DISADVANTAGES
As in any study, no design is perfect since it has limitations that must be properly identified. There is also a need to develop good research practice to communicate these limitations to other researchers, thus facilitating the understanding and replication of our study.
The cross-sectional studies with mainly analytical objectives are usually studies that provide preliminary evidence in relation to the investigation of the existence of associations between variables, considering them as the first step in the hierarchy of evidence in the group of analytical observational studies. The main limitation, which is also the main characteristic of this type of study, is the impossibility of determining a clear time sequence between the dependent variable and the independent variable(s) or covariates. This is due to the fact that the measurement of both types of variables is simultaneously done.
These studies are considered relatively simple and low cost, with easy and fast execution allowing to have a preliminary approach that can be useful for fast decision making. Another strength is that they are useful for measuring prevalence. However, it is important to consider classical biases such as selection or recall bias. Finally, it is worth noting that if 10% is not considered as a cut-off point for the frequency of the outcome and use of PR, it is likely that the measure of association is overestimated when using the OR, which was described previously.
CONCLUSION
Cross-sectional observational studies can be classified into descriptive or analytical studies based on the general objective of the study. The analytical studies have a research hypothesis in which the presence of an association between qualitative or quantitative variables is assessed. The main characteristic of this type of study is that both the outcome variable and exposure are simultaneously measured, so that an adequate relationship of temporality cannot be established. These studies provide a preliminary hierarchy of evidence in relation to the association between variables in comparison with case-control and cohort studies. It is recommended that researchers take into account the notions related to this type of study in order to avoid confusion with case-control studies at the level of identifying the design and the temporal sequence between exposure and outcome, the use of association measures according to the prevalence of the outcome, and sample size calculation.
REFERENCES
1. Grimes DA, Schulz KF. An overview of clinical research: the lay of the land. The Lancet. enero de 2002;359(9300):57-61. DOI: 10.1016/S0140-6736(02)07283-5 [ Links ]
2. Hulley,S, Cummings, S, Browner, W, Grady, D, Newman, T. Designing Clinical Research. Fourth Edition. Philadelphia, USA: Wolters Kluwer; 2013. 367 p. ISBN: 978-1-60831-804-9 [ Links ]
3. Soto A, Cvetkovic-Vega A. Estudios de casos y controles. Rev Fac Med Hum. 15 de enero de 2020;20(1):138-43. DOI:10.25176/RFMH.v20i1.2555 [ Links ]
4. Schiaffino A, Rodríguez M, Pasarín MI, Regidor E, Borrell C, Fernández E. ¿Odds ratio o razón de proporciones?: Su utilización en estudios transversales. Gaceta Sanitaria. febrero de 2003;17(1):51-51.. Disponible en: https://scielosp.org/pdf/gs/v17n1/notametod.pdf. DOI: 10.1590/S0213-91112003000100012 [ Links ]
5. Fajardo-Gutiérrez A. Medición en epidemiología: prevalencia, incidencia, riesgo, medidas de impacto. Rev Alerg México. 9 de febrero de 2017;64(1):109. DOI: 10.29262/ram.v64i1.252 [ Links ]
6. Moreno-Altamirano A, López-Moreno S, Corcho-Berdugo A. Principales medidas en epidemiología. Salud Pública México. agosto de 2000;42(4):337-48. DOI: 10.1590/S0036-36342000000400009 [ Links ]
7. Cerda J, Vera C, Rada G. Odds ratio: aspectos teóricos y prácticos. Rev méd Chile. octubre de 2013;141(10):1329-35. DOI: 10.4067/S0034-98872013001000014 [ Links ]
8. Espelt A, Marí-Dell'Olmo M, Penelo E, Bosque-Prous M. Estimación de la Razón de Prevalencia con distintos modelos de Regresión: Ejemplo de un estudio internacional en investigación de las adicciones. Adicciones. 14 de junio de 2016;29(2):105-12.. DOI: 10.20882/adicciones.823. [ Links ]
9. Martinez BAF, Leotti VB, Silva G de S e, Nunes LN, Machado G, Corbellini LG. Odds Ratio or Prevalence Ratio? An Overview of Reported Statistical Methods and Appropriateness of Interpretations in Cross-sectional Studies with Dichotomous Outcomes in Veterinary Medicine. Front Vet Sci. 10 de noviembre de 2017;4:193. DOI: 10.3389/fvets.2017.00193 [ Links ]
10. Deddens JA, Petersen MR. Approaches for estimating prevalence ratios. Occup Environ Med. 1 de julio de 2008;65(7):501-6. DOI: 10.1136/oem.2007.034777 [ Links ]
11. García-García JA, Reding-Bernal A, López-Alvarenga JC. Cálculo del tamaño de la muestra en investigación en educación médica. Investigación en Educación Médica. octubre de 2013;2(8):217-24.. DOI: 10.1016/S2007-5057(13)72715-7 [ Links ]
12. Gordis, Leon. Epidemiología. Quinta. Barcelona, España: Elsevier Saunders; 2014. 391 p. ISBN: 978-84-9022-726-8 [ Links ]
13. Barros AJ, Hirakata VN. Alternatives for logistic regression in cross-sectional studies: an empirical comparison of models that directly estimate the prevalence ratio. BMC Medical Research Methodology. 20 de octubre de 2003;3(1):21. DOI: 10.1186/1471-2288-3-21 [ Links ]
Received: June 18, 2020; Accepted: July 17, 2020
 Este es un artículo publicado en acceso abierto bajo una licencia Creative Commons
