


Services on Demand
Journal

Article
 text in
  English (pdf)
 Article in xml format
 Article references
 Send this article by e-mail
Indicators
-
 Cited by SciELO
Related links
-
 Similars in
SciELO
Similars in
SciELO
Share

 Permalink
Revista de la Facultad de Medicina Humana
Print version ISSN 1814-5469On-line version ISSN 2308-0531
Rev. Fac. Med. Hum. vol.21 no.2 Lima Apr-Jun 2021
http://dx.doi.org/10.25176/rfmh.v21i2.3706
Original article
Quality of work-life and work performance in physicians at the mexican institute of social security, in the state of Chiapas
1University of Montemorelos, Montemorelos, Mexico.
2Mexican Institute of Social Security, Tuxtla Gutiérrez, Mexico.
Objective:
Determine if QWL is a significant predictor of self-perceived performance by physicians working at the Mexican Institute of Social Security, in the state of Chiapas, Mexico.
Methods:
This study used a quantitative, transversal, and predictive approach. The population consisted of 445 physicians. The type of sampling was non-probabilistic for convenience, as doctors working at the Mexican Institute of Social Security (IMSS) in the state of Chiapas were selected. The sample was 169 doctors representing 37.97% of the population. A simple linear regression analysis was performed by the successive step method.
Results:
QWL accounted for 64.9% of the variance of the variable dependent level of work performance. Similarly, it was determined that there is a positive and significant linear influence between the variables. QWL is a significant predictor of work performance in a very important way (β = .806).
Conclusions:
QWL influences the work performance of physicians working at the Mexican Institute of Social Security, in the state of Chiapas in a very important way. We conclude that improving physicians´ quality of work-life will have a direct influence on their work performance.
Keywords: of Work-Life; Job Performance; Mexican Institute of Social Security. (Source: MESH - NLM)
INTRODUCTION
A human being spends most of his time in his workplace which, in turn, also requires all of his effort and personal resources. Employees are therefore required to enjoy full well-being to perform their work efficiently. A sector of the population that requires a special focus is the medical workforce, since they are in constant relationship with society, the economy, technology and education, which allows them to have a higher level of accountability, expectations, and performance. For its part, work performance is the quality with which a worker performs the work that the organization has assigned to him. From this perspective, the present study aims to know if the level of quality of working life is a significant predictor of the level of self-perceived performance by physicians working at the Mexican Institute of Social Security, in the state of Chiapas.
BACKGROUND
Quality of working life
Quality of working life (QWL) is a broad concept which can have several specific areas of pertinence. Quality of life is a concept which refers to an individual's perception when experiencing situations of his work.1
Additionally, QWL are favorable working conditions and environments involving employee satisfaction, job security and opportunities for continued training.2
Some authors consider that quality of working life refers to those specific components of work linked to satisfaction, motivation, and work performance. It is also the full degree of satisfaction of our human needs, deduced in different physical, psychological, and social dimensions.3
Regarding the importance of the quality of working life, some authors say that talking about this topic is related to the productive activity of people, where a satisfied and healthy worker is more productive and happier.4In a study of QWL in nurses, data analysis demonstrated that 61.82% perceive an average level of quality of working life. In terms of sex, significant difference was found in the dimension of safety at work (p = .040), (M = 40.8 women) (M = 34.7 men); women in the emergency room and operating room showed higher averages in the dimension of institutional support (M = 48.75) compared to men (M = 40.8).5
Job performance
Job performance is the way employees strive to work effectively to achieve organizational goals.6For León González, work performance is the way or manner in which an employee performs his tasks.7In addition, it is proposed that work performance is the value that is expected to contribute to the organization of the different attitudinal competencies that an individual develops and performs in any given period.8In the words of Robbins and Coulter, job performance is the result of an activity.9On the other hand, job performance is seen as an ongoing process in which employees are informed of the expectations needed from them.10Job performance is also the work and behavior that can be seen in employees and that are relevant to achieving the goals of the institution.11Gibson( )defines it as the result of tasks that relate to the purposes of the organization, such as quality, efficiency, and other criteria for effectiveness. Job performance is also the function with which the job occupant carries out the activities formally recognized as part of his or her work.13
Job performance is extremely situational, that is, it varies from person to person and from situation to situation, because it depends on innumerable factors.14Chiavenato15identifies certain areas that determine a worker’s performance: communication, problem solving, decision-making, professionalism, acceptance of change, initiative, interpersonal relationships, responsibility, teamwork, attitude, and work performance. In addition, work performance is considered as a means to value employees, develop their skills, strengthen their performance and distribute rewards.16For his part, Firth17stresses that the evaluation of the level of performance is of great importance since it brings benefits to the boss and provides a clearer understanding of what is happening within the company and what could be its future.
Relationship between variables
A study on profitability and quality of working life in 33 companies found a strong relationship between the quality of working life and the products of organizations where it is stated that the higher quality of working life, the better business profitability, thanks to staff performance.18For his part, Lau19says that the quality of working life offered by an organization has a positive impact on the physical, mental and emotional health of the worker, with a positive impact on his or her performance. In a study they found that organizations that generate quality goods and/or services through adequate working conditions, as well as personal/professional development opportunities for their employees, are also the ones that make the most profits and best social consideration.20
In a study they found that by establishing strategies focused on improving the quality of working life of workers, this is reflected in the performance and benefit of the organization in the short, medium or long term.18In an investigation Grote and Guest21found a relationship between the quality of working life with work performance, the work system, corporate policies, management and management methods, organizational strategies or effectiveness and productivity. For their part, Kim, and Ryu22found a direct relationship between physical and mental health variables and performance with performance and delivery of results.
METHODS
Design and Setting
The present study has a quantitative, transversal, and predictive approach, using a database of doctors working at the Mexican Institute of Social Security for Welfare, in the State of Chiapas, Mexico.
Population and sample
The population used consisted of 445 doctors. The type of sampling carried out in this investigation was not probabilistic for convenience, since doctors working at the IMSS Welfare in the state of Chiapas were selected. The sample was 169 doctors representing 37.97% of the population studied. No sample size calculation was performed, as the instrument used was sent to the entire population. All physicians could participate regardless of gender, position, or age.
Variables and instruments
The variables used in the present study were the following: the independent variable was the quality of working life and the dependent variable was work performance. Some demographic variables such as age, gender, working hours and type of employment were used. Two instruments were used: quality of working life (CVL-HP questionnaire) conformed with 55 criteria and work performance (Labor Performance Scale, EDL), conformed by 15 criteria, with an internal consistency of .957 for the quality of working life and .735 for the boral-performance, measured by the Cronbach alpha.
Procedures
For the collection of data, the survey was used for each of the variables used. The coordinator of the IMSS Welfare of the state of Chiapas was asked for permission to apply through the Google Forms. Each participant was sent via WhatsApp a message with the corresponding link to be answered. Once answered, a database was created automatically and used for statistical analysis.
Statistical analysis
For the analysis of the results, a database was designed, first in the Excel 2010 program, to then proceed to the statistical management. Once the database was created, a clean-up of the database was done, eliminating capture errors, extreme data, and atypical data. Frequencies, descriptive and regression assumptions were obtained, and then hypothesis testing was done by simple regression analysis. The analysis of the data collected was carried out through the Statistical Package for Social Science (SPSS), version 23.0 for Windows XP.
Ethical considerations
In the development of the research process, informed consent was given to safeguard the privacy of all participants in the surveys conducted. All the supports and functions of the research were recognized, as were the copyright of each of the contributors. The information that participants provided to the study was strictly confidential and was used only by the project’s research team and is not available for any other purpose. All participants were coded with a number and their name was not used, so they cannot be identified. Participants in the study did not receive any payment for participating in the research and did not incur any cost for them.
RESULTS
With respect to the demographic data, it was found that the average age was 38.98 years, regarding the gender, the female sex predominated (n = 91), the majority reported having a year of service (13.0%), the prevailing time was the day (n = 138), and most were basic employees (n = 90).
By analyzing the answers given by the 169 physicians, an arithmetic mean for work performance of 4.78 and a standard deviation of was obtained. 198 and for the quality of working life was obtained an arithmetic mean of 4.31 and a standard deviation of. 433.Table 1shows the arithmetic mean and the standard deviation of the criteria of the job performance construct. According to the table, the best evaluated criterion was "I am careful with my work tools" (M = 4.97, DE = .169) and the least evaluated criterion was "I perform periodic evaluations of my work" (M = 4.23, DE = .794).
Table 1. Descriptive of job performance criteria.
| Criteria | M | OF |
|---|---|---|
| D1 I plan my work before doing it. | 4.63 | .550 |
| D2 My workplace is well organized. | 4.57 | .530 |
| D3 I comply with my daily work plan. | 4.54 | .555 |
| D4 I carry out periodic evaluations of my work. | 4.23 | .794 |
| D5 I respect the instructions of my superiors. | 4.92 | .279 |
| D6 I have good relations with my immediate boss. | 4.79 | .596 |
| D7 I help my colleagues when they need me. | 4.79 | .402 |
| D8 I take responsibility for the consequences of my bad work decisions. | 4.92 | .288 |
| D9 I attend work on time. | 4.82 | .393 |
| D10 I am careful with my work tools. | 4.97 | .169 |
| D11 I comply with safety regulations when doing my work. | 4.87 | .348 |
| D12 I am careful with the facilities of the institution. | 4.96 | .185 |
| D13 I can work well even if I am not being supervised. | 4.90 | .331 |
| D14 I am careful when doing my job. | 4.94 | .225 |
| D15 I do my job taking care of material resources. | 4.91 | .305 |
Table 2shows the arithmetic mean and standard deviation of the structure criteria for quality of working life. According to the table, the best evaluated criterion was "Occupational responsibility" (M = 4.78 , SD = .442.) and the least evaluated criterion was "Benefits for my working condition" (M = 3.40, SD = 1.03).
Table 2. Descriptive criteria for quality of working life.
| Criteria | M | OF |
|---|---|---|
| C1 Fluid communication between the work team. | 4.46 | .636 |
| C2 Identification with the mission of your institution. | 4.59 | .611 |
| C3 Maintenance of biomedical materials. | 4.39 | .683 |
| C4 You consider that the evaluation you received is fair. | 4.33 | .713 |
| C5 Feedback from colleagues and superiors for the job evaluation. | 4.55 | .616 |
| C6 Pleasant work environment. | 4.30 | .838 |
| C7 immediate boss meets needs. | 4.46 | .809 |
| C8 Boss is interested in solving problems. | 4.46 | .723 |
| C9 Peer help. | 4.55 | .576 |
| C10 Personal development at work. | 4.56 | .653 |
| C11 Clean Facilities at Work. | 4.18 | 1.08 |
| C12 I have retirement plans. | 4.66 | .584 |
| C13 Functions defined in my work. | 4.05 | .995 |
| C14 Recognition in my job. | 4.42 | .668 |
| C15 Environment where you worked. | 4.30 | .992 |
| C16 Current job stability. | 4.45 | .739 |
| C17 Contribution of work to the achievement of common objectives. | 4.37 | .799 |
| C18 Right holder. | 3.85 | .910 |
| C19 Quality of quality inputs. | 3.68 | .984 |
| C20 Muscle fatigue at the end of the workday. | 3.94 | 1.050 |
| C21 Safety against toxic infections. | 3.98 | .893 |
| C22 Benefits for my employment condition. | 3.40 | 1.03 |
| C23 Quality of technology for the development of my work | 4.24 | .696 |
| C24 Fluid relationship between teams | 4.46 | .654 |
| C25 My current general health. | 3.84 | .919 |
| C26 Work pressure that I perceive. | 4.41 | .685 |
| C27 Conflicts resolved through dialogue. | 4.27 | .871 |
| C28 Freedom of expression without fear of retaliation. | 4.32 | .668 |
| C29 Creativity and innovation. | 3.72 | 1.260 |
| C30 Opportunity for promotion. | 4.01 | .972 |
| C31 Teamwork promotion. | 4.43 | .713 |
| C32 Motivation to be proactive in my work. | 4.37 | .761 |
| C33 Work interest in my workplace. | 4.20 | .785 |
| C34 Provision of support in my workplace. | 4.57 | .613 |
| C35 Institutional membership. | 4.47 | .690 |
| C36 Preparation and induction to the position. | 4.38 | .715 |
| C37 Updated manuals. | 4.05 | 1.033 |
| C38 Identified me with my service. | 4.20 | .808 |
| C39 Identification with the institution that worked. | 4.72 | .449 |
| C40 Creativity, innovation, and motivation at work. | 4.78 | .428 |
| C41 Customer recognition. | 4.49 | .664 |
| C42 How do I perceive my standard of living. | 4.43 | .687 |
| C43 Use of my abilities and potentialities. | 4.55 | .586 |
| C44 Possibility at work. | 4.47 | .664 |
| C45 Work and personal balance. | 4.48 | .682 |
| C46 Remuneration for the position I hold. | 4.02 | .906 |
| C47 Achievement of institutional goals. | 4.25 | .654 |
| C48 Relationship with coworkers. | 4.50 | .568 |
| C49 Job satisfaction. | 4.55 | .555 |
| C50 Social relevance within my work. | 4.41 | .640 |
| C51 Free time to share with my family. | 3.81 | 1.027 |
| C52 Tokens of gratitude from my boss. | 4.06 | .964 |
| C53 Labor responsibility. | 4.78 | .442 |
Regression analysis
In the present investigation, four regression assumptions were considered, which are mentioned below: (a) linearity of the phenomenon, (b) normality of residues, (c) independence of the error terms, and (d) constant variance of the error term (homoscedasticity).
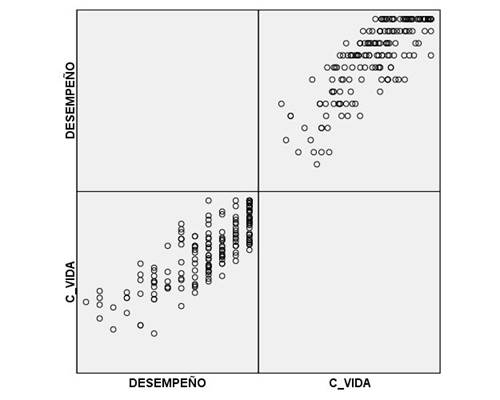
The first criterion analyzed was the linearity of the independent variable with the criterion variable and it was observed, in the dispersion graphs, that there is a positive linear relationship where the points tend to form a straight line (seeFigure 1).
The second criterion that was tested was the normality of the errors, using the Kolmogorov-Smirnov statistic (p > .05) and it is observed that the distribution of the residues is normal (p = .) (seeTable 3).
Table 3. Pruebas de normalidad.
| Kolmogorov-Smirnov(a) | Shapiro-Wilk | |||||
|---|---|---|---|---|---|---|
| Statistical | gl | Sig. | Statistical | gl | Sig. | |
| ZRE_1 Standardized Residual | .058 | 169 | .200(*) | .972 | 169 | .002 |
In the third criterion, the independence of the errors was tested, using the Durbin-Watson test whose value was DW = 2.079, where values greater than two indicate negative autocorrelation. Therefore, it is possible to assume independence between waste (seeTable 4).
Table 4. Durbin-Watson test.
| Model | R | R square | R squared corrected | Typ. Error of the estimate | Durbin-Watson |
|---|---|---|---|---|---|
| 1 | .806(a) | .649 | .647 | .11813 | 2.079 |
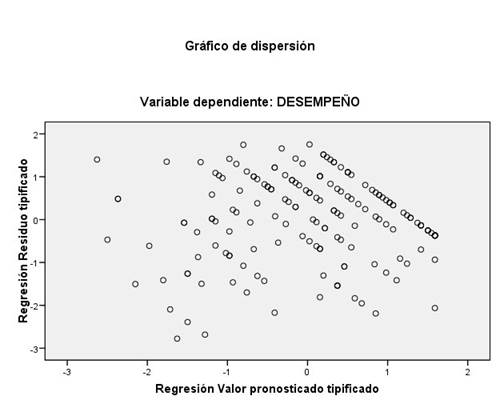
Finally, homoscedasticity was analyzed, using the graph of the standard predicted value and the value of the standardized residue; it was observed that there is no linear relationship in the residues. Therefore, errors have equal variances (seeFigure 2).
Hypothesis testing
The hypothesis to be tested was the following: the level of quality of working life is a significant predictor of the level of work performance as self-perceived by physicians working at the Mexican Institute of Social Security, in the state of Chiapas. For the analysis of this hypothesis, the statistical technique of simple linear regression was used; the level of quality of working life was considered as an independent variable and the level of work performance as a dependent variable.
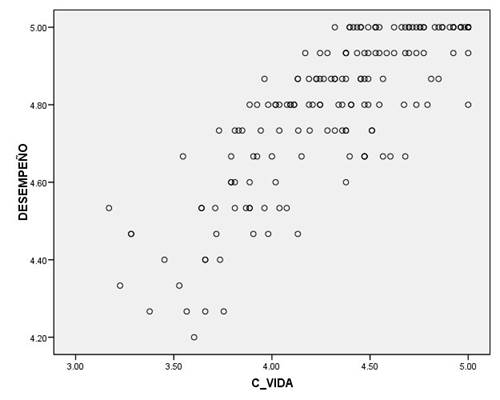
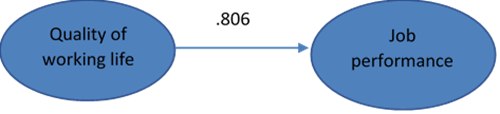
When performing the regression analysis, it was found that the variable level of quality of working life applied 64.9% of the variance of the variable dependent level of work performance. The corrected R2 value was equal to .649. Similarly, we obtained the value of F equal to 309,287 and the value of p equal to 0,000 that allowed us to determine that there was a positive and significant linear influence (seeFigure 3).Figure 4shows the value of the standardized coefficient and found a high level of prediction (β = .806) between the independent variable quality of working life and the dependent job performance. To the extent that doctors are concerned about maintaining a good standard in their quality of working life, it will manifest itself in better performance in their work as health officials.
The values of the non-standardized coefficient Bk obtained by the statistical technique of regression were the following: B0 equal to 3.197 and B1 equal to . 369. With these values, the following regression equation could be constructed using the least squares method: quality of working life = 3,197 + . 369 = job performance.
Effect size. To calculate the size of the regression effect, the G*Power was used, which is a free download software designed to make estimates of the statistical power and the size of the effect. A post hoc analysis was carried out as the tools of measurement had been applied. To calculate the effect size in regressions, the following formula was used:
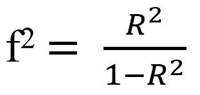
To calculate the effect size and statistical power, a α = . 05 and a sample of 169 individuals were used. A coefficient of determination of R2 of . 649 was obtained. When calculating the size of the effect, a value of 1.849 was found. This value is considered as a measure of the size of the large effect (> .35). When calculating the statistical power, a value of 1.00 was found. The statistical power (1-β = 1.00) exceeds the required minimum levels (80%). Therefore, the statistical power is considered as large.
Discussion
The purpose of this study was to determine whether the level of quality of working life is a significant predictor of the level of work performance self-perceived by doctors working at the Mexican Institute of Social Security, in the state of Chiapas, Mexico. In the statistical test, it was found that the quality of working life is a significant predictor in high degree of the work performance of the population of doctors working at the Mexican Institute of Social Security Welfare in the state of Chiapas.
These results agree with Grote and Guest21, who found a significant relationship between the quality of working life with work performance, the work system, corporate policies, management and management methods, organizational strategies, and productivity. For their part, Kim, and Ryu22found a direct relationship between physical and mental health variables and professional performance with work performance and the delivery of results. It also agrees with what Argüelles Ma et al.18found when establishing strategies focused on improving the quality of working life of workers, this is reflected in the performance and benefit of the organization in the short, medium, or long term. The same authors found a strong relationship between the quality of working life and the products of the organizations where it is manifested that the higher quality of working life, better business profitability, through the staff performance. In addition, Lau2 says that the quality of working life offered by an organization has a positive impact on the physical, mental, and emotional health of the worker, while favorably respecting his or her work performance. Organizations that generate quality goods and/or services through adequate working conditions, as well as personal/professional development opportunities for their employees, are also the ones that obtain the highest earnings and best social consideration20.
CONCLUSION
Among the population of doctors working at the Mexican Institute of Social Security, in the state of Chiapas, Mexico, the quality of working life was found to be a very important predictor of their work performance. It could be said that the extent to which doctors, in the study population, are concerned about maintaining a good quality of working life will influence better performance in their daily work.
REFERENCES
1. Ardila R. Calidad de vida: una definición integradora. Revista Latinoamericana de Psicología. 2003; 35(2). [ Links ]
2. Lau RS. Quality of work life and performance-An ad hoc investigation of two key elements in the service profit chain model. International journal of service industry management. 2000; 11(5). [ Links ]
3. Alguacil Gómez J. Calidad de Vida y Praxis Urbana. [Online].; 1998 [cited 2020 Diciembre 11. Available from: http://habitat.aq.upm.es/cvpu/acvpu.pdf. [ Links ]
4. Corrêa DA,OYCyGAC. Vida con calidad y calidad de vida en el trabajo. Invenio. 2013; 16(30). [ Links ]
5. Zavala MO CKICPJRRGRLMFC. Calidad de vida laboral de enfermeras de un hospital privado.. Biotecnia. 2016 Marzo; 18. [ Links ]
6. Stoner JA. Administración. sexta ed. México: Pearson Educación; 1996. [ Links ]
7. León González A. Métodos de compensación basados en competencias. Primera ed. Barranquilla: Ediciones Uninorte; 2006. [ Links ]
8. Palací Descals FJ. Psicología de la organización Madrid: Pearson Prentice Hall; 2005. [ Links ]
9. Robbins SPyCM. Administración. Décima ed. México: Pearson; 2010. [ Links ]
10. Newstrom JW. Dirección: gestión para lograr resultados México: McGraw-Hill; 2007. [ Links ]
11. Chiavenato I. C. Introducción a la teoría general de la administración México: McGraw-Hill Interamericana; 2018. [ Links ]
12. Gibson. G. Las organizaciones: comportamiento, estructura, procesos. México: Addison-Wesley Iberoamericana; 1994. [ Links ]
13. Landy F. Psicología industrial: Introducción a la psicología industrial y organizacional. México: McGraw-Hill.; 2005. [ Links ]
14. Gómez Mejía L. R. Administración México: McGraw-Hill; 2003. [ Links ]
15. Chiavenato I. El capital humano de las organizaciones México: McGraw-Hill Interamericana; 2007. [ Links ]
16. Dolan SLyMI. 10 mandamientos para la dirección de personas. Madrid: Gestión; 2000. [ Links ]
17. Firth D. Lo fundamental y lo mas efectivo acerca de la gestion de personal México: McGraw-Hill.; 2000. [ Links ]
18. Argüelles Ma LA,QGRAyFMJ. Rentabilidad y calidad de vida laboral. Revista Internacional Administración & Finanzas. 2017; 10(1). [ Links ]
19. Lau RSM. Quality of work life and performance - An ad hoc investigation of two key elements in the service profit chain model.. Journal of Service Industry Management. 2000; 11(5). [ Links ]
20. Efraty DySMJ. The effects of quality of working life (QWL) on employee behavioral responses. Social Indicators Research. 1990; 22(1). [ Links ]
21. Grote GyGD. The case for reinvigorating quality of working life research.. Human Relations. 2017; 70(2). [ Links ]
22. Kim MyRE. Structural equation modeling of quality of work life in clinical nurses based on the culture-work-health model. Journal of Korean Academy of Nursing. 2015; 45(6). [ Links ]
Received: February 06, 2021
 Este es un artículo publicado en acceso abierto bajo una licencia Creative Commons
