


Servicios Personalizados
Revista

Articulo
 texto en
  Inglés (pdf)
 Articulo en XML
 Referencias del artículo
 Enviar articulo por email
Indicadores
-
 Citado por SciELO
Links relacionados
-
 Similares en
SciELO
Similares en
SciELO
Compartir

 Permalink
Revista de la Facultad de Medicina Humana
versión impresa ISSN 1814-5469versión On-line ISSN 2308-0531
Rev. Fac. Med. Hum. vol.21 no.3 Lima jul./set. 2021
http://dx.doi.org/10.25176/rfmh.v21i3.3758
Original article
Evaluation of the discriminative capacity of anthropometric indicators and their predictive relationship of diabetes in health workers of the University Hospital of Guayaquil - Ecuador
1Facultad de Medicina, Universidad de Guayaquil- Ecuador, Guayaquil, Ecuador
2Universidad Nacional de Piura, Piura, Peru
3Universidad Nacional de la Rioja, La Rioja, Argentina
4Escuela Profesional de Medicina Humana, Universidad Privada San Juan Bautista Filial Chincha, Ica, Peru
5Compassion International Plenitud de Dios
6Universidad Nacional de Barranca, Barranca, Peru
7Hospital Universitario de Guayaquil, Guayaquil, Ecuador
Objective:
To evaluate the discriminative ability to predict diabetes with anthropometric and biochemical indicators and medical history.
Methods:
The sampling carried out was census and the sample consisted of 104 workers. A longitudinal study was carried out to evaluate the discriminative ability to predict diabetes with the anthropometric, biochemical, and antecedent indicators, using two models, the analysis of the ROC curves and binary logistic regression.
Results:
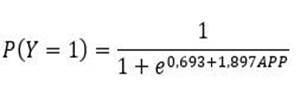
By analyzing the ROC curves, the abdominal circumference obtained greater predictive discriminative power (AUC = 0.747; p <0.001; CI: 0.624-0.870), compared to glycemia (AUC=0.749; p <0.001; CI: 0.645-0.852) and the waist-height index (AUC=0.737; p=0.001; CI: 0.638-0.836). Personal medical history is included in the logistic regression equation P(Y=1)=(1+e0,693+1,897APP)-1to predict the risk of developing diabetes in the future.
Conclusions:
The abdominal circumference obtained the highest discriminative power, followed by the pathological history.
Keywords: Mellitus; Forecasting; Risk (source: DeCs BIREME)
INTRODUCTION
The use of anthropometric indicators to relate it to diabetes has gained relevance in the academic field. Many investigations link anthropometric measurements and biochemical markers to predict the onset of diabetes. A PURE study design (Population Health Research Institute) was carried out in some communities in Colombia to evaluate the association between waist circumference, grip strength, body weight, and age1. Waist circumference was the leading risk factor for a high MetS score.
A longitudinal study in children with type 1 diabetes mellitus, from 5 to 18 years of age in a Hospital in the northwest of Brazil; to anthropometric measurements, triglyceride, and glycated hemoglobin values were added; the triglyceridemic waist phenotype (CHTG), have a higher body mass index and glycosylated hemoglobin with a significance of p <0.052.
The waist circumference, measured in a horizontal plane, between the lower margin of the rib and the upper edge of the iliac crest, according to the guidelines of the World Health Organization3, continues to show that it is a better predictor for diabetes than body mass index4.
The objective of the study was to evaluate the discriminative ability to predict diabetes with anthropometric and biochemical indicators and antecedents. Anthropometric, biochemical, and background indicators turn out to be good discriminators for predicting diabetes mellitus, as well as having a good level of sensitivity and specificity5.
METHODS
Design and study area
A longitudinal study to evaluate the discriminative ability to predict diabetes with anthropometric, biochemical, and antecedent indicators, using two models, the analysis of the ROC curves and binary logistic regression, in the health personnel of the Hospital Universitario de Guayaquil.
Population and sample
Since the objective of the study was to evaluate the discriminative capacity in anthropometric indicators in the hospital health employees and since the population was no greater than 200, it was decided to carry out a census-type sampling, including all workers who met the inclusion criteria (not having diabetes). The sample consisted of 104 health workers of both genders, from November 2020 to January 2021. Access was obtained to the electronic medical record contained in the database in the statistics service. In the analysis, personnel with a diagnosis of type 2 diabetes mellitus were excluded.
Variables and instruments
The study variables are the following: general data (age, gender, personal and family pathological history, and as vital signs, normal blood pressure <130 mmHg systolic and <80 mmHg diastolic)6; anthropometric evaluation, by weight (kg), height (cm), body mass index (BMI), values of 25-29.9 kg / m2 and ≥ 30 kg / m2, defined as overweight and obesity; abdominal girth (cm), normal values for men <102 cm, women <88cm; Likewise, for the waist-hip index 0.8 in women and 1 in men, according to the World Health Organization7, the waist-height index, a healthy level is considered lower than 0.58; the percentage of body fat, an equation is made, Men: 63 - (20 x height/circumference) vn: 18 - 24 and Women: 76 - (20 x height/circumference) vn: 25 - 31; the height (cm) of the patient divided by the circumference of the waist9. Serological biomarkers; Total cholesterol (mg / dl), triglycerides (mg / dl), and fasting glycemia (mg / dl), was made with the Trinder colorimetric reagent kits10and as a lifestyle, physical activity.
Risk detection scales were used for the present analysis; both scales (with different levels each) were dichotomized. On the FINDRISC scale, a score> 1411was considered as the cut-off line between high risk and low risk; In the STOP-NIDDM risk-score for prediction at 2.5 years, a minimum of 10 points was considered to determine high risk12(Tables 1 and 2 11 12.
Table 1. Findrisc Diabetes Risk Score Risk ScoreScore
| Total | Interpretation |
|---|---|
| Less than 7 points | Low-risk level |
| 7 to 11 points | Slightly high-risk level |
| 12 to 14 points | Moderate risk level |
| 15 to 20 points | High-risk level |
| More than 20 points | Very high-risk level |
(FINDRISC)11
Table 2. Individual prediction for diabetes STOP-NIDDM
| Points | Risk of DM (%) |
|---|---|
| 0 | 12,51 |
| 1 | 14,46 |
| 2 | 16,70 |
| 3 | 19,23 |
| 4 | 22,10 |
| 5 | 25,32 |
| 6 | 28,92 |
| 7 | 32,91 |
| 8 | 37,29 |
| 9 | 42,09 |
| 10 | 47,15 |
| 11 | 52,56 |
| 12 | 58,18 |
| 13 | 63,92 |
| 14 | 69,63 |
| 15 | 75,18 |
| 16 | 80,39 |
| 17 | 85,11 |
| 18 | 89,21 |
risk-score12
Procedure
The data collection was carried out through the electronic medical record prepared by the occupational medicine staff. These data obtained were entered into an Excel file, to later be processed into the program SPPS version 25 and the Diagnostic test calculator version 2010042101.
Statistical analysis
It was performed in two stages. First, all the variables were evaluated individually through the ROC curves, comparing them with the dichotomized results of the FINDRISC test, being the determinant to include as a relevant variable, the AUC measurement, and its CI. Using the Youden index, the results of the chosen variables were dichotomized to classify them into two groups according to their predictability of risk. The results were contrasted with a Gold Standard (dichotomized results of the STOP - NIDDM test) and were obtained True positive and true negative through a confusion matrix. Finally, with these values, the diagnostic test characteristics were obtained using the Diagnostic test calculator version 201004210113.
In a second stage, logistic regression was used, assuming as the dependent variable the STOP-NDDIM score (Dichotomized for logistic regression: low risk <10=; high risk> 10) with 4 qualitative and 13 quantitative variables at the beginning of the process. The choice of the relevant independent variables was performed by bivariate correlation analysis between the dependent variable and each independent variable. For qualitative variables, a test was usedvariables2, while for quantitative, Student's t and Mann Witney's U tests were used. Then a univariate logistic regression analysis was performed to choose the variables that had a better performance. Finally, a Wald forward multivariate analysis was applied.
RESULTS
There are many scales to predict diabetes, but the most used is the Findrisc scale, which allows assessing the risk of developing the disease in 10 years, using a score greater than 14, which represents a slightly high risk. With the ROC and AUC curves (reference test: the FINDRISC score, which divides the sample into two groups, low risk (<14) and high risk (> 14)) of the following anthropometric indicators: Age, systolic pressure and diastolic, family and personal pathological history, physical activity, glycemia, cholesterol, triglycerides, weight, height, BMI, abdominal circumference, waist-hip index, waist-height index and percentage of body fat.
Better results were obtained with glycemia, abdominal circumference and waist-height index (Figure 1). The abdominal circumference obtained greater discriminative power to predict diabetes (AUC = 0.747; p <0.001; CI: 0.624-0.870), compared to glycemia (AUC=0.749; p <0.001; CI: 0.645-0.852) and the index waist-height (AUC=0.737; p=0.001; CI: 0.638-0.836). Table 1 shows the Youden index, the sensitivity and specificity of the tests.
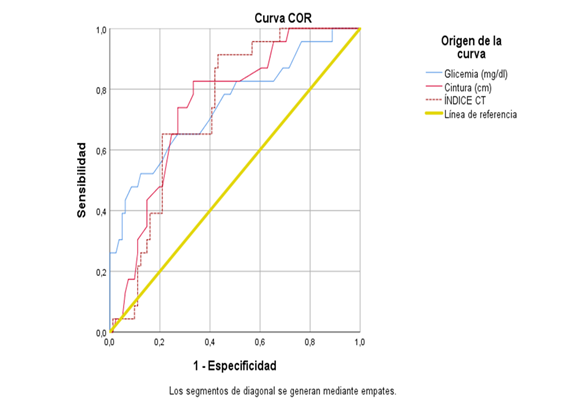
Table 3: Cut points of the coordinates of the ROC curve.
| Parameter | Youden index | Cut point | Sensitivity | 1 - Specificity |
|---|---|---|---|---|
| Glycemia | 0.398 | 103.50 | 0.522 | 0.123 |
| Abdominal | 0.302 | 84.5000 | 0.957 | 0.654 |
| Waist-height index | 0.481 | 0.5477 | 0.913 | 0.432 |
The cut points allowed dichotomizing the variables (those who had a high risk of having diabetes in the future and those that do not) to contrast them with a Gold Standard (the values of the STOP-NIDDM test, with at least 10 points to determine high risk) through a confusion matrix. The best results were obtained in the variable glycemia and abdominal circumference. For glycemia, True Positive= 6, False Positive= 16, False Negative= 6 and True Negative= 76 were obtained. In the same way, the following values were obtained for abdominal girth, TP = 2, FP = 6, FN = 10 and TN = 86. The Diagnostic test calculator with these values was used to obtain the diagnostic test characteristics for both variables (Table 2).
Table 4: Characteristics of the diagnostic test.
| Characteristics | Glycemia | Abdominal | |
|---|---|---|---|
| Prevalence | circumference 0,115 | 0,115 | |
| Sensitivity | 0,495 | 0,167 | |
| Specificity | 0,828 | 0,935 | |
| + LR | 2,88 | 2,56 | |
| -LR | 0,61 | 0,89 | |
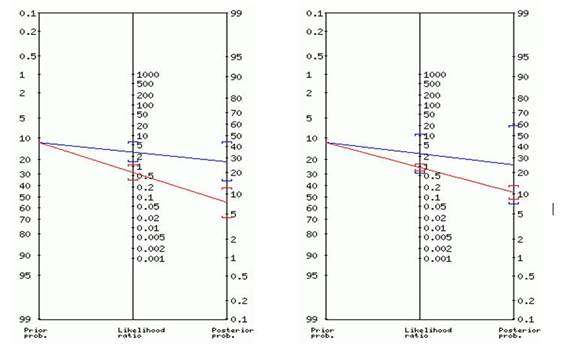
| Positive test | probability (95% CI) | ratio 2,88 (1,39-5,96) | 2,56 (0,58-11) Posterior |
| probability (95% CI) | 27% (15%-44%)a | 25% (7%-59%)c | |
| Negative test | probability ratio (CI, 95%) | 0,61 (0,35-1,08) | 0,89 (0,69-1,15) posterior |
| probability (95% CI) | 7% (4%-12%)b | 10% (8%-13%)d | |
a.~ 1 in 3.7 with positive test are ill b. ~ 1 in 1.1 with a negative test are fine c. ~ 1 in 4.0 with a positive test are ill d. ~ 1 in 1.1 with a negative test is OK
Fagan nomograms for blood glucose (left) and abdominal girth (right) are shown in Figure 2.
In a second stage, it was evaluated which variables could enter the multivariate logistic regression analysis. To the qualitative variables, the test was applied X2 (with the phi value) to measure the association of the dependent variable with each independent variable. The variables with the best results were: personal pathological history (APP, hereinafter: p = 0.001; phi = 0.312) and family pathological history (APF: p = 0.042; phi = 0.2), while those ruled out were gender (p = 0.319) and physical activity (p = 0.267).
In the case of quantitative variables, statistical tests were applied (Student's t for variables with normal distribution and Mann-Whitney U for variables that did not have a normal distribution) to determine the difference of means and medians between the groups formed by the dependent variable. The variables chosen were systolic blood pressure (SBP, p = 0.018), diastolic blood pressure (DBP, p = 0.026), glycemia (p = 0.031), cholesterol (p = 0.032), triglycerides (p = 0.006). The rejected variables were age (p = 0.256), BMI (p = 0.1), abdominal girth (p = 0.018 but Levene = 0.519), hip measurement (p = 0.3), waist / hip ratio (p = 0.022 but Levene = 0.678), waist / height ratio (p = 0.079) and% fat (p = 0.759).
In a second stage, a univariate logistic regression was performed and they entered the final model: APP (p = 0.04), APF (p = 0.07), SBP (p = 0.117), DBP (p = 0.035), glycemia (p = 0.039), cholesterol (p = 0.077) and triglycerides (p = 0.034).
Multivariate logistic regression was applied to six variables APP, APF, DBP, glycemia, cholesterol, and triglycerides, using the Wald forward method. The model performed 5 iterations until the best was found, with a -2LL0 = 74.386 and afinal -2LL = 66.437. The omnibus test of the model’s coefficients yields X2= 7.950 (p = 0.005), which allows evaluating the fit of the model. Cox and Snell's R-squared is 0.074, while Nagelkerke's R-squared = 0.144. At the same time, the RL2= 0.10 and the Pseudo-R2= 0.07.
Finally, the variable that enters the equation was APP (β = -1.897; p = 0.004; Exp (β) = 0.150; 95% CI = 0.042-0.542). Therefore, the logistic regression equation is finally defined as follows:
DISCUSSION
The World Health Organization (WHO) mentions that the number of people who have diabetes in Latin America could reach 32.9 million by 203014. In this sense, it is important to determine the risk factors for Diabetes in health personnel through effective, sensitive, and specific indicators. The present study shows similar results with a longitudinal study in health workers that was carried out to relate the degree of occupation and risk factors for type 2 diabetes15.
With the analysis of the ROC curves, the abdominal circumference measurement had greater discriminative power to predict diabetes (AUC = 0.747; p <0.001; CI: 0.624-0.870). This agrees with various studies by Roos16, Yoon17, Darsini18, in which this indicator was effective in predicting risk. In a cohort study with different cut-off points, the risk of acquiring diabetes was evaluated19, and it was determined that the abdominal circumference was the most important.
The results of the ROC curve analysis and those of the diagnostic test calculator show that the blood glucose test (0.522 and 0.495, respectively) has a medium level of sensitivity. This result is similar to the measurement of the alteration of fasting glucose (> 100 mg/dl) in a health insurance personnel in Korea to determine the risk of diseases20.
When performing the bivariate correlation, those with the highest correlation were personal pathological history (APP, hereinafter: p = 0.001; phi = 0.312) and family pathological history (APF: p = 0.042; phi = 0.2). In turn, the multivariate logistic regression analysis showed that APPs have predictive power (Nagelkerke's R squared = 0.144)21. Although it is true, this value is relatively low, it is important to note that this indicator allows predicting the risk mathematically. In the same prediction model, it was found that APPs have a prediction probability of 40%.22.
LIMITATIONS OF STUDIES
One of the limitations is not having carried out the frequency of food consumption to investigate another prediction risk. Another limitation was not determining baseline insulin if it is directly related to abdominal girth and being another predictor for diabetes.
CONCLUSION
The analysis of the ROC curves shows that blood glucose and abdominal circumference are the best predictors of diabetes. It is known that glucose is used to diagnose the presence of diabetes in patients. For its part, the abdominal circumference is an effective indicator to predict diabetes, as shown in this study and others carried out in Latin America and the Caribbean latitudes.
Multivariate logistic regression analysis places family medical history as an important variable when predicting the probability of having diabetes in the future. The difference between this equation with the FINDRISC tests and similar ones is that the equation gives a probability as a single variable. In contrast, the other tests require lengthy questionnaires and measurements of many variables. Therefore, a logistic equation is more versatile when it comes to forecasting probabilities. The best predictors of diabetes risk are glycemic index, abdominal circumference, and personal medical history, each with its potential, depending on the approach with which the test is used.
REFERENCES
1. Lopez-López J Cohen D, Ney-Salazar D, Otero J, Gómez-Arbelaez D et al.The prediction of Metabolic Syndrome alterations is improved by combining waist circumference and handgrip strength measurements compared to either alone. Cardiovascular Diabetology. 2021 Juanary; 20(68). [ Links ]
2. De Souza C, Barbosa S, Silva A, Grande I, Maio R. Cintura hipertrigliceridemica e fatores asociados en criancas e adolescentes portadores de diabetes melito tipo 1. Rev paul pediatr. 2020 Mar; 38. [ Links ]
3. Organization. WH. Waist circumference and waist-hip ratio. Report of a WHO expert consultation. 2008 December;(8-11). [ Links ]
4. Lozano KD, Gaxiola RL. Indice de masa corporal, circunferencia de cintura y diabetes en adultos del Estado de Mexico. Rev Salud Publica Nutr. 2020 Jan; 19. [ Links ]
5. Pandey , Midha , Rao , Katiyar , Wal P, Kaur , et al. Anthropometric indicators as predictor of pre-diabetes in Indian adolescents. Indian Heart J. 2017 Aug; 69(4): p. 474-479. [ Links ]
6. Mancia G, Fagard, Narkiewicz, Redon , Zanchetti , Böhm , et al. Guía de práctica clínica de la ESH/ESC para el manejo de la hipertensión arterial (2013). Revista Española de Cardiología. 2013 Nov; 66(11): p. 880. [ Links ]
7. Center for Disease Control and Prevention. [Online]. Available from: https://www.cdc.gov/healthyweight/assessing/bmi/adult_bmi/index.html. [ Links ]
8. Arnaiz P, Marin A,Pino F, Barja S, Aglony M, Navarrete C et al. Indice cintura-estatura y agregación de componentes cardiometabólicos en niños y adolescentes de Santiago. Revista médica de Chile. 2010; 138(11). [ Links ]
9. Woolcott O BR. Relative fat mass (RFM) as new estimator of whole-body fat percentage a cross sectional study in American adult individuals. Scientific Reports. 2018 Aug; 1. [ Links ]
10. Trinder P. Determination of glucose in blood using glucose oxidase with an alternative oxygen acceptor. Annals of clinical Biochemestry International Journal of Laboratory Medicine. 1969 Jun; 1. [ Links ]
11. Mendiola I, Urbina I, Muñoz S, Juanico G, López G. Evaluación del desempeño del Finnish Diabetes Risk Score (findrisc) como prueba de tamizaje para diabetes mellitus tipo 2. Atención Familiar. 2017 Jan; 25. [ Links ]
12. Tuomilehto J, Lindstrom J, Hellmich M, Lehmacher W, Westermeir T, Evers T et al. Development and validation of risk score model for subjects with impaired glucose tolerance for the assessment of the risk of type 2 diabetes mellitus The stop Niddm risk-score. Diabetes Research and Clinical Practice. 2010 Feb; 87. [ Links ]
13. A, Schwartz. Diagnosis Test Calculator. Ulan. 2006 March. [ Links ]
14. OPS. La diabetes se convierte en una epidemia. Pan American Health. 2020 March, vol 172. [ Links ]
15. Almeida V, Zanetti M, Almeida P, Damasceno M. Ocupattion and risk factors for type 2 diabetes: a study with health worker. Revista LatinoAmericana de Enfermagem. 2011 Mar; 19(476-484). [ Links ]
16. Ross R, Neeland I, Yamashita S, Shai I, Seidell J, Magni P et al. Waist circumference as a vital sign in clinical practice a Consensus statement from the IAS and ICCR working group on visceral obesity.. Nature Reviews Endocrinology. 2020 Mar; 16(177-189). [ Links ]
17. Yeong S, Sang W. Optimal Waist Circumference Cutoff Values for the Diagnosis of Abdominal Obesity in Korean Adults. Endocrinology and Metabolism. 2014 December; 29(4). [ Links ]
18. Darsini D, Hamidah H, Hari B, Eko A. Health risks associated with high waist circumference: A systematic review. J Public Health Res. 2020 Jul; 9(2). [ Links ]
19. Zafari N, Lotfaliany M, Mansournia M, Khalili D, Azizi F, & Hadaegh F. Optimal cut-points of different anthropometric indices and their joint effect in prediction of type 2 diabetes: results of a cohort study. BMC Public Health. 2018 June; 691. [ Links ]
20. Lee G, Min Kim S, Choi S, Kyuwoong K, Jeong S, Joung S, Jae-Moon Y & Sang Min Park.The effect of change in fasting glucose on the risk of myocardial infarction, stroke, and all-cause mortality: a nationwide cohort study. Cardiovascular Diabetology. 2018 April; 51. [ Links ]
21. López Roldan P, Facheli S. Metodología de la Investigación Social Cuantitativa. primera ed. Barcelona UAd, editor. Barcelona: Bellaterra; 2015. [ Links ]
22. Dhandhania K. Predicting Diabetes with Logistic Regression [Internet]. Towards Data Science. 2018. Available from: https://towardsdata science.com/end-to-end-data-science-example-predicting-diabetes-with-logistic-regression. End-to-End Data Science. 2018 May; 8. [ Links ]
Received: March 16, 2021; Accepted: May 21, 2021
 Este es un artículo publicado en acceso abierto bajo una licencia Creative Commons
