


Serviços Personalizados
Journal

Artigo
 texto em
  Inglês (pdf)
 Artigo em XML
 Referências do artigo
 Enviar este artigo por email
Indicadores
-
 Citado por SciELO
Links relacionados
-
 Similares em
SciELO
Similares em
SciELO
Compartilhar

 Permalink
Revista de la Facultad de Medicina Humana
versão impressa ISSN 1814-5469versão On-line ISSN 2308-0531
Rev. Fac. Med. Hum. vol.21 no.4 Lima out./dez. 2021
http://dx.doi.org/10.25176/rfmh.v21i4.3987
Original article
Correlation between mortality due to covid-19, wealth index, human development and population density in districts of Lima Metropolitana during 2020.
1Facultad de Medicina Humana, Universidad Ricardo Palma. Lima, Perú.
2Instituto de investigaciones en Ciencias biomédicas. Facultad de Medicina Humana, Universidad Ricardo Palma. Lima, Perú.
3Departamento de Medicina. Hospital Nacional Hipólito Unanue.
Objective:
To determine the correlation between mortality due to COVID-19 and incidence of poverty and district human development index (HDI) in the department of Lima.
Methodology:
An observational, ecological, correlational study. The population were patients who died from COVID-19 in Lima Metropolitana. We included all patients reported dead in the open data base of the Ministerio de Salud. The dependent variable was mortality due to COVID-19, calculated by dividing the number of deaths by the total district population, and the independent variables were the incidence of poverty and HDI. We carried out a secondary analysis evaluating the fatality by COVID-19. The correlation was calculated through Spearman’s non-parametric method.
Results:
13 154 people died of COVID-19 during the period between March and September, the majority was of masculine gender with an average age of 66 years. We did not find a significant correlation between mortality and incidence of poverty (rho=-0,2230; p=0,15). We found a significant correlation between mortality due to COVID-19 and HDI (rho= 0,4466; p=0,002). Mortality was correlated with population density (rho=0,7616; p=<0,001). We found a positive (rho=0,32) and significant (p=0,037) correlation between fatality and incidence of poverty. We found a significant correlation between fatality due to COVID-19 and population density (rho=0,7616; p=<0,001). We did not find a significant correlation between fatality and HDI.
Conclusions:
Population density was a factor associated in the most consistent manner with mortality and fatality due to COVID. Poverty was associated to greater fatality, but not to greater mortality.
Keywords: Coronavirus infection; mortality; poverty; human development index (Source: MeSH NLM).
INTRODUCTION
The pandemic by COVID-19 initiated towards the end of 2019 in the city of Wuhan in China1. This disease has a wide range of clinical symptoms that range from asymptomatic infection, mild deses of upper respiratory tract to a serious viral pneumonia with respiratory distress2,3. However, few research exists that evaluate the correlation between sociodemographic and economic aspects of the populations with mortality by COVID-19.
In international studies, they reference the deaths by COVID-19 are comparable and sometimes superior to the total of deaths by opioids and HIV/AIDS4. In the United States, monetary income inequality is reflected in a greater number of deaths, and this could generate differences found in the different states5. Other studies that have assessed the effect of sociodemographic indicators in rural and urban communities have found an association between socioeconomic status (relative risks [RR] of 1.42 and 1.71) and housing and transportation domains (RR 1.52 and 1.32) with a major risk of COVID-19 diagnosis and death6. Another reported consequence of inequalities is associated with the diagnostic test availability for the entire population. In the beginning of the pandemic, there were more diagnosis in the most unfavorable locations, but this changed over time, a greater number of positive cases in wealthier places began to be reported. The inequalities associated to racial factors have also played a role. For example, a double risk for COVID-19 hospitalizations among the African American population in the United States has been reported7.
A Peruvian study analyzed mortality by non-violent causes and district quintiles, showing a relation between human development index (HDI) and mortality due to COVID-19, with a greater number of deaths due to COVID-19 in quintiles with lower HDI. Although this study did not find a significant association between poverty and mortality, their findings are limited due to short observation time8.
Our study seeks to find a correlation between mortality due to COVID-19, poverty percentage, HDI, and population density in districts within Metropolitan Lima during 2020.
METHODS
Design and Field of study
An observational, ecological, correlational study, conducted based on data from Metropolitan Lima
Population and Sample
The study’s population was made up of all patients that died from COVID-19 in the districts of Metropolitan Lima, for the development of this research we used a free access data base from the Ministerio de Salud del Perú available in the following link: https://www.datosabiertos.gob.pe/dataset/fallecidos-por-covid-19-ministerio-de-salud-minsa/resource/4b7636f3-5f0c-4404-8526.
Variables and instruments
The principal variable was mortality due to COVID-19 and also as potential factors that could influence infection and death rates. These factors can be grouped into four principal categories: population characteristics, environmental/geographical factors, health policy, and virus-related factors.
To perform this study, we used the free-access data base from the Ministerio de Salud del Perú4,9. The HDI statistics and the district poverty rate were obtained from the report: “Herramienta de lucha contra la pobreza-Módulo Perú”.9The demographic density of the districts in Lima was obtained from the study titled: “Provincia de Lima: Compendio estadístico-2017”. This document is part of the last population census and the housing development by the Instituto Nacional de Estadística e Informática (INEI) in 201710
Procedures
Once the consolidated data base was obtained by district, the descriptive analysis was carried out based on the variable type.
Statistical analysis
The descriptive analysis was carried out based on the type of variable. For quantitative variables the measures of central tendency and dispersion were used according to data normality. Frequencies and percentages were used for qualitative variables.
The correlation between mortality due to COVID-19, poverty rate, and population density was calculated using the Spearman correlation method. A value of p<0.05 was considered significant. The statistical analysis was carried out using the Stata V15 Statistical11. At the same time a multivariate analysis (robust regression) was performed.
RESULTS
We analyzed the data of 13,154 people who died due to COVID-19 in Lima from March 18th to September 30th, 2020. 70,9% (9325) of the deceased were males. The districts with greater number of deaths were San Juan de Lurigancho with 11.4% (1,499), Lima with 8.3% (1,096) and San Martin de Porres with 7.0% (919). The districts with fewer number of deaths were the districts of Punta Hermosa (9 deceased), San Bartolo (9 deceased), Punta Negra (2 deceased), Santa María del Mar (1 deceased). The districts with greater fatalities due to COVID-19 were Villa El Salvador (6.04%), La Victoria (5.12%), Chorrillos (5.07%) and San Juan de Lurigancho (4.99%). The districts with lower fatalities due to COVID-19 were Santa María del Mar (1.54%), Jesús María (1.72%) and Punta Negra (2.0%). The total number of deceased per districts are shown inTable 1. Mortality and fatality due to COVID-19 in the same period are shown inTable 2.
Table 3shows the poverty rate and human development index of each district of Lima during 2020. The poverty rate of the districts varied from 0.2% in the district of Miraflores, San Isidro up to 41.1% in the district of Pachacamac and 40.7% in Puente Piedra. With regards to the district HDI, we observe that San Isidro and Miraflores have the highest indexes with 0.809 and 0.790, respectively. The districts with lowest HDI were the districts of Puente Piedra (0.673) and Pachacamac (0.669.Table 3shows a population density of the districts in Lima according to the last census carried out by INEI. We observe that the districts of Punta Negra and Punta Hermosa have the lowest population density with 64 and 67 Inhab/Km2, respectively, while the districts of Surquillo a2the highest levels of population density with 2 6438 and 2 3202 Inhab/Km .
Mortality due to COVID-19 and its correlation with poverty, HDI, and population density
No significant correlation was found between mortality and poverty rate (rho= -0.2230; p=0.150) (Figure 1). A significant correlation was found between mortality due to COVID-19 and HDI (rho= 0.4466; p=0.002) (Figure 1). A significant correlation was found between mortality due to COVID-19 and population density (rho=0.7616; p=<0.001) (Figure 1).
Fatality due to COVID-19 and its correlation with poverty, HDI, and population density
A statistically significant correlation was found between fatality due to COVID-19 and district poverty rate (rho=0.319; p=0.037) (Figure 1). No significant correlation was found between fatality due to COVID-19 and district HDI (rho=-0.106; p=0.501) (Figure 1). A significant correlation was found between fatality due to COVID-19 and population density (rho=0.7616; p=<0.001) (Figure 1).
Additionally, a significant correlation was found between poverty rate and district HDI (rho= -0.8871; p<0,001) (Figure 1).
In the robust regression model used, only population density was a factor associated with mortality due to COVID-19 (Beta coefficient:0.06 CI95%:0.03-0.08; p<0.001). Population density was also associated with fatality due to COVID-19 (Beta coefficient: 0.06 CI95%:0.03-0.08; p<0.001). The results are shown inTable 4, therefore, it is assumed that robust regression associates much more population density with mortality and lethality, being poverty and HDI, nonsignificant variables.
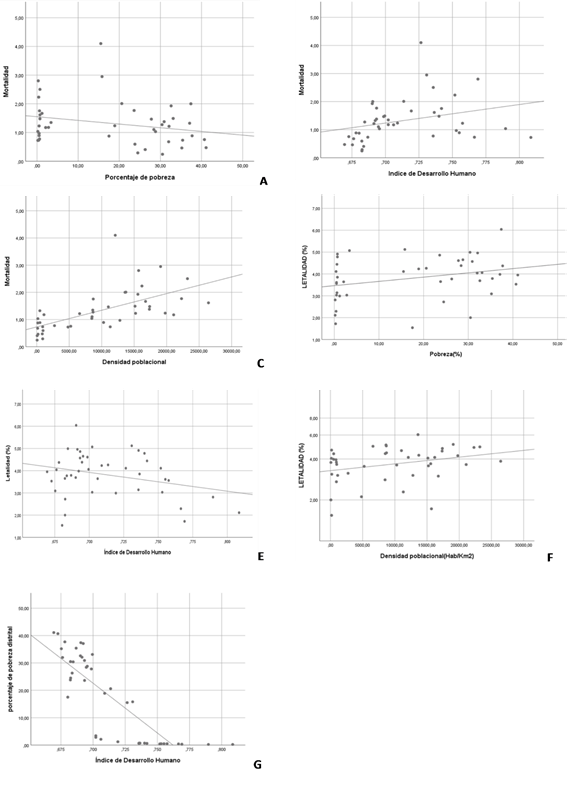
Figure 1: A: Scatter plot: mortality by Covid-19 and district poverty rate. B: Scatter plot: mortality by COVID-19 and district human development index. C: Scatter plot: mortality by COVID-19 and district population density. D: Scatter plot: mortality by COVID-19 and district poverty rate. E: Scatter plot: fatality by COVID-19 and Human Development Index. F: Scatter plot: fatality by COVID-19 and district population density. G: Scatter plot: Dispersion diagram: human development index and percentage of district poverty
Table 1. Frequency of death by COVID-19, Lima 2020
| DISTRICT | DEATHS BY COVID-19 | ||
|---|---|---|---|
| Frequency | % | ||
| San Juan de Lurigancho | 1499 | 11,4 | |
| Lima | 1096 | 8,3 | |
| San Martin de Porres | 919 | 7,0 | |
| Villa el Salvador | 848 | 6,4 | |
| Comas | 841 | 6,4 | |
| Ate | 740 | 5,6 | |
| San Juan de Miraflores | 569 | 4,3 | |
| La Victoria | 556 | 4,2 | |
| Villa Maria del Triunfo | 533 | 4,1 | |
| Chorrillos | 480 | 3,6 | |
| El Agustino | 428 | 3,3 | |
| Los Olivos | 413 | 3,1 | |
| Santa Anita | 392 | 3,0 | |
| Santiago de Surco | 364 | 2,8 | |
| Rimac | 362 | 2,8 | |
| Independencia | 332 | 2,5 | |
| Puente Piedra | 298 | 2,3 | |
| Carabayllo | 293 | 2,2 | |
| Breña | 233 | 1,8 | |
| Jjesus Maria | 229 | 1,7 | |
| Lurigancho | 168 | 1,3 | |
| San Miguel | 168 | 1,3 | |
| Surquillo | 162 | 1,2 | |
| Pueblo Libre | 139 | 1,1 | |
| Lince | 133 | 1,0 | |
| La Molina | 124 | ,9 | |
| Miraflores | 113 | ,9 | |
| Lurin | 97 | ,7 | |
| San Borja | 93 | ,7 | |
| San Luis | 93 | ,7 | |
| Magdalena del Mar | 80 | ,6 | |
| Pachacamac | 67 | ,5 | |
| Barranco | 63 | ,5 | |
| Ancon | 56 | ,4 | |
| Chaclacayo | 52 | ,4 | |
| San Isidro | 49 | ,4 | |
| Pucusana | 22 | ,2 | |
| Cieneguilla | 18 | ,1 | |
| Santa Rosa | 11 | ,1 | |
| Punta Hermosa | 9 | ,1 | |
| San Bartolo | 9 | ,1 | |
| Punta Negra | 2 | ,0 | |
| Santa Maria del Mar | 1 | ,0 | |
| Total | 13154 | 100,0 | |
Table 2. Mortality and Fatality by COVID-19 in Lima ,2020
| DISTRICT | POPULATION | CASES | DEATHS | MORTALITY(x 1000 inhab) | FATALITY(%) |
|---|---|---|---|---|---|
| Villa El Salvador | 423887 | 12326 | 848 | 2,00 | 6,04 |
| La Victoria | 188619 | 9499 | 556 | 2,95 | 5,12 |
| Chorrillos | 355978 | 8390 | 480 | 1,35 | 5,07 |
| San Juan de Lurigancho | 1177755 | 26351 | 1499 | 1,27 | 4,99 |
| Villa María del Triunfo | 437992 | 9562 | 533 | 1,22 | 4,96 |
| Breña | 93111 | 3708 | 233 | 2,50 | 4,91 |
| Santa Anita | 221776 | 7093 | 392 | 1,77 | 4,86 |
| Pueblo Libre | 94010 | 2300 | 139 | 1,48 | 4,78 |
| San Bartolo | 8722 | 172 | 9 | 1,03 | 4,65 |
| Comas | 573884 | 15888 | 841 | 1,47 | 4,61 |
| San Juan de Miraflores | 412865 | 10740 | 569 | 1,38 | 4,57 |
| Barranco | 35915 | 1148 | 63 | 1,75 | 4,44 |
| Ate | 670818 | 14305 | 740 | 1,10 | 4,38 |
| Lurín | 109506 | 1924 | 97 | 0,89 | 4,37 |
| Rímac | 180260 | 7530 | 362 | 2,01 | 4,26 |
| San Martín de Porres | 744050 | 18260 | 919 | 1,24 | 4,23 |
| Lima | 267379 | 23359 | 1096 | 4,10 | 4,11 |
| Lince | 59578 | 2507 | 133 | 2,23 | 4,11 |
| Independencia | 222850 | 7175 | 332 | 1,49 | 4,06 |
| Ancón | 82677 | 1140 | 56 | 0,68 | 4,04 |
| Pucusana | 16615 | 503 | 22 | 1,32 | 3,98 |
| Pachacámac | 142133 | 1417 | 67 | 0,47 | 3,95 |
| Surquillo | 100339 | 3429 | 162 | 1,61 | 3,85 |
| Carabayllo | 400414 | 6596 | 293 | 0,73 | 3,79 |
| Punta Hermosa | 22230 | 159 | 9 | 0,40 | 3,77 |
| El Agustino | 221974 | 10043 | 428 | 1,93 | 3,69 |
| Lurigancho | 283231 | 3949 | 168 | 0,59 | 3,65 |
| Los Olivos | 351983 | 9671 | 413 | 1,17 | 3,64 |
| Santiago de Surco | 408086 | 8231 | 364 | 0,89 | 3,61 |
| Magdalena del Mar | 65139 | 1855 | 80 | 1,23 | 3,56 |
| Puente Piedra | 395819 | 7517 | 298 | 0,75 | 3,53 |
| La Molina | 160244 | 3060 | 124 | 0,77 | 3,14 |
| Cieneguilla | 39055 | 421 | 18 | 0,46 | 3,09 |
| Chaclacayo | 44157 | 1450 | 52 | 1,18 | 3,03 |
| San Miguel | 173309 | 4384 | 168 | 0,97 | 3,03 |
| San Luis | 55793 | 2242 | 93 | 1,67 | 2,99 |
| Miraflores | 108855 | 3170 | 113 | 1,04 | 2,81 |
| Santa Rosa | 37940 | 331 | 11 | 0,29 | 2,72 |
| San Borja | 127102 | 3447 | 93 | 0,73 | 2,29 |
| San Isidro | 67703 | 2129 | 49 | 0,72 | 2,11 |
| Punta Negra | 8243 | 100 | 2 | 0,24 | 2,00 |
| Jesús María | 81743 | 11381 | 229 | 2,80 | 1,72 |
| Santa María del Mar | 1142 | 65 | 1 | 0,88 | 1,54 |
Table 3. Poverty rate and district growth rate in Lima, 2020 and district population density during the last census in Lima
| District | Poverty (%) | Human Development Index (HDI) | District | Population density (Inhab/Km2) |
|---|---|---|---|---|
| Pachacámac | 41,10 | ,669 | Punta Negra | 64.00 |
| Puente Piedra | 40,70 | ,673 | Punta Hermosa | 67.00 |
| Lurín | 37,70 | ,678 | Ancón | 139.00 |
| Villa El Salvador | 37,40 | ,690 | Santa María del Mar | 173.00 |
| Pucusana | 37,10 | ,692 | San Bartolo | 179.00 |
| Carabayllo | 35,40 | ,687 | Cieneguilla | 207.00 |
| Cieneguilla | 35,20 | ,675 | Pucusana | 481.00 |
| Independencia | 33,10 | ,699 | Lurín | 496.00 |
| El Agustino | 32,60 | ,690 | Pachacámac | 855.00 |
| Villa María del Triunfo | 32,10 | ,691 | Carabayllo | 917.00 |
| Ancón | 32,00 | ,676 | Santa Rosa | 921.00 |
| San Juan de Miraflores | 30,90 | ,693 | Lurigancho | 970.00 |
| Punta Negra | 30,50 | ,682 | Chaclacayo | 1119.00 |
| San Juan de Lurigancho | 30,40 | ,685 | La Molina | 2734.00 |
| San Bartolo | 28,80 | ,695 | San Isidro | 4816.00 |
| Ate | 28,40 | ,695 | Puente Piedra | 5241.00 |
| Comas | 27,80 | ,699 | Villa María del Triunfo | 6600.00 |
| Punta Hermosa | 26,30 | ,684 | Miraflores | 8484.00 |
| Santa Rosa | 24,50 | ,683 | Ate | 8515.00 |
| Lurigancho | 23,80 | ,682 | Chorrillos | 8630.00 |
| Santa Anita | 23,60 | ,693 | San Juan de Lurigancho | 8674.00 |
| Rímac | 20,60 | ,714 | Barranco | 8700.00 |
| San Martín de Porres | 18,90 | ,709 | Santiago de Surco | 10290.00 |
| Santa María del Mar | 17,50 | ,680 | Comas | 11021.00 |
| La Victoria | 15,80 | ,731 | San Borja | 11316.00 |
| Lima | 15,50 | ,727 | Lima | 12088.00 |
| Chorrillos | 3,40 | ,702 | San Miguel | 12803.00 |
| Chaclacayo | 2,80 | ,702 | Villa El Salvador | 13594.00 |
| Los Olivos | 2,10 | ,706 | Rímac | 13723.00 |
| San Luis | 1,20 | ,719 | Independencia | 15135.00 |
| Surquillo | ,70 | ,736 | Magdalena del Mar | 15215.00 |
| Pueblo Libre | ,70 | ,740 | El Agustino | 15574.00 |
| Breña | ,70 | ,736 | Jesús María | 15685.00 |
| La Molina | ,60 | ,736 | Lince | 16193.00 |
| Barranco | ,60 | ,742 | San Luis | 16751.00 |
| Santiago de Surco | ,50 | ,755 | San Juan de Miraflores | 17342.00 |
| San Miguel | ,50 | ,753 | Pueblo Libre | 17381.00 |
| Magdalena del Mar | ,50 | ,758 | La Victoria | 19068.00 |
| San Borja | ,40 | ,766 | San Martín de Porres | 19777.00 |
| Lince | ,40 | ,752 | Los Olivos | 21080.00 |
| Jesús María | ,30 | ,769 | Santa Anita | 22291.00 |
| San Isidro | ,20 | ,809 | Breña | 23202.00 |
| Miraflores | ,20 | ,790 | Surquillo | 26438.00 |
Table 4. Factors associated to mortality and fatality by Covid-19 at district level
| Mortality by COVID-19 | Beta coefficient | p- value | CI 95% |
|---|---|---|---|
| Poverty rate | 0,03 | 0,07 | -0,015;0,021 |
| Human development index | 0,46 | 0,90 | -7,35;8,27 |
| Population density | 0,06 | <0,001 | 0,03;0,08 |
| Fatality by COVID-19 | Beta coefficient | p-value | CI 95% |
| Poverty rate | 0,2 | 0,205 | -0,01;0,06 |
| Human development index | -6,56 | 0,370 | -7,35;8,27 |
| Population density | 0,06 | 0,003 | 0,02;0,10 |
DISCUSSION
The results from this study show that mortality due to COVID-19 in the districts of Lima were greater mostly in older adults over 60 years of age and of masculine gender. In addition to this, we were able to determine that from the beginning of the pandemic until the month of September there was a positive correlation (at district level) between fatality due to COVID-19 and poverty rate at the district level. Population density was the factor associated more consistently to mortality and fatality due to COVID-19. For every increase in population density (in one thousand inhabitants), the fatality and mortality from district COVID-19 infection would increase 6%. Poverty was associated with greater fatality, but not with greater mortality.
Deaths due to COVID-19 mostly in older adults of male gender with comorbidities such as hypertension, obesity, diabetes(31-34). Prior studies such Hernández-Vásquez et al.8describe that there is an excess of mortality of 20,093 non-violent deaths and 2,979 COVID-19 confirmed deaths in the department of Metropolitan Lima during the first 24 weeks of the year 2020, where older adults, males, and in poverty were the ones who died most from this disease8.
The main results from this study show that the greater the district poverty, the greater COVID-19 fatality. This resembles prior research such as those of Ogedegbe et al., Gadson et al. and Hernández-Vásquez et al.8among others(14,15). Ogedegbe et al. showed in his study the existence of a substantial variation of COVID-19 fatality in the districts of New York city, determining that zones with greater number of people living in poverty and lower educational levels had higher rates of deaths related to COVID-199. In this same manner, Hernández-Vásquez et al. describe that the excess of deaths due to COVID-19 were greater in the districts with extreme poverty8. The study of these relationships demonstrates the importance of accessibility of district monetary resources facing the fatality of this pandemic, given that districts with less accessibility of economic resources have greater chance of counting on less infrastructure resources and human resources, reporting in turn a greater number of deaths14,15.
This study has evaluated the correlation between fatality and poverty rate at the district level. This study evaluated a smaller population compared to other studies such as Achoki et al. which evaluated countries that showed a similar situation16-18. Achoki et al. Demonstrated that fatality due to COVID-19 (in the beginning of the pandemic) was greater in impoverished countries in continents, such as Africa, and that this too could replicate in countries in Latin America, as we can observe through results from this study18,19.
The main implications in this research were the possibility to determine population groups with greater risk, where the state and health ministry can intervene and target prevention actions such as early detection of cases, of patients with greater risk of infection and mortality, as well as early referral to health establishments with greater complexity, mainly in those districts with higher poverty levels.
The main limitations from this research were related to the data base quality. It is possible that an underreporting of patients who died in the beginning of the pandemic exist, due to lack of knowledge of diagnostic criteria and delay in molecular test results, among others. Since it is an ecological study, the results should be interpreted at a district level and not necessarily at an individual level. However, we consider that the risk of ecological fallacy is highly unlikely.
CONCLUSION
COVID-19 is transmitted directly from person to person, being the cause of many complications such as a trigger of pneumonia, the transmission is among people that keep little distance from each other, this disease will travel through respiratory droplets, this disease spreads when the infected person coughs, this is why the association between mortality and fatality with population density is important, since once there is contact between people the spread is greater. This is shown in the results of robust regression, that when population density in a thousand inhabitants increases, the district fatality due to COVID-19 increased by 6%, and we can also observe that the districts with less population density had less deaths in a bivariate analysis, and it is much more associated in a robust regression, therefore we show that population density is a very relevant factor, with poverty and HDI not having any association.
The prevention of the agglomeration of people is very important in enclosed places or those with poor ventilation, since this would make the spread easier.
REFERENCES
1. Chan JWM, Ng CK, Chan YH, Mok TYW, Lee S, Chu SYY, et al. Short term outcome and risk factors for adverse clinical outcomes in adults with severe acute respiratory syndrome (SARS). Thorax. 2003;58(8):686-9. DOI: 10.1136/thorax.58.8.686 [ Links ]
2. Huang C, Wang Y, Li X, Ren L, Zhao J, Hu Y, et al. Clinical features of patients infected with 2019 novel coronavirus in Wuhan, China. Lancet 2020;395(10223):497-506. DOI: 10.1016/S0140-6736(20)30183-5 [ Links ]
3. Chen N, Zhou M, Dong X, Qu J, Gong F, Han Y, et al. Epidemiological and clinical characteristics of 99 cases of 2019 novel coronavirus pneumonia in Wuhan, China: a descriptive study. Lancet. 2020;395(10223):507-13. DOI: 10.1016/S0140-6736(20)30211-7 [ Links ]
4. Goldstein JR, Lee RD. Demographic perspectives on the mortality of COVID-19 and other epidemics. Proc Natl Acad Sci U S A. 2020;117(36):22035-41. DOI: 10.1073/pnas.2006392117 [ Links ]
5. Oronce CIA, Scannell CA, Kawachi I, Tsugawa Y. Association Between State-Level Income Inequality and COVID-19 Cases and Mortality in the USA. Journal of general internal medicine. 2020; 35:2791-3. DOI: 10.1007/s11606-020-05971-3 [ Links ]
6. Khazanchi R, Beiter ER, Gondi S, Beckman AL, Bilinski A, Ganguli I. County-Level Association of Social Vulnerability with COVID-19 Cases and Deaths in the USA. Journal of general internal medicine. 2020; 35:2784-7. DOI: 10.1007/s11606-020-05882-3 [ Links ]
7. Price-Haywood EG, Burton J, Fort D, Seoane L. Hospitalization and Mortality among Black Patients and White Patients with Covid-19. N Engl J Med. 2020;382(26):2534-43. DOI: 10.1056/NEJMsa2011686 [ Links ]
8. Hernández-Vásquez A, Gamboa-Unsihuay JE, Vargas-Fernández R, Azañedo D. [Excess mortality in Metropolitan Lima during the COVID-19 pandemic: A district level comparison]. Medwave. 2020;20(8):e8031. DOI: 10.5867/medwave.2020.08.8032 [ Links ]
9. Ogedegbe G, Ravenell J, Adhikari S, Butler M, Cook T, Francois F, et al. Assessment of Racial/Ethnic Disparities in Hospitalization and Mortality in Patients With COVID-19 in New York City. JAMA Netw open. 2020;3(12):e2026881. DOI: DOI: 10.1001/jamanetworkopen.2020.26881. [ Links ]
10. INEI. Provincia de Lima: Compendio estadístico-2017. 2017. Disponible en https://www.inei.gob.pe/media/MenuRecursivo/publicaciones_digitales/Est/Lib1477/libro.pdf. Fecha de acceso 8/04/2021. [ Links ]
11. StataCorp. 2017. Stata Statistical Software: Release 15. College Station, TX: StataCorp LLC. [ Links ]
12. Gadson A, Akpovi E, Mehta PK. Exploring the social determinants of racial/ethnic disparities in prenatal care utilization and maternal outcome. Semin Perinatol [Internet]. 2017;1-10. Disponible en: http://dx.doi.org/10.1053/j.semperi.2017.04.008 [ Links ]
13. Abedi, V., Olulana, O., Avula, V. et al. Racial, Economic, and Health Inequality and COVID-19 Infection in the United States. J. Racial and Ethnic Health Disparities (2020). DOI: 10.1007/s40615-020-00833-4 [ Links ]
14. Porcheddu R, Serra C, Kelvin D, Kelvin N, Rubino S. Similarity in Case Fatality Rates (CFR) of COVID-19/SARS-COV-2 in Italy and China. J Infect Dev Ctries. 2020;14(2):125-8. DOI: 10.3855/jidc.12600 [ Links ]
15. Acosta LD. [Response capacity to the COVID-19 pandemic in Latin America and the Caribbean]. Rev Panam Salud Publica. 2020;44:e109. DOI: 10.26633/RPSP.2020.109 [ Links ]
16. Andrades-Grassi JE, Cuesta-Herrera L, Bianchi-Pérez G, Grassi HC, López-Hernández JY, Torres-Mantilla H. Análisis espacial de riesgo de morbilidad y mortalidad por COVID-19 en Europa y el Mediterráneo en el año 2020. Cuad Geográficos. 60(1):279-94. DOI: 10.30827/cuadgeo.v60i1.15492 [ Links ]
17. Ponce P, Loaiza V, del Río M de la C, Parra LB. Efecto de la desigualdad y la actividad económica en el COVID-19 en Ecuador: un bosquejo de sus posibles determinantes económicos, sociales y demográficos. Contaduría y Adm. 2020;65(4):211. DOI:10.22201/fca.24488410e.2020.3044. [ Links ]
18. Achoki T, Alam U, Were L, Gebremedhin T, Senkubuge F, Lesego A, et al. COVID-19 pandemic in the African continent: forecasts of cumulative cases, new infections, and mortality. medRxiv. 2020. Disponible en: https://www.medrxiv.org/content/10.1101/2020.04.09.20059154v3 [ Links ]
19. Schmidt A, Sfeir D, Schlosser H. Correlación entre características psicosociodemográficas con la tasa de mortalidad y letalidad por COVID-19 según región en Chile. Rev ANACEM. 2019;13(1): 10-20. Disponible en: https://docs.bvsalud.org/biblioref/2020/10/1123098/correlation-between-psycho-socio-demographic-variables-and-cov_FyKO8Qx.pdf [ Links ]
Received: June 08, 2021; Accepted: August 05, 2021
 Este es un artículo publicado en acceso abierto bajo una licencia Creative Commons
