


Servicios Personalizados
Revista

Articulo
 texto en
  Inglés (pdf)
 Articulo en XML
 Referencias del artículo
 Enviar articulo por email
Indicadores
-
 Citado por SciELO
Links relacionados
-
 Similares en
SciELO
Similares en
SciELO
Compartir

 Permalink
Revista de la Facultad de Medicina Humana
versión impresa ISSN 1814-5469versión On-line ISSN 2308-0531
Rev. Fac. Med. Hum. vol.22 no.1 Lima ene./mar 2022 Epub 31-Dic-2021
http://dx.doi.org/10.25176/rfmh.v22i1.4333
Original article
Exploration of the Relationship of Sleep Quality in Patients with Diabetic Retinopathy, Villahermosa Tabasco.
2.Universidad Autónoma de Baja California, Ensenada, Baja California Norte México.
3Ophthalmology Service of the Dr. Julian A. Manzur Ocaña ISSET Medical Specialties Center, Villahermosa Tabasco, Mexico.
Introduction:
In recent decades, there has been growing evidence suggesting that too little or too much sleep is associated with adverse health outcomes, including type 2 diabetes. There is a close association between diabetes and diabetic retinopathy (DR), so it is reasonable to assume that sleep may also have associations with DR.
Objective:
To explore the relationship between the perception of sleep quality and the degree of diabetic retinopathy in patients with type 2 Diabetes Mellitus treated at a 3rd level ophthalmological care service.
Results:
Significant correlations were found in: diastolic and systolic blood pressure (0.429), triglycerides and total cholesterol (0.707), glycosylated hemoglobin (HbA1c) and glycemia (0.561), Epworth sleepiness scale (ESS Score) and age (0.394) , ESS Score and weight (0.365), extended STOP questionnaire (Stop Bang) and age (0.317), Stop Bang and weight (0.579), Stop Bang and ESS Score (0.452), insomnia severity index (ISI Score) and Stop Bang (0.460). Although the reduced sample size limited the results in the associations by subgroups in the study, a trend towards an elevation of the ESS score can be seen in the subgroup of patients who reported sleeping 8 hours or more.
Conclusions:
Although the trends are not statistically significant, the authors consider that this finding is congruent with the state of the art on the subject of sleep and metabolic condition of retinopathic diabetic patients (increased trend of ESS score reported in the subgroup of 8 or more hours sleep), it will be necessary to explore this phenomenon in more detail and in a larger number of patients.
Keywords: Sleep; Sleepiness; Diabetes Mellitus; Diabetic Retinopathy (fuente: MeSH NLM).
INTRODUCTION
Sleep is a biobehavioral phenomenon regulated by circadian, homeostatic, and neurohormonal processes.1A highly significant factor can be derived from the effects of sleep duration: the individual's perception of their sleep quality, that is, the assessment on whether the time the person slept produced a restorative effect.
Lack of sleep exerts deleterious effects on metabolic, endocrine, and immune pathways1. In recent decades, there has been growing evidence suggesting that too little and too much sleep is associated with adverse health outcomes, including total mortality2,3, cardiovascular disease, 3,5-7, type diabetes 28, hypertension 3,9, and respiratory disorders, obesity in children and adults10, and self-rated poor health11.
The inability to maintain a normal sleep pattern may involve more than feeling tired the next day, as metabolic control, glucocorticoid production, and blood glucose control are affected12. In recent years, it has been increasingly shown that suboptimal sleep duration and quality (secondary to the changes demanded by a modern 24-hour society) is significantly associated with diabetes mellitus, insulin resistance (IR), and poor glycemic control13-15.
The mechanisms that relate short or long sleep duration to the prevalence and severity of DR are not fully understood, although some postulations can be made. Sleep deprivation can be detrimental with respect to DR, as it has been associated with increased levels of ghrelin and leptin (which increases hunger and decreases satiety, and tips the energy balance towards excess16, as well as insulin resistance and worse glycemic control14,15.
A pro-inflammatory state induced by sleep deprivation is another possible explanation, since inflammatory biomarkers have also been related to DR17,18. Rather, sleep disruption may be a consequence of DR. Nighttime melatonin levels were shown to be altered19. In addition, prolonged sleep duration may promote retinal hypoxia, as rod photoreceptors consume large amounts of energy during darkness by maintaining dark currents, increasing retinal oxygen tension20. It has been suggested that nocturnal oxygen desaturation may induce the expression of vascular endothelial growth factor21, which is known to promote DR.
The present research aims to explore the relationship between the perception of sleep quality and the degree of diabetic retinopathy in patients with type 2 Diabetes Mellitus treated in an ophthalmological care service.
METHODS
Study type and design
A cross-sectional correlation study was conducted in a specialized ophthalmology center in Mexico.
Population and sample
We worked with patients older than 18 years with a diagnosis of DM who attend the consultation of the Ophthalmology Service of the Dr. Julian A. Manzur Ocaña ISSET Medical Specialties Center, in the city of Villahermosa, Tabasco, Mexico in the period between 15 March to April 15, 2021.
Variables and instruments
Diagnosis of diabetes was defined by a fasting glycemia greater than 126 mg / dl (7.0 mmol / L)22, self-report of the diagnosis, previous diagnosis in electronic record, use of hypoglycemic drugs or insulin.
Regarding the evaluation of DR: the ophthalmological examination included visual acuity for each separate eye using the Snellen chart of 11 lines with letter optotypes (categorized from 20/20 to no perception of NPL light)23; slit lamp biomicroscopy, intraocular pressure with integrated tonometer (SL-D701 Topcon) and dilated fundus examination with revision of the vitreous and peripheral retina.
The DR diagnosis was evaluated during funduscopy and was considered present or absent according to the criteria and consensus of the International Retinopathy and Diabetic Macular Edema Severity Scale24, which has been assumed by the American Academy of Ophthalmology. The following severity levels were considered:
1. No apparent retinopathy (DNR) where no clinical alterations are found, although there may be findings by angiography
2. Mild non-proliferative DR (RDNPL) where microaneurysms are present.
3. Moderate non-proliferative DR (RDNPM) adds any lesion in addition to the microaneurysms (spot or flame hemorrhages, cottony exudates, edema, tortuosity of the vessels)
4. Severe non-proliferative RD (RDNPS) presents any of the following: More than 20 retinal hemorrhages in each of the 4 quadrants, venous tortuosity in 2 or more quadrants, intraretinal microvascular abnormalities in one or more quadrants.
5. Proliferative DR (PDR) where neovascularization and / or vitreous or preretinal hemorrhage occurs.
After consultation with the ophthalmology service and for statistical purposes of our study, the following recategorization was carried out:
Category 1: NRD and RDNPL (null or minimal intervention).
Category 2: RDNPM and RDNPS (laser intervention).
Category 3: PDR (surgical intervention and / or antiangiogenic drugs).
Regarding the interviews and questionnaires related to sleep: the variables related to sleep were collected directly and verbally by the researcher applying the following validated surveys in Spanish.
The Epworth Sleepiness Scale (ESE) is widely used for subjective assessment of sleepiness; It is useful to assess the propensity to fall asleep in eight situations, most of them monotonous and some more soporific than others. The subject responds to each item on a scale of 0-3, where 0 means zero probability of falling asleep and 3 high probability. The sum of the scores on each item provides the total score, with a range of 0-24. A total score of less than 10 is considered normal, 10-12 as indicative of marginal sleepiness and above 12 suggestive of excessive sleepiness25.
The STOP questionnaire consists of four questions that assess the presence of intense snoring, daytime sleepiness or fatigue, apneas presented during sleep, and high blood pressure. In the extended model, STOP-Bang, four additional parameters are incorporated: age, gender, body mass index, and neck circumference. The answers to the questions of both questionnaires were designed in a simple Yes / No format and the scores fluctuate between 0 and 4 or 8 points, respectively. Subjects at high risk for Obstructive Sleep Apnea / Hypopnea Syndrome (OSAHS) are identified when at least two (STOP) or three (STOP-Bang) questions are answered affirmatively26.
The Insomnia Severity Index (ISI) is a self-report that assesses the perception of sleep in relation to daytime performance. It comprises five items on the severity of the sleep onset disorder, sleep maintenance and problems waking up in the morning, as well as the interference with daytime functioning and the degree of dissatisfaction with the current sleep pattern.
In the version of each of the 5 items, it is evaluated on a 5-point scale that consists of: “0 = nothing; 1 = a little; 2 = something; 3 = a lot; 4 = very much ”. With a result of 0 to 28.
In the case of the Sierra JC version27, this instrument was developed with the aim of creating a short questionnaire to assess the severity of the day and night components of insomnia. It is made up of 7 items that assess the nature, severity and impact of insomnia. It is answered with a LIKERT-type scale that goes from 0 to 4, taking into account the last month.
For its correction, a total score is obtained that ranges between 0 and 28. The proposed cut-off points of the original version are:
- 0-7: no insomnia
- 8-14: insomnia below threshold
-15-21: clinical insomnia of moderate severity
-22-28: severe clinical insomnia18.
In addition to the data collected in the surveys, a questionnaire was applied with the following items: age (in years), gender (male-female), hours of sleep (number of hours), years of evolution of diabetes, level of education (none , primary, secondary, preparatory, university), smoking (absent-present) use of insulin (yes-no), diagnosis of hypertension (yes-no and how many years of evolution) and pharmacological treatment of the same (yes-no), as well as previous procedures for each eye.
Regarding the evaluation of other biomarkers: blood pressure was measured in mm / hg using a digital baumanometer (Omron HEM 6123), weight and height using a wall scale (Hergom Medical), body mass index (BMI) was determined Using the formula: weight between age in square meters (kg / m2) and obesity was defined as a BMI greater than 27.5 kg / m2.
The values of total cholesterol (mg / dl), triglycerides (mg / dl) and HbA1c (%) were taken from the most recent reports of the electronic file.
The values of total cholesterol (mg / dl), triglycerides (mg / dl) and HbA1c (%) were taken from the most recent reports of the electronic file.
Procedures
The survey was carried out in patients during their care in the office, after applying informed consent. The physical examination and ophthalmological evaluation were performed during this care. The rest of the examinations were collected from the medical records. All data were collected once the participants had given their informed consent.
Statistic analysis
Statistical analyzes were done using the statistical language R, version 4.0.328. The categorical variables were evaluated with Chi square and those numerical with the Kruskal-Wallis test to compare the clinical and demographic characteristics of the participants between categories of interest. For variables with statistically significant differences, post-hoc analyzes were performed using the Wilcoxon paired rank test. Subsequently, correlation analysis was carried out on the numerical variables by Pearson's correlation coefficient and visualizations of the data distributions by severity of diabetic retinopathy and statistically significant variables in the previous steps stratified by number of hours of sleep.
RESULTS
A total of 50 participants were included in the analysis; 2% (n = 1) with type 1 DM, 48% with type 2 DM (n = 49). According to sex: 48% (n = 24) female and 52% (n = 26) male. The mean age n (SD) was 58.7 (10.1) years. The average age of duration of DM was 15 years. Average weight: 75 kg (16.1) Average height: 1.60 mtr. The DR categories were as follows: Category 1: 24 (48.0%); Category 2: 16 (32.0%); Category 3: 10 (20.0%) The mean duration of sleep (SD) was 7.94 hrs. 6% (n = 3), 40% (n = 20), 54% (n = 27) had short, normal, or long SD respectively; the most frequent degree of education was secondary 36% (n = 18); use of insulin in 32% (n = 16); present smoking 7.4% (n = 2); Average total triglycerides: 257 [77.0, 1200 mg / dl] mg / dl. Average total cholesterol: 209 mg / dl [110.506 mg / dl]. Average glycemia 170.5mg / dl [71.474 mg / dl]. Systolic blood pressure: 131mmHg (19.2mmHg); diastolic blood pressure 78.0mmHg (12.2mmHg); Average HbA1c: 8.29% (2.76%) (table 1).
Table 1. Clinical and demographic characteristics of the study participants
| Total (N=50) | |
| Age | |
| arithmetic average | 58.7 (10.1) |
| Median [Min, Max] | 58.0 [26.0, 86.0] |
| Gender | |
| Femenine | 24 (48.0%) |
| Masculine | 26 (52.0%) |
| Diabetes duration | |
| Mean (SD) | 15.0 (9.00) |
| Median [Min, Max] | 15.0 [1.00, 35.0] |
| Insulin Use | |
| Absent | 34 (68.0%) |
| Present | 16 (32.0%) |
| Weight | |
| Mean (SD) | 75.0 (16.1) |
| Median [Min, Max] | 72.3 [49.0, 125] |
| Cholesterol | |
| Mean (SD) | 209 (65.2) |
| Median [Min, Max] | 200 [110, 506] |
| Missing | 5 (10.0%) |
| Triglycerides | |
| Mean (SD) | 257 (194) |
| Median [Min, Max] | 199 [77.0, 1200] |
| Missing | 8 (16.0%) |
| HbA1c | |
| Mean (SD) | 8.29 (2.76) |
| Median [Min, Max] | 7.43 [4.30, 13.5] |
| Missing | 18 (36.0%) |
| Height in Meters | |
| Mean (SD) | 1.60 (0.0864) |
| Median [Min, Max] | 1.59 [1.43, 1.80] |
| Retinopathy grade | |
| Category 1 | 24 (48,0%) |
| Category 2 | 16 (32,0%) |
| Category 3 | 10 (20,0%) |
| Blood.pressure.SYSTOLIC | |
| Mean (SD) | 131 (19.2) |
| Median [Min, Max] | 130 [80.0, 180] |
| DIASTOLIC.arterial.pressure | |
| Mean (SD) | 78.0 (12.2) |
| Median [Min, Max] | 80.0 [50.0, 110] |
Other previously reported procedures: Pterygium resection, cataract surgery, application of antiangiogenics, Yag laser, Argon laser, vitrectomy.
Other added ocular conditions found: primary open angle glaucoma, neovascular glaucoma, macular edema, cataract, pterygium.
Other non-ocular conditions reported: hemodialysis, peritoneal dialysis, heart disease and anemia. Of the previous procedures reported and other added ocular conditions mentioned did not present statistical relevance in the initial examinations.
The clinical and demographic characteristics of the study participants stratified by sleep duration are shown intable 2.
Table 2. Clinical and demographic characteristics of the study participants stratified by sleep duration
| < 6h (N=3) | 6 ≤ h < 8 (N=20) | ≥ 8h (N=27) | p-value | |
| Gender | ||||
| Feminine | 1 (33.3%) | 12 (60.0%) | 11 (40.7%) | 0.434 |
| Male | 2 (66.7%) | 8 (40.0%) | 16 (59.3%) | |
| Age | ||||
| Mean (SD) | 62.0 (10.5) | 59.5 (12.8) | 57.9 (7.70) | 0.806 |
| Median [Min, Max] | 63.0 [51.0, 72.0] | 55.5 [26.0, 86.0] | 58.0 [43.0, 74.0] | |
| Hours of sleep | ||||
| Mean (SD) | 5.00 (0) | 6.60 (0.503) | 9.26 (1.02) | <0.001 |
| Median [Min, Max] | 5.00 [5.00, 5.00] | 7.00 [6.00, 7.00] | 9.00 [8.00, 11.0] | |
| Studies | ||||
| Preparatory | 2 (66.7%) | 1 (5.0%) | 6 (22.2%) | 0.208 |
| Secondary | 1 (33.3%) | 6 (30.0%) | 10 (37.0%) | |
| None | 0 (0%) | 1 (5.0%) | 0 (0%) | |
| Primary | 0 (0%) | 6 (30.0%) | 5 (18.5%) | |
| college | 0 (0%) | 6 (30.0%) | 6 (22.2%) | |
| Smoking | ||||
| Absent | 3 (100%) | 20 (100%) | 25 (92.6%) | 0.576 |
| Present | 0 (0%) | 0 (0%) | 2 (7.4%) | |
| Duration of Diabetes | ||||
| Mean (SD) | 17.0 (6.25) | 13.9 (9.08) | 15.6 (9.36) | 0.829 |
| Median [Min, Max] | 15.0 [12.0, 24.0] | 14.5 [1.00, 32.0] | 15.0 [1.00, 35.0] | |
| Insulin Use | ||||
| Absent | 2 (66.7%) | 12 (60.0%) | 20 (74.1%) | 0.72 |
| Present | 1 (33.3%) | 8 (40.0%) | 7 (25.9%) | |
| Weight | ||||
| Mean (SD) | 65.2 (6.53) | 75.2 (14.9) | 76.0 (17.6) | 0.471 |
| Median [Min, Max] | 63.0 [60.0, 72.5] | 74.0 [53.0, 116] | 72.0 [49.0, 125] | |
| Glycemia | ||||
| Mean (SD) | 143 (57.7) | 174 (77.0) | 190 (89.9) | 0.52 |
| Median [Min, Max] | 110 [109, 210] | 161 [71.0, 361] | 191 [87.5, 474] | |
| Cholesterol | ||||
| Mean (SD) | 50.0 (86.6) | 206 (95.1) | 190 (71.5) | 0.0482 |
| Median [Min, Max] | 0 [0, 150] | 204 [0, 506] | 200 [0, 337] | |
| Triglycerides | ||||
| Mean (SD) | 50.0 (86.6) | 258 (254) | 202 (154) | 0.12 |
| Median [Min, Max] | 0 [0, 150] | 184 [0, 1200] | 179 [0, 641] | |
| HbA1c | ||||
| Mean (SD) | 4.73 (4.96) | 4.05 (4.54) | 6.30 (4.51) | 0.241 |
| Median [Min, Max] | 4.30 [0, 9.90] | 2.50 [0, 11.5] | 6.20 [0, 13.5] |
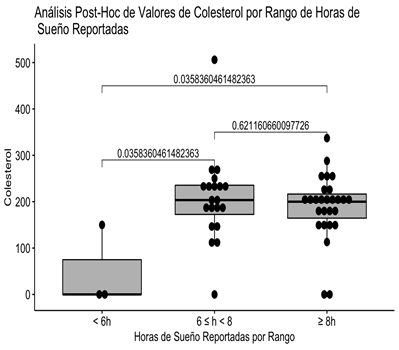
It can be clearly seen that the statistically significant difference is due to the fact that the subgroup that reported sleeping less than 6 hours only contains 3 patients and of these only 1 has the Cholesterol value present, so the significant difference is spurious (Fig 1).
Table 3. Characteristics of the participants stratified by category of severity of diabetic retinopathy
| Category 1 (N=24) | Category 2 (N=16) | Categorya 3 (N=10) | p-value | |
| Gender | ||||
| Feminine | 15 (62.5%) | 6 (37.5%) | 3 (30.0%) | 0.166 |
| Male | 9 (37.5%) | 10 (62.5%) | 7 (70.0%) | |
| Age | ||||
| Mean (SD) | 57.9 (10.3) | 59.8 (9.70) | 59.1 (10.9) | 0.895 |
| Median [Min, Max] | 56.5 [26.0, 76.0] | 59.0 [46.0, 86.0] | 58.5 [43.0, 76.0] | |
| Hours of sleep | ||||
| Mean (SD) | 8.08 (1.82) | 7.75 (1.65) | 7.90 (1.60) | 0.877 |
| Median [Min, Max] | 8.00 [5.00, 11.0] | 7.00 [5.00, 10.0] | 8.50 [5.00, 10.0] | |
| Studies | ||||
| Preparatory | 5 (20.8%) | 2 (12.5%) | 2 (20.0%) | 0.504 |
| Primary | 7 (29.2%) | 3 (18.8%) | 1 (10.0%) | |
| Secondary | 5 (20.8%) | 8 (50.0%) | 4 (40.0%) | |
| college | 7 (29.2%) | 2 (12.5%) | 3 (30.0%) | |
| None | 0 (0%) | 1 (6.2%) | 0 (0%) | |
| Smoking | ||||
| Absent | 23 (95.8%) | 16 (100%) | 9 (90.0%) | 0.691 |
| Present | 1 (4.2%) | 0 (0%) | 1 (10.0%) | |
| Duration of Diabetes | ||||
| Mean (SD) | 11.1 (7.59) | 20.3 (8.41) | 15.9 (9.23) | 0.00917 |
| Median [Min, Max] | 8.50 [1.00, 26.0] | 19.0 [3.00, 35.0] | 16.0 [1.00, 35.0] | |
| Insulin Use | ||||
| Absent | 18 (75.0%) | 9 (56.2%) | 7 (70.0%) | 0.527 |
| Present | 6 (25.0%) | 7 (43.8%) | 3 (30.0%) | |
| Weight | ||||
| Mean (SD) | 75.9 (19.0) | 73.8 (13.4) | 74.6 (13.5) | 0.974 |
| Median [Min, Max] | 72.0 [49.0, 125] | 73.8 [55.0, 94.0] | 74.5 [56.0, 98.0] | |
| Glycemia | ||||
| Mean (SD) | 167 (90.7) | 206 (79.6) | 171 (64.1) | 0.212 |
| Median [Min, Max] | 128 [71.0, 474] | 197 [82.0, 364] | 140 [87.5, 257] | |
| Cholesterol | ||||
| Mean (SD) | 197 (47.3) | 222 (91.5) | 218 (57.6) | 0.392 |
| Median [Min, Max] | 200 [110, 337] | 211 [114, 506] | 227 [113, 288] | |
| Missing | 1 (4.2%) | 2 (12.5%) | 2 (20.0%) | |
| Triglycerides | ||||
| Mean (SD) | 217 (133) | 346 (291) | 233 (123) | 0.184 |
| Median [Min, Max] | 179 [77.0, 641] | 263 [108, 1200] | 200 [93.0, 413] | |
| Missing | 1 (4.2%) | 4 (25.0%) | 3 (30.0%) | |
| HbA1c | ||||
| Mean (SD) | 8.06 (3.18) | 9.44 (2.19) | 6.75 (1.83) | 0.127 |
| Median [Min, Max] | 6.25 [4.30, 13.5] | 9.90 [5.50, 12.4] | 6.50 [5.00, 10.1] | |
| Missing | 9 (37.5%) | 5 (31.2%) | 4 (40.0%) | |
| hours Range | ||||
| < 6h | 1 (4.2%) | 1 (6.2%) | 1 (10.0%) | 0.877 |
| 6 ≤ h < 8 | 9 (37.5%) | 8 (50.0%) | 3 (30.0%) | |
| ≥ 8h | 14 (58.3%) | 7 (43.8%) | 6 (60.0%) |
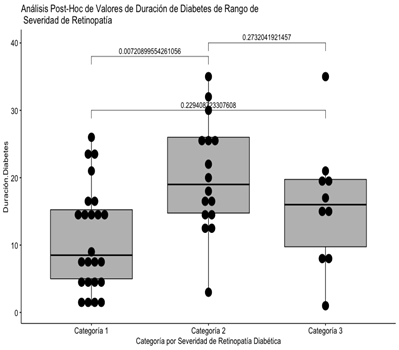
Figure 2: Post-hoc analysis of the severity categories of diabetic retinopathy compared to the duration of diabetes
It can be seen that the statistically significant difference is found in the pair represented by categories 1 and 2 with respect to the reported duration of diabetes.
The significant correlations are mentioned below: Diastolic and Systolic Blood Pressure (0.429), Triglycerides and Total Cholesterol (0.707), HbA1c and Glycemia (0.561), ESS Score and Age (0.394), ESS Score and Weight (0.365), Stop Bang and Age (0.317), Stop Bang and Weight (0.579), Stop Bang and ESS Score (0.452), ISI Score and Stop Bang (0.460) (Fig. 3).
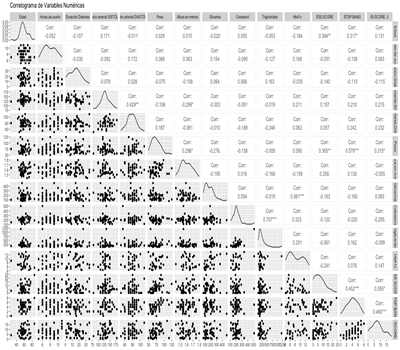
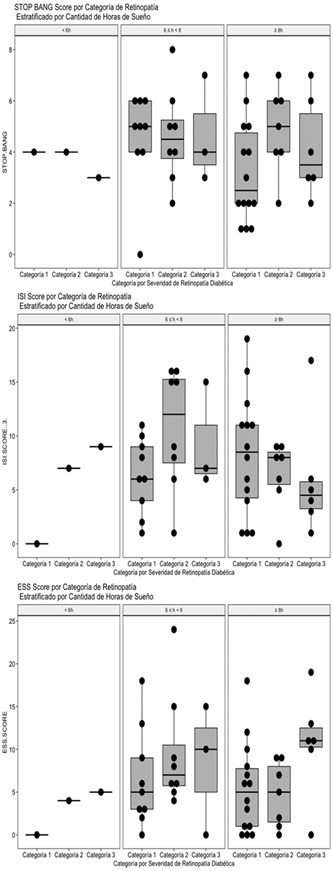
Figure 4: Distribution of global values of the Stop Bang Score (A), ISI Score (B) and ESS Score (C) by category of severity of diabetic retinopathy stratified by number of reported hours of sleep.
As can be seen inFig. 4A, with the data included in this study, a relationship between the severity of diabetic retinopathy, the reported hours of sleep and the global Stop Bang score is not appreciated.
In the results, as with the Stop Bang score, with the data included in this study, a relationship between the severity of diabetic retinopathy, the reported hours of sleep and the global ISI score is not appreciated (Fig. 4B).
Unlike the other two scores, in this case a trend towards an elevation of the ESS score can be seen in the subgroup of patients who reported sleeping 8 hours or more (Fig. 4C), although the trend is not statistically significant. consider that this finding is congruent with the state of the art on the subject of sleep and metabolic condition of retinopathy diabetic patients, it will be necessary to explore this phenomenon in more detail and in a greater number of patients.
DISCUSSION
For the purposes of our study: the quality and quantity of sleep, indirectly evaluated by the daytime sleepiness reported by the patients (ESS Score) shows a tendency to rise in those who reported sleep ranges outside the physiologically appropriate (≥ 8 hrs) , we can also find characteristics of the population consistent with the clinical reality studied, such as the directly proportional correlations between the reported serum levels of triglycerides and total cholesterol, the HbA1c and reported serum glycemia, the ESS score and age and weight, the Stop score Bang and age and weight, the Stop Bang score and the ESS score as well as the ISI score and the Stop Bang. Despite the findings in these correlations, the numerical results are not consistent with them, the authors consider that this phenomenon is due to the limited population sample of the study. Future work will seek to strengthen the size of the population to improve the sample universe in order to clarify the results.
Our study explores a clinical reality in Latin American retinopathy diabetic patients consistent with the scientific literature that has explored and reported similar findings in populations from other geographic regions in the world. Given that, up to the knowledge that the authors have on the subject, this is the first study of these characteristics carried out in a specific Latin American population, it is striking that the trends observed in the results are congruent with that reported by other authors in other geographic regions. worldwide.
Good control of blood glucose and other systemic risk factors such as hypertension and hyperlipidemia are the main objective for the prevention of ocular complications in diabetes mellitus. The authors consider it important to integrate the assessment of sleep quality in the retinopathy diabetic patient to strengthen the care strategy, in collaboration with experts in lifestyle medicine. The data suggest that optimization of the duration and quality of sleep should be tested as an intervention to improve glucose control in patients with type 2 diabetes.
The limitations of the study lie mainly in the small sample size, which could limit the statistical power to find some associations. However, given the nature of the study, the results are of great importance. As future work, the authors propose to increase the sample size significantly, as well as the subgroups in the same representative of the intervals of reported hours of sleep.
CONCLUSION
Although the trends are not statistically significant, the authors consider that this finding is congruent with the state of the art on the subject of sleep and metabolic condition of retinopathic diabetic patients (trend of elevated ESS score reported in the subgroup of 8 or more hours of sleep ), it will be necessary to explore this phenomenon in more detail and in a larger number of patients.
Acknowledgments:
The authors wish to thank the physicians of the Ophthalmology Service of the Dr. Julian A. Manzur Ocaña ISSET Center for Medical Specialties, Villahermosa Tabasco, Mexico for the facilities provided to carry out this study.
Dr. José de Jesús Larios Muñoz. Department head.
Dr. Daniel Osvaldo Montaño López.
Dr. Carlos Zaldivar Ponce.
REFERENCES
1. Bowden J, Tierney JF, Copas AJ, Burdett S. Quantifying, displaying and accounting for heterogeneity in the meta-analysis of RCTs using standard and generalised Q statistics. BMC Med Res Methodol. 2011;11(1):1-12. [ Links ]
2. Altaf Q, Dodson P, Ali A, Raymond N, Wharton H, Fellows H, et al. Obstructive sleep apnoea is associated with sight threatening retinopathy and predicts the development of preproliferative and proliferative retinopathy in patients with Type 2 diabetes: a longitudinal analysis: P584. Diabet Med. 2013;30. [ Links ]
3. Cappuccio FP, Stranges S, Kandala N-B, Miller MA, Taggart FM, Kumari M, et al. Gender-specific associations of short sleep duration with prevalent and incident hypertension: the Whitehall II Study. Hypertension. 2007;50(4):693-700. [ Links ]
4. Kripke DF, Garfinkel L, Wingard DL, Klauber MR, Marler MR. Mortality associated with sleep duration and insomnia. Arch Gen Psychiatry. 2002;59(2):131-6. [ Links ]
5. Meisinger C, Heier M, Löwel H, Schneider A, Döring A. Sleep duration and sleep complaints and risk of myocardial infarction in middle-aged men and women from the general population: the MONICA/KORA Augsburg cohort study. Sleep. 2007;30(9):1121-7. [ Links ]
6. Ikehara S, Iso H, Date C, Kikuchi S, Watanabe Y, Wada Y, et al. Association of sleep duration with mortality from cardiovascular disease and other causes for Japanese men and women: the JACC study. Sleep. 2009;32(3):295-301. [ Links ]
7. Stone KL, Ewing SK, Ancoli-Israel S, Ensrud KE, Redline S, Bauer DC, et al. Self-reported sleep and nap habits and risk of mortality in a large cohort of older women. J Am Geriatr Soc. 2009;57(4):604-11. [ Links ]
8. Cappuccio FP, D'Elia L, Strazzullo P, Miller MA. Quantity and quality of sleep and incidence of type 2 diabetes: a systematic review and meta-analysis. Diabetes Care. 2010;33(2):414-20. [ Links ]
9. Gangwisch JE, Heymsfield SB, Boden-Albala B, Buijs RM, Kreier F, Pickering TG, et al. Short sleep duration as a risk factor for hypertension: analyses of the first National Health and Nutrition Examination Survey. hypertension. 2006;47(5):833-9. [ Links ]
10. Cappuccio FP, Taggart FM, Kandala N-B, Currie A, ChB M, Peile E, et al. Meta-Analysis of Short Sleep Duration and Obesity in Children and Adults. 2008;31(5):8. [ Links ]
11. Steptoe A, Peacey V, Wardle J. Sleep Duration and Health in Young Adults. ARCH INTERN MED. 2006;166:4. [ Links ]
12. Cunha MCB da, Zanetti ML, Hass VJ. Sleep quality in type 2 diabetics. Rev Lat Am Enfermagem. 2008;16(5):850-5. [ Links ]
13. Sánchez LFP. Alteraciones del sueño y diabetes mellitus. [ Links ]
14. Lee SWH, Ng KY, Chin WK. The impact of sleep amount and sleep quality on glycemic control in type 2 diabetes: a systematic review and meta-analysis. Sleep Med Rev. 2017;31:91-101. [ Links ]
15. Buxton OM, Pavlova M, Reid EW, Wang W, Simonson DC, Adler GK. Sleep restriction for 1 week reduces insulin sensitivity in healthy men. Diabetes. 2010;59(9):2126-33. [ Links ]
16. Taheri S, Lin L, Austin D, Young T, Mignot E. Short sleep duration is associated with reduced leptin, elevated ghrelin, and increased body mass index. PLoS Med. 2004;1(3):e62. [ Links ]
17. Grandner MA, Sands-Lincoln MR, Pak VM, Garland SN. Sleep duration, cardiovascular disease, and proinflammatory biomarkers. Nat Sci Sleep. 2013;5:93. [ Links ]
18. Tang J, Kern TS. Inflammation in diabetic retinopathy. Prog Retin Eye Res. 2011;30(5):343-58. [ Links ]
19. Hikichi T, Tateda N, Miura T. Alteration of melatonin secretion in patients with type 2 diabetes and proliferative diabetic retinopathy. Clin Ophthalmol Auckl NZ. 2011;5:655. [ Links ]
20. Linsenmeier RA. Effects of light and darkness on oxygen distribution and consumption in the cat retina. J Gen Physiol. 1986;88(4):521-42. [ Links ]
21. Lavie L, Kraiczi H, Hefetz A, Ghandour H, Perelman A, Hedner J, et al. Plasma vascular endothelial growth factor in sleep apnea syndrome: effects of nasal continuous positive air pressure treatment. Am J Respir Crit Care Med. 2002;165(12):1624-8. [ Links ]
22. Diagnosis | ADA [Internet]. [citado el 25 de abril de 2021]. Disponible en: https://www.diabetes.org/a1c/diagnosis [ Links ]
23. Azzam D, Ronquillo Y. Snellen Chart. En: StatPearls [Internet]. Treasure Island (FL): StatPearls Publishing; 2021 [citado el 25 de abril de 2021]. Disponible en: http://www.ncbi.nlm.nih.gov/books/NBK558961/ [ Links ]
24. Proposed international clinical diabetic retinopathy and diabetic macular edema disease severity scales - ScienceDirect [Internet]. [citado el 25 de abril de 2021]. Disponible en: https://www.sciencedirect.com/science/article/abs/pii/S0161642003004755 [ Links ]
25. Sandoval-Rincón M, Alcalá-Lozano R, Herrera-Jiménez I. Validación de la escala de somnolencia de Epworth en la población mexicana. Gac Médica México. :8. [ Links ]
26. SALDÍAS PEÑAFIEL F, GASSMANN PONIACHIK J, CANELO LÓPEZ A, URIBE MONASTERIO J, DÍAZ PATIÑO O. Evaluación de los cuestionarios de sueño en la pesquisa de pacientes con síndrome de apneas obstructivas del sueño. Rev Médica Chile. 2018;146(10):1123-34. [ Links ]
27. Fernandez-Mendoza J, Rodriguez-Muñoz A, Vela-Bueno A, Olavarrieta-Bernardino S, Calhoun SL, Bixler EO, et al. The Spanish version of the Insomnia Severity Index: a confirmatory factor analysis. Sleep Med. 2012;13(2):207-10. [ Links ]
28. R Core Team. R: A Language and Environment for Statistical Computing [Internet]. Vienna, Austria: R Foundation for Statistical Computing; 2020. Disponible en: https://www.R-project.org/ [ Links ]
Received: October 26, 2021; Accepted: December 07, 2021
 Este es un artículo publicado en acceso abierto bajo una licencia Creative Commons
