


Servicios Personalizados
Revista

Articulo
 texto en
  Inglés (pdf)
 Articulo en XML
 Referencias del artículo
 Enviar articulo por email
Indicadores
-
 Citado por SciELO
Links relacionados
-
 Similares en
SciELO
Similares en
SciELO
Compartir

 Permalink
Revista de la Facultad de Medicina Humana
versión impresa ISSN 1814-5469versión On-line ISSN 2308-0531
Rev. Fac. Med. Hum. vol.22 no.2 Lima abr./jun 2022 Epub 16-Mar-2022
http://dx.doi.org/10.25176/rfmh.v22i2.4787
Original article
Current status of general resources and operation of pediatric emergency departments of Latin American public hospitals (Study RFSEPLA)
1Hospital de Pediatría Juan P. Garrahan, Ciudad Autónoma de Buenos Aires-Argentina
2Hospital de Niños Victor J. Vilela-Argentina
3Fundación Valle de Lili. Cali-Colombia
4Hospital Nacional de Niños ¨Dr. Carlos Sáenz Herrera¨, CCSS. San José-Costa Rica
5Hospital Sant Joan de Déu. Barcelona-España
Introduction:
To improve the quality of care in Pediatric Emergency Services (SEP) it is essential to carry out measurements and surveys.
Materials and Methods:
Descriptive, quantitative and retrospective study. Survey conducted in SEP of Latin American hospitals with public funding and with PICU (2019). Data processed by REDcap and InfoStat programs. Continuous variables are presented as medians and ranges; categorical variables as percentages; productivity / resource ratios as a ratio. Univariate analysis was performed.
Results:
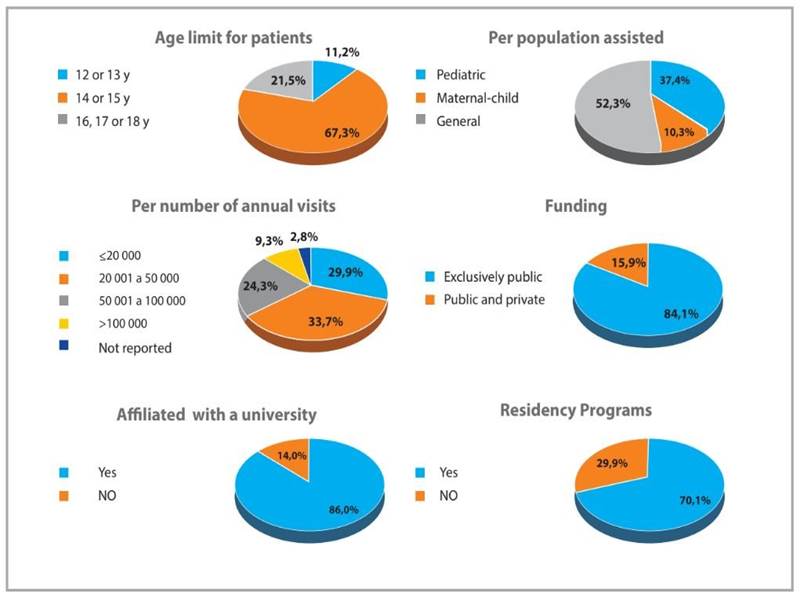
Of 371 services in 17 countries, 107 (28.8%) answered the survey; 102 (95.3%) have an observation area and 42 (39.3%) have isolation rooms. The medians of annual visits / observation bed and daily visits / clinic were 4830.6 and 24.4, respectively. The number of beds increased by 74.1% in the seasonal peak, 6.1% of the consultations required hospitalization and 2.0% were assisted in the Resuscitation Sector. 37 (34.6%) SEP have> 80% of 27 items considered essential by the International Emergency Federation, 43 (40.2%) lack complete airway equipment and 74 (69.2%) perform triage. The median number of daily consultations is 38.4 / doctor and 35.3 / nurse. In 72 (67.9%) SEP there is a doctor and a nurse coordinator per shift, in 83 (77.6%) computerized data are handled, in 25 (23.4%) they do not perform diagnostic coding and in 16 (15% ) discharge summary is not prepared. 68 (64.1%) SEP use 5 protocols for critical situations, in 10 (9.4%) the medical personnel have teaching / research hours and in 43 (41%) there is a quality improvement plan.
Keywords: Pediatric emergencies; Quality; Preparation; Survey; Resources.(fuente: MeSH NLM).
INTRODUCTION
Pediatric emergency and urgent care have increased over the last 30 years, leading to the need to adapt in order to provide quality care, dened by the WHO as “the degree to which the health services for individuals and populations increase the likelihood of desired health outcomes”; quality health services should be "effective,safe,people-centred,timely,equitable, integrated and efficient"1.Health agencies from different countries and international institutions have developed standards and indicators to improve the quality of care in PEDs2,10. It is essential to carry out measurements and surveys to know the status, needs, and opportunities for improvement11-17; so far, such studies have not been published in Latin America.
OBJECTIVE
This study aims to describe the general resources and operations of SEPs in publicly managed hospitals in Latin America.
METHODS
Study design type and area
A retrospective, cross-sectional, quantitative, descriptive study was conducted consisting of a survey to collect data on the structure and operation of PEDs in Latin America in 2019.
Population and sample
The survey was sent to the chairs of PEDs of Latin America public hospitals. Since hospital complexity is classified differently in the countries of the region and to focus on the institutions that offer the best possibility of developing the specialty of Pediatric Emergency Medicine, public hospitals thathaveapediatric intensive care unit (PICU) and are nanced entirely or partially by the public sector were included. Centers that did not send the Condentiality Agreement(CA) signed by the hospital director or the head of the Research Committee were excluded.
Instrument and variables
The assessment instrument was a survey based on documents,questionnaires,and reports of quality indicators published by national and international agencies9,10,12,14and was subsequently revised by experts in Pediatric Emergency Medicine belonging to the Safety and Quality Committee of the Sociedad Latinoamericana de Emergencias Pediátricas (SLEPE) and the Red de Investigación y Desarrollo de la Emergencia Pediátrica Latino americana(RIDEPLA). Data on productivity and physical, human, regulatory, and management resources for 2019 were collected. The survey consisted of 133 questions grouped into 8 sections:institutional information, facilities, equipment, electronic records and online resources, human resources,available specialist consultation, teaching and research activity,emergencycare protocols, and quality and safety procedures.
The research team included 28 On-site Collaborators (OC)from 17 Latin-American countries.The OCs prepared the lists of hospitals that met the inclusion criteria in their countries, contacted the chairs of the PEDs,and accompanied the respondents in the processes of signing the CA and data collection.
Analysis of data
The data collection and analysis was carried out on the REDCAP platform (Research Electronic Data Capture: https://www.project-redcap.org), and the InfoStat version 2020 program was also used for data analysis (National University of Córdoba, Argentina: http://www.infostat.com.ar) was used.
The normality of the distribution of quantitative data was evaluated using the Shapiro-Wilk test. None of the continuous variables showed normality; therefore, the medians and interquartile ranges are reported. Categorical variables are expressed as numbers and percentages. For between-group comparison the Chi-square test was used. The level of significance was set at 0.05. Relationship between healthcare productivity data and structural resources was reported as ratios.
Ethical Aspects
The study protocol, the survey, and the ACI were approved by the Research and Ethics Committees of Hospital Garrahan and sent to the heads of the SEPs. Once the ACI was signed by the General Director of each hospital or by the head of the Research Committee, the survey was sent online through the REDCap program. The study was conducted from December 1st, 2019 to December 8th, 2020.
RESULTS
Institutional information
Table 1shows the number and percentage of hospitals identified, contacted, and participating in each country. Contact could not be established with the SEP of Haiti, Cuba, and Venezuela.
Table 1. Hospitals and participants identified by country
| Country | Identified / contacted n / n | Responded - (% of total identified) n (%) |
|---|---|---|
| Argentina | 66 / 66 | 63 (95) |
| Bolivia | 8 / 8 | 7 (88) |
| Brasil | 161 / 70 | 1 (0,0) |
| Chile | 25 / 16 | 3 (12) |
| Colombia | 6 / 6 | 1 (17) |
| Costa Rica | 1 / 1 | 1 (100) |
| Ecuador | 4 / 4 | 3 (75) |
| El Salvador | 3 / 2 | 2 (66,7) |
| Guatemala | 1 / 1 | 1 (100) |
| Honduras | 2 / 2 | 1 (50) |
| México | 57 / 38 | 13 (22,8) |
| Nicaragua | 1 / 1 | 0 (0) |
| Panamá | 3 / 3 | 1 (33) |
| Paraguay | 7 / 7 | 5 (71) |
| Perú | 22 / 21 | 3 (13,6) |
| República Dominicana | 1 / 1 | 1 (100) |
| Uruguay | 3 / 3 | 1 (33) |
| TOTAL | 371 / 250 | 107 (28,8) |
Hospital supplies and services. A total of 104 hospitals (97.2%) have a central oxygen delivery system and 99 (92.5%) a central vacuum system; 24-hourlaboratoryandpharmacyservicesare available in 105 hospitals (98.1%) and 65 hospitals (60.7%), respectively. Around-the-clock diagnostic imaging availability is as follows: simple radiology in104(97.2%),computedtomographyin88 (82.2%), and magnetic resonance imaging in 19 hospitals (17.8%).
specific functions assigned by the hospital. The surveyed PEDs areresponsiblefortheregional interhospital transport system in 46 (43%) hospitals, for the operation of the rapid response team in 61 centers (57%), and for the hospital evacuation plan in 71 (66.4%) institutions.
Infrastructure and functionality. The available facilities are described inTable 2and the functionality related to the care process inTable 3.
Table 2. Facilities - description (n: 107)
| Areas | n (%) |
| Entrance and reception area | |
| Independent entrance for ambulances | 85 (79,4) |
| Security personnel at the entrance | 96 (89,7) |
| Differentiated WR according to patient severity | 25 (23,4) |
| Different WR for children and adults (n: 67) * | 39 (58,2) |
| Patient care areas | |
| Observation Room | 102 (95,3) |
| Pediatric OR separated from adult OR (n: 67) * | 55 (82) |
| Pediatric RA separated from adult SR (n: 67) * | 43 (64,2). |
| Isolation room with a private bathroom | 42 (39,3) |
| Private area for interviews | 37 (34,6) |
| Room for inhalation therapy | 62 (57,9) |
| Room for oral rehydration | 45 (42,1) |
| Room for procedural sedation | 36 (33,6) |
| Room for minor procedures | 78 (72,9) |
| X-ray room or equipment (own or adjacent) | 71 (66,4) |
| Classroom available in the PED or in the hospital (n: 106) | 101 (95,3) |
WR: Waiting room OR: Observation Room RA: Resuscitation Area
*When evaluating the visual and acoustic separation of children and adults in the WR and in the RA, only the 67 general and maternal-child hospitals were considered.
Table 3. Care process and functionality of the infrastructure
| Care process (n: number of hospitals that answered the data) | ||
|---|---|---|
| 1. Triage | n (%) | |
| They have Triage (n:107) | 74 (69,2) | |
| Triage 24/365 (n:74) | 60 (81,1) | |
| Computerized triage (n:74) | 47 (63,5) | |
| 2. Functionality of the physical plant | Median (RI) | |
| Daily consultations per office (n: 106) | 24,4 (14,7- 49,1) | |
| Percentage of patients treated in the SR (n: 87) | 2,0 % (0,9% - 5,8%). | |
| Number of beds in the SO (n:107) | 6 (4-14) | |
| Annual consultations per bed in the SO (n:100) | 4830,6 (2200 - 9125,5) | |
| Percentage increase in beds at seasonal peak (n:107) | 74,1% (28,6% - 150%). | |
| 3. Time of care | ||
| Time of outpatient care (n:29) | 2 (1-4) horas | |
| Time of stay in OS (n: 49) | 10 horas (6 - 24) | |
| Length of stay in SR (n: 37) | 2 horas (1 - 3) | |
| 4. Hospitalization | ||
| Percentage of hospitalized patients (n: 94) | 6,1%; (3,8% - 16,2%). | |
WR: Waiting Room OR: Observation Room RA: Resuscitation Area
Triage: Patients who withdraw without having been seen are reliably registered in 28 SEP (26.2%) and incompletely or partially in 43 centers (40.2%); they are not registered in 36 hospitals (33.6%).
Observation sector: In 58 SEP (54.2%), there is a regulation of maximum time of stay of patients in the OS, whose median is 12 hours (IR 6-24 hours).
Equipment:Figure 2describes the resources and their availability in the Resuscitation Area.
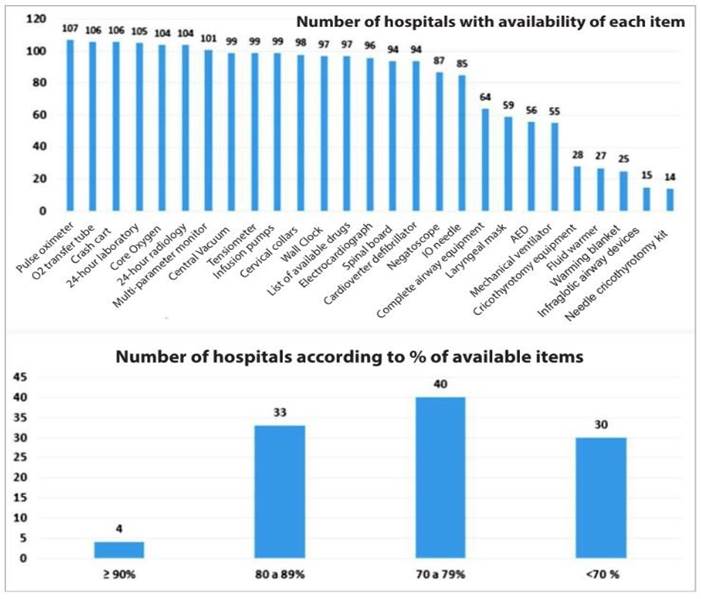
The airway equipment considered essential by the International Federation for Emergency Medicine8was surveyed as a whole. In 43 PEDs (40.2%), airway equipment was reported to be incomplete. Thirty-seven departments (34.6%) have an ultrasound scanner and 21 (19.6%) an End- tidal CO2 monitor.
Table 4. Registries and resources online(n: 107)
| Item | n (%) |
|---|---|
| Electronic general records | 83 (77,6) |
| Electronic medical records | 51 (47,7) |
| 24-hour available medical records* | 71 (66,4) |
| Diagnostic coding system in the PED | 82 (76,6) |
| Discharge form | 91 (85) |
| Digital images | 63 (58,9) |
| Model templates for frequent diseases | 23 (21,5%) |
| Hospital protocols and guidelines | 47 (43,9) |
| Drug alert system | 16 (15) |
| Tracking of patients in the PED | 30 (28) |
*Including paper records Coding is performed by doctors in 47 departments (56.8%), by administrative personnel in 34 (42%), and by nurses in 1 hospital (1.2%).
Human Resources
Different human resources and their functions are shown inTable 5.
Tabla 5 Human Resources
| They have their own / exclusive SEP staff * (n: 106) | n (%) |
|---|---|
| Medical staff | 65 (61,3) |
| Medical Coordinator | 61 (57,5) |
| Nursing Coordinator | 71 (67) |
| Secretary | 52 (49,1) |
| Social worker | 22 (20,8) |
| Respiratory therapist | 15 (14,2) |
| Pharmacist | 11 (10,4) |
| Training and access to specialties (n hospitals that responded to the data) | |
| They have 4 primary full-time specialties (n: 106) | 40 (37,4) |
| Functionality (n hospitals that answered the data) | |
| n hospitals that answered the data | 63 (59,4). |
| The number of doctors is adapted to the demand (n: 107) | 64 (59,8) |
| The number of nurses is adapted to the demand (n: 107) | 70 (65,4) |
| Median (RI) | |
| Daily visits per doctor(n:103) | 38,4 (20,6 - 53,2) |
| Daily visits per nurse (n: 102) | 35,3 (13,6 - 59,6) |
* Personnel who do not work in other areas of the hospital * * Specialties considered essential were surgery, traumatology, anesthesiology, and pediatric intensive care *** Availability of obstetricians was inquired in 11 maternal-child hospitals
Median number of daily visits per physician is greater than 65 in 16 PEDs (15.6% of 103 that reported the data); median number of daily visits per nurse is greater than 65 in 22 centers (21.6% of 102 responses).
Previous training
Overall, pediatricians account for 76% of the PED staff (1903 pediatricians out of 2502 physicians); 49.6% are certied in Pediatric Emergency Medicine or have more than 5 years of experience in the specialty.Family physicians, general practitioners, or clinicians represent 11% and adult emergency physicians 7.8% of the staff.
Support services
Biochemical technicians or specialists are 24/7 available in 84 centers (79.2%), hemotherapy technicians in 82 (78.1%), and pharmacists in 29 (27.4%).
Teaching and research activity and emergency care protocols
Daily rounds take place in 96 (90.6%) and grand rounds in 41 departments (38.7%). There is a continuous training program for doctors in 36 (34.0%) and for nurses in 44 PEDs (41.5%). Of 74 hospitals where triage is performed, 58 (78.4%) provide training in triage. In 10 centers (9.4%) doctors have specic time for teaching and research and so have nurses in 13 hospitals (12.3%).Physicians from 48 departments(45.3%)have presented scientic studies at congresses over the last ve years, and in the same period, physicians from 26 (24.5%) have published research papers.
On-site training programs. Eleven hospitals (10.4%) have a Pediatric Emergency Medicine training program (residency, fellowship, or other),while 92 PEDs(86.8%)receiverotationsof resident doctors. Sixty-eight departments (64.1%) have protocols or clinical guidelines fo rCPR,shockand sepsis,respiratory failure,status epilepticus,and trauma. Forty PEDs (37.7%) have a disaster protocol that includes pediatric needs.
Table 6. Univariate analysis
| Per population assisted | Per funding | Per number of annual visits * | Per affiliation with a university | ||||||||||
| General | Pediatric/Maternal-Child | p value | Exclusively Public | Public and private | p value | ≤ 50.000 (NCA1) | 50.001 to 100.000 (NCA2) | > 100.000 (NCA3) | p value | Affiliated | Not affiliated | p value | |
| Distribution of hospitals - per listed category | 56 (52,3) | 51 (47,7) | 0.629 | 90 (84,1) | 17 (15,9) | <0,001 | 68 (65,4) | 26 (25,0) | 10 (9,6) | <0,001 | 75 (70,1) | 32 (29,9) | <0,001 |
| Functionality of infrastructure | |||||||||||||
| Daily visits per medical office | 20,6 (27,0) | 33,7 (43,7) | 0.02 | 26,2 (34,6) | 21,3 (38,1) | 0.689 | 19,6 (24,2) | 46,5 (55,7) | 52,5 (62,1) | <0,001 | 22,1 (34,6) | 30,3 (36,5) | 0.732 |
| Annual visits per observation bed | 5207,5 (6537,1) | 4998,8 (7788,9) | 0.868 | 4830,5 (7135,6) | 6461,5 (7328,9) | 0.362 | 3666,7 (6077,5) | 6464,1 (8358,1) | 7212,7 (11955,6) | <0,001 | 4500,0 (6602,2) | 6464,1 (8321,7) | 0.291 |
| Complete airway equipment | 23 (41,1) | 20 (39,2) | 0.845 | 38 (42,2) | 5 (29,4) | 0.323 | 29 (42,6) | 9 (34,6) | 2 (20,0) | 0.349 | 30 (40,0) | 13 (40,6) | 0.952 |
| Care process | |||||||||||||
| Triage | 33 (58,9) | 40 (78,4%) | 0.03 | 62 (68,9) | 11 (64,7) | 0.734 | 44 (64,7) | 17 (65,4) | 10 (100) | 0.076 | 56 (74,7) | 17 (53,1) | 0.028 |
| % increase in beds in seasonal peak | 100 % (161,8%) | 60% (107,7%) | 0.227 | 75,0 % (143,2%) | 66,7% (93,6%) | 0.458 | 75,0% (137,9%) | 66,7% (123,5%) | 70,4 %(122,0%) | >0,999 | 75,0% (143,6%) | 83,3 %(115,9%) | 0.929 |
| % of admitted patients | 4,3% (8,2%) | 8,7% (15,2%) | 0.008 | 6,4% (13,5%) | 4,3 %(5,01%) | 0.046 | 6,9% (15,1%) | 3,9% (6,0%) | 5,2% (7,1%) | 0.079 | 6,7% (12,1%) | 4,5% (11,7%) | 0.499 |
| % of patients assisted in the RA | 1,4% (3,7%) | 1,9 (3,7%) | 0.299 | 6,4 % (13,5%) | 4,3% (5,01%) | 0.046 | 1,9% (4,3%) | 1,6% (2,7%) | 0,9% (2,9%) | 0.498 | 1,7% (4,0%) | 1,4 % (3,0%) | 0.64 |
| Human resources | |||||||||||||
| Physician or nurse PECC in each sift | 35 (63,6) | 37 (72,5) | 0.326 | 61 (68,5) | 11 (64,7) | 0.756 | 45 (66,2) | 18 (72,0) | 7 (70,0) | 0.858 | 57 (76,0) | 15 (48,4) | 0.006 |
| Daily visits per physician | 32,2 (32,2) | 46,2 (48,5) | 0.003 | 40,2 (41) | 32,2 (36,8) | 0.567 | 30,1 (29,9) | 58,5 (60,9) | 66,6 (66,3) | <0,001 | 41,6 ( 43,7) | 33,3 (32,5) | 0.063 |
| Daily visits per nurse | 32,4 (38,3) | 43,4 (44,1) | 0.225 | 37,5 (42,5) | 34,4 (34,5) | 0.532 | 20,6 (29,9) | 62,5 (65,0) | 61,1 (64,4) | <0,001 | 39,3 (44,8) | 33,4 (32,8) | 0.107 |
| Records | |||||||||||||
| Electronic general records | 42 (75,0) | 41 (80,4) | 0.504 | 70 (77,8) | 13 (76,5) | 0.906 | 48 (70,6) | 23 (88,5) | 9 (90,0) | 0.108 | 57 (76,0) | 26 (81,3) | 0.551 |
| Teaching activities | |||||||||||||
| Grand rounds | 16 (29,1) | 25 (49,0) | 0.035 | 32 (36,0) | 9 (52,9) | 0.188 | 24 (35,3) | 10 (40,0) | 7 (70,0) | 0.112 | 30 (40,0) | 11 (35,5) | 0.664 |
| Training program for doctors | 10 (18,2) | 26 (51) | <0,001 | 32 (36,0) | 4 (23,5) | 0.322 | 25 (36,8) | 6 (24,0) | 5 (50,0) | 0.299 | 29 (38,7) | 7 (22,6) | 0.1117 |
| Training program for nurses | 15 (27,3) | 29 (56,9) | 0.002 | 35 (39,3) | 9 (52,9) | 0.297 | 26 (38,2) | 11 (44,0) | 7 (70,0) | 0.164 | 32 (42,7) | 12 (38,7) | 0.707 |
| Quality of Care | |||||||||||||
| Competency evaluation for physicians | 10 (18,2) | 16 (32,0) | 0.101 | 23 (26,1) | 3 (17,7) | 0.458 | 18 (26,5) | 3 (12,5) | 5 (50,0) | 0.069 | 22 (29,7) | 4 (12,9) | 0.068 |
| Competency evaluation for nurses | 11 (20,0) | 17 (34,0) | 0.105 | 25 (28,4) | 3 (17,7) | 0.358 | 21 (30,9) | 4 (16,7) | 3 (30,0) | 0.399 | 23 (31,1) | 5 (16,1) | 0.114 |
| QI committee | 27 (49,1) | 30 (60,0) | 0.262 | 46 (52,3) | 11 (64,7) | 0.346 | 38 (55,9) | 11 (45,8) | 6 (60,0) | 0.642 | 44 (59,5) | 13 (41,9) | 0.1 |
| QI plan | 17 (30,9) | 26 (52,0) | 0.028 | 35 (39,8) | 8 (47,1) | 0.576 | 30 (44,1) | 6 (25,0) | 7 (70,0) | 0.045 | 34 (45,9) | 9 (29,0) | 0.108 |
Cuantitative variables are reported as "median (mean)"; categorical variables are reported as "n (%)". * PED´s that receive >100.000 annuals visits were compared to those which receive ≤ 100.000 annual visits PECC: Pediatric Emergency Care Coordinator. QI: Quality Improvement
DISCUSSION
Pediatric Emergency Medicine has progressively expanded in Argentina and Latin America since it was first recognized in Mexico in 2006 and has gained momentum in recent years with the creation of the Latin American Society of Pediatric Emergencies and Committees of Pediatric Emergencies both in Pediatric societies and in Emergentology societies of numerous Latin American countries18.
In many countries, recognition of the specialty has contributed to the development of this medical eld and has encouraged healthcare teams to join efforts to improve care results18-20. The aim of this study was to assess the current state of resources and operation of PEDs of public hospitals in Latin America and, thereby, to contribute to the identication of opportunities for improvement.
The following observations and comments are based on Argentine regulation21and recommendations from agencies from different countries that represent a references for te design of quality improvement programs2-10,22.
Infrastructure and equipment.
The equipment of the Resuscitation Area was found to be decient in many PEDs. The complete list of essential elements for airway management is available in only 59.8% of the departments. According to international standards, different aspects of the waiting rooms and sectorized areas for pediatric care are decient as well8.
The Spanish Society of Pediatric Urgencies(SEUP) recommends to have one office for every16-22daily visits.6In the surveyed hospitals, median daily visits per office exceeded the maximum recommended number, and the interquartile ranges show that there is a paucity of offices in many departments. Univariate analysis showed that this decit is more signicant in pediatric and maternal-child hospitals, and in PEDs that receive more than 100 000 visits per year (category NCA3). The number of visits per observation bed was also signicantly higher in NCA3 category departments.
Care process.
The use of triage was signicantly associated with the categories of pediatric and maternal-child hospital and university hospital.
Human Resources.
Unlike other specialties in which physicians work exclusively in their area of expertise,only 61.3%of hospitals hire professionals exclusively for the PED.Astrong international recommendation is for PEDs (especially those in general hospitals) to have a physician and nurse PECC per shift to ensure the quality of pediatric care8; currently, 32.1% of the PEDs lack these PECCs, and no difference was found between hospital categories.
According to international standards, the number of staff should be established based on the demand and the case-mix. It has been determined that a doctor or a nurse sees between 2.5 and 2.7 patients per hour (65 daily visits)6,23. Our data suggest a generalized work overload, especially in shift swith a higher demandand in departments that do not adapt the number of staff to the demand ows. This opportunity for improvement is greater in pediatric and maternal-child hospitals and NCA3 category hospitals.Determining the characteristics of the patient ow and the “ngerprint”of their demand would allow PEDs to calculate the human resources and its temporal distribution based on the number and severity of the patients24.
The seasonal over-demand is evidenced in the increase in beds available in most hospitals during the seasonal peak25; This data supports the importance of having triage systems with qualified personnel.
Overall, 76% of the staff members are pediatricians. It is encouraging to see that approximately half of these specialists are certified in Pediatric Emergentology or have 5 years of experience and training in the specialty.
Taking into account the complexity of the surveyed hospitals, it is striking that only 37.4% have a permanent surgeon, traumatologist, pediatric intensivist, and anesthesiologist. In 3 maternal and child hospitals, the obstetricians are present part-time or at call. The limited accessibility of specialists in Respiratory Endoscopy makes it necessary to consider the training of schools in the management of difficult airways and the provision of the required equipment.
The high percentage of hospitals that do not provide 24/7 support by biochemical technicians/specialists and hemotherapy technicians deserves attention. In addition, the pharmacy department has become an important aid for the healthcare area; however, only 27.4% of hospitals have a pharmacist around the clock.
Teaching and research activities.
Training programs for both doctors and nurses are scarce; when comparing by categories, a signicantly higher percentage of programs was found in pediatric and maternal-child hospitals versus general hospitals. Clinical grand rounds were also signicantly associated with the condition of children's hospital. Triage training is carried out in 78.4% of the PEDs; it is recommendable to train all the personnel who perform this task.
We observed that few PEDs presented or published research studies and very few centers allocate time to teaching or research.
A considerable percentage of PEDs have protocols for the care of critical patients. On the other hand, few hospitals have protocols for disasters that consider pediatric needs, similar to ndings reported by surveys carried out in other regions of the world11,26.
Noteworthy,many of the PEDs are in charge of interhospital transport and disaster response. Considering the organizational and professional training limitations of prehospital emergency services in Latin America, training in these medical elds and the development of clinical guidelines deserves special attention27,28.
Quality and safety management.
Surveys carried out in the US and Europe shows that one of the most constant gaps is the absence of quality and safety improvement plans11,26. In this study that analyzes the most complex hospitals in our region, we observed that a limited percentage of them (54.3%) have a QualityCommittee and Safety. Less than half of the SEPs have a continuous improvement plan of Quality. When analyzing by categories, it was observed that quality improvement plans are significantly associated with the condition of a children's hospital and the category of hospitals with the highest demand.
Long shifts in a setting of work overload are associated with an increased risk of medical error. In addition to adapting the number of staff and promoting continuous education, quality and safety programs or tools29should be in place and incorporated into the medical curriculum30.
Development of a continuous QI plan is recommended together with the designation of a member of the staff in charge of quality management, as well as the use of a Quality Indicator Dashboard as a management tool to measure, prioritize, plan, and sustain quality and safety interventions, and to report to the hospital authorities.
We emphasize the importance of defining specic competencies for PE physicians and nurses and assigning medical and nursing PECCs. These roles have been shown to be strongly associated with better preparedness of the PEDs11.
We found opportunities for improvement in issues of patient safety,including the recording of adverse events, the use of tapes for calculating weight, and the introduction of tools to prevent medication errors.
Support from the hospital management will be important to establish protocols for the maintenance of medical equipment, to dene criteria for accepting and rejecting referrals,and to ensure access to on-line medical information.
Limitations of the study
This study has some limitations. Not all contacted centers answered the survey, which may have reduced the validity of the results. In addition, this study was conducted in public hospitals only and excluded centers with private management contracted by the public health care system,which is a common health care modality in different countries,suchas Brazil, Chile, and Colombia. Therefore, these countries were under-represented in the study. Moreover, the results may have been strongly inuenced by the specic conditions of the PEDs in Argentina, which represent 58.9% of the sample, while in some countries of Central America only a single center met the inclusion criteria. Further research including larger and more representative samples from all countries will be necessary to identify changes that occurred in the PEDs during the COVID-19 pandemic.Despite these limitations, this study is a first approach to understanding the current status of PEDs in Latin America.
Acknowledgement
The authors thank the chief physicians of the Emergency services for their participation, and the following collaborating physicians on the site, who played an important role in disseminating and specifying the survey process.
Clavijo, Manuel; Maliarchuk, Otto; Mousten, Barbara; Santos, Caesar; Vilar, Julieta; Mary Tejerina; Moura, Bruno; Saa Fernanda, Hany Simon Junior; Brother-in-law, Pamela; Olivares Jorge; Estrada Monterrosa, José María; Rojas Balcázar, Carlos; Rubio Vélez, Nataly; de la O Cáceres, Francisco; Álvarez Gálvez Eugenia; Figueroa-Uribe, Flavio; Olivar, Victor; Mendoza León, Barros Angélica, Pineda Rommy, Amaya, Gerardo; Rodríguez, Leónidas; Pavlicich, Viviana; Luna-Muñoz Consuelo; Pezzo, Jaime; Corona, Lisandra; More, Mariana.
REFERENCES
1. WHO. Maternal, newborn, child and adolescent health: WHO; 2020 [Disponible en: https://www.who.int/teams/maternal-newborn-child-adolescent-health-and-ageing/quality-of-care [ Links ]
2. American Academy of Pediatrics, Committee on Pediatric Emergency M, American College of Emergency P, Pediatric C, Emergency Nurses Association Pediatric C. Joint policy statement--guidelines for care of children in the emergency department. Pediatrics. 2009; 124 (4):1233-43. Disponible en:https://publications.aap.org/pediatrics/article/124/4/1233/71861/Joint-Policy-Statement-Guidelines-for-Care-of [ Links ]
3. Remick K, Gausche-Hill M, Joseph MM, Brown K, Snow SK, Wright JL, et al. Pediatric Readiness in the Emergency Department. Pediatrics. 2018; 142(5). DOI: 10.1542/peds.2018-2459 [ Links ]
4. Health RCoPaC. Facing the Future: Standards for children in emergency care settings 2018. Acceso 1 de julio de 2021. Disponible en:https://www.rcpch.ac.uk/sites/default/files/2018-06/FTFEC%20Digital%20updated%20final.pdf [ Links ]
5. Sociedad Española de Urgencias Pediátricas (SEUP). Normas y Esta´ndares de Acreditacio´n para Servicios de Urgencias Pedia´tricas y Centros de Instruccio´n en Medicina de Urgencias Pediátrica 2006. Acceso 1 de julio de 2021. Disponible en:https://seup.org/pdf_public/gt/mejora_acred_seup.pdf [ Links ]
6. Sociedad Española de Urgencias Pediátricas (SEUP). Normas y Esta´ndares de Acreditacio´n para Servicios de Urgencias Pedia´tricas y Centros de Instruccio´n en Medicina de Urgencias Pediátrica 2019. Acceso 1 de julio de 2021. Disponible en: https://seup.org/pdf_public/gt/NORMAS_ESTANDARES_CALIDAD_SUP.pdf. [ Links ]
7. Australasian College for Emergency Medicine (ACEM). Hospital Emergency Department Services for Children and young persons 2019. Policy P11. 1 Diciembre 2020. Acceso 1 de julio de 2021. Disponible en: https://acem.org.au/getmedia/2cf3c286-61a4-497d-9922-0a87af6ad4ed/S11 [ Links ]
8. International Federation for Emergency Medicine (IFEM) Pediatric Emergency Medicine Special Interest Group (PEMSIG). Standards of Care for Children in Emergency Departments; Version 3. 2019. Acceso 1 de julio de 2021. Disponible en: https://www.ifem.cc/wp-content/uploads/2019/06/Standards-of-Care-for-Children-in-Emergency-Departments-V3-2019.pdf. [ Links ]
9. Hung GR, Chalut D. A consensus-established set of important indicators of pediatric emergency department performance. Pediatr Emerg Care. 2008; 24(1):9-15. DOI: 10.1097/pec.0b013e31815f39a5 [ Links ]
10. Sociedad Española de Urgencias Pediátricas (SEUP). Indicadores de calidad. Revisión 2018. Acceso 1 de julio de 2021. Disponible en: https://seup.org/pdf_public/gt/mejora_indicadores.pdf [ Links ]
11. Gausche-Hill M, Ely M, Schmuhl P, Telford R, Remick KE, Edgerton EA, et al. A national assessment of pediatric readiness of emergency departments. JAMA Pediatr. 2015; 169 (6):527-34. DOI: 10.1001/jamapediatrics.2015.138 [ Links ]
12. Luaces Cubells C ORJ, Trenchs Sainz de la Maza V, Pou Fernández y col. Encuesta nacional sobre las urgencias pediátricas. Aspectos organizativos y funcionales. Emergencias. 2008; 20:322-7. Disponible en: https://seup.org/pdf_public/gt/mejora_encuesta.pdf [ Links ]
13. Sánchez J Luaces C, BENITO J. Cumplimiento de los requisitos de los servicios de urgencias de España: encuesta de autoevaluación. An Pediatr (Barc) 2011; 75(2):115-23. Disponible en: https://medes.com/publication/67687 [ Links ]
14. MIRÓ O, ESCALADA X, GENÉ E, BOQUÉ C, JIMÉNEZ FÀBREGA FX, NETTO C, et al. Estudio SUHCAT: mapa físico de los servicios de urgencias hospitalarios de Cataluña. Emergencias 2014; 26(1):19-34. Disponible en:https://medes.com/publication/91110 [ Links ]
15. Miró O; Escalada X; Gené E; Boqué C; Jiménez F; Netto C, et al. Estudio SUHCAT (2): mapa funcional de los servicios de urgencias hospitalarios de Cataluña. Emergencias (St. Vicenç dels Horts). 2014; 26(1):35-46. Disponible en: https://pesquisa.bvsalud.org/portal/resource/pt/ibc-118387 [ Links ]
16. Miró O; Escalada X; Gené E; Boqué C; Jiménez F; Netto C, et al. Estudio SUHCAT (3): mapa docente e investigador de los servicios de urgencias hospitalarios de Cataluña. Emergencias (St. Vicenç dels Horts) ; 2014;26(1): 47-56. Disponible en: https://pesquisa.bvsalud.org/portal/resource/pt/ibc-118388 [ Links ]
17. Morilla L. Cardozo N, Pavlicich V. Aplicación de un cuadro de mando asistencial en un departamento de Emergencias Pediátricas. Pediatr (Asunción) 2015; 42(2):108 - 114. DOI: 10.18004/ped.2015.agosto.108-114 [ Links ]
18. Kohn G, Buamscha D. Fagalde G, Iolster T, Jorro F. Moreno G, et al. Especialidad de Emergentologi´a Pedia´trica: ¡Bienvenida! Arch Argent Pediatr. 2018;116(4):298-300. DOI: 10.5546/aap.2018.298 [ Links ]
19. Pena ME, Snyder BL. Pediatric emergency medicine. The history of a growing discipline. Emerg Med Clin North Am. 1995;13(2):235-53. Disponible en:https://pubmed.ncbi.nlm.nih.gov/7737019/ [ Links ]
20. Babl FE, Weiner DL, Bhanji F, Davies F, Berry K, Barnett P. Advanced training in pediatric emergency medicine in the United States, Canada, United Kingdom, and Australia: an international comparison and resources guide. Ann Emerg Med. 2005; 45(3):269-75. DOI: 10.1016/j.annemergmed.2004.10.003 [ Links ]
21. Requisitos de Buenas Prácticas. Organización y Funcionamiento de Servicios de Urgencia y Emergencia. Resolución 2/2015 Grupo Mercado Común. Emitida el 29 de Mayo de 2015. Boletín Oficial de la República Argentina, 7 de Agosto de 2015. Id SAIJ: RMR2015000002. [ Links ]
22. Australasian College for Emergency Medicine. Emergency Department Design Guidelines. [Acceso 1 de julio de 2021.]. Disponible en: https://acem.org.au/getmedia/faf63c3b-c896-4a7e-aa1f-226b49d62f94/G15_v03_ED_Design_Guidelines_Dec-14.aspx [ Links ]
23. Augustine J. Emergency Department Benchmarking Alliance Releases 2014 Data on Staffing, Physician Productivity. Acceso 1 de julio de 2021. [ Links ]
24. Hocker MB, Gerardo CJ, Theiling BJ, Villani J, Donohoe R, Sandesara H, et al. NHAMCS Validation of Emergency Severity Index as an Indicator of Emergency Department Resource Utilization. West J Emerg Med. 2018;19(5):855-62. DOI: 10.5811/westjem.2018.7.37556 [ Links ]
25. Boyle A, Atkinson P, Basaure C, Chan E, Clouston R, Gilligan P, et al. Validation of the short form of the International Crowding Measure in Emergency Departments: an international study. Eur J Emerg Med. 2019;26(6):405-411. DOI: 10.1097/MEJ.0000000000000579 [ Links ]
26. Mintegi, S; Maconochie, I.; Waisman, Y; Titomanlio, L; Benito, J; Laribi, S; et al. Pediatric Preparedness of European Emergency Departments. A Multicenter International Survey. Pediatr Emerg Care 2020: 2021 Dec 1;37(12):e1150-e1153. DOI: 10.1097/PEC.0000000000001934 [ Links ]
27. Patel MM, Hebbar KB, Dugan MC, Petrillo T. A Survey Assessing Pediatric Transport Team Composition and Training. Pediatr Emerg Care. 2020;36(5):e263-e267. DOI: 10.1097/PEC.0000000000001655 [ Links ]
28. Yock-Corrales A, Casson N, Sosa-Soto G, Orellana RA. Pediatric Critical Care Transport: Survey of Current State in Latin America. Latin American Society of Pediatric Intensive Care Transport Committee. Pediatr Emerg Care 2020; 38(1): e295-e299. DOI: 10.1097/PEC.0000000000002273. [ Links ]
29. Borland ML, Shepherd M. Quality in paediatric emergency medicine: Measurement and reporting. J Paediatr Child Health. 2016; 52(2):131-613. DOI: 10.1111/jpc.13077 [ Links ]
30. Carney KP, Topoz I, Vu TT, Mistry RD, DiStefano M. Development of a Quality Improvement Curriculum in a Pediatric Emergency Medicine Fellowship. Pediatr Emerg Care. 2019; 35(5):373-376. DOI: 10.1097/PEC.0000000000001824 [ Links ]
Received: November 13, 2021; Accepted: December 15, 2021
 Este es un artículo publicado en acceso abierto bajo una licencia Creative Commons
