


Servicios Personalizados
Revista

Articulo
 texto en
  Inglés (pdf)
 Articulo en XML
 Referencias del artículo
 Enviar articulo por email
Indicadores
-
 Citado por SciELO
Links relacionados
-
 Similares en
SciELO
Similares en
SciELO
Compartir

 Permalink
Revista de la Facultad de Medicina Humana
versión impresa ISSN 1814-5469versión On-line ISSN 2308-0531
Rev. Fac. Med. Hum. vol.22 no.2 Lima abr./jun 2022 Epub 16-Mar-2022
http://dx.doi.org/10.25176/rfmh.v22i2.4768
Original article
Content validity by expert judgment of an instrument to measure knowledge, attitudes and practices regarding salt consumption in the population of Peru
1Instituto de Investigaciones en Ciencias Biomédicas, Universidad Ricardo Palma, Perú.
2Universidad Tecnológica del Perú, Lima, Perú.
3Facultad de Medicina Humana, Universidad Ricardo Palma. Lima, Perú.
Introduction:
Given the high consumption of salt in the population, there is a need to have a validated tool that measures the knowledge, attitudes, and practices of salt consumption (CAP-salt).
Methods:
Psychometric study of content validity through expert judgment. A total of five physicians from different specialties were counted. To calculate the degree of agreement between the expert judges, Aiken's V was used as the decision criterion to keep an item; a value ≥ 0.7 was considered.
Results:
To clarify, V values greater than 0.80 were presented, in addition to a variation coefficient of less than 25%; therefore, none of the items was eliminated. Regarding coherence, they presented a coefficient of variation above 20% and V values greater than 0.71, con rming the decision not to exclude any of them. Regarding the relevance of the items, V values higher than 0.90 were also evidenced, and neither did any of them present a value below the critical one.
Conclusions:
The questionnaire has presented sufficient evidence of content validity in terms of clarity, coherence, and relevance of the items through the analyses mentioned above. For this reason, it should be used to quantify the CAP-salt of different population groups in the country.
Keywords: Validation study; specialization; sodium chloride; Surveys and questionnaires; Peru. (Source : MeSH - NLM).
INTRODUCTION
Excessive sodium intake is a major public health problem. High salt intake causes more than 1.65 million deaths from cardiovascular events worldwide1. This is because it is associated with high blood pressure (HTN), strokes, heart disease, and some types of cancer2,3.
Although the world health organization recommends not consuming more than 2 grams of salt per day4, a study carried out in 18 countries found that only 0.2% of the population had a sodium intake of less than 2.3 grams/day5. In Latin America and the Caribbean, a systematic review concluded that the average combined sodium consumption estimated in 24 hours was 4.13 grams/day6. In Peru, using 24-hour urine samples from a population-based study in a semi-urban area, an average sodium content of 4.4 grams/day was reported7.
Faced with this problem, government programs have been formed that seek to build effective strategies to reduce salt consumption in the diet. For this, the collection of epidemiological data and the evaluation of knowledge, attitude and practice regarding salt consumption (CAP-salt) in the target populations8,9.
Despite these recommendations, in the Latin American region, there is not only a lack of studies on CAP-salt, but also a validated questionnaire that measures it10. For this reason, the validation of the instrument guarantees a useful tool to be used in research that requires this type of evaluation. Thus, the objective of this study is to validate the CAP-salt questionnaire in the Peruvian population.
METHODS
Design Psychometric study
Of content validity through expert judgment. The information collection process was carried out in the period from October to December 2021.
Population and sample
The population was made up of five medical professionals with a specialty in internal medicine and nutrition. For the selection of expert judges, aspects of academic training, research, and previous experience as10,11judges in validation studies , as detailed inTable 1.
Instrument
The CAP-salt questionnaire was developed by Grimes Instrument et al.12. This questionnaire was originally developed in Australia, in the English language. It has three blocks: 1) knowledge of salt made up of seven questions, 2) attitudes towards salt consumption made up of four questions; and 3) practices on salt with five questions. The instrument has dichotomous, polytomous, and selection response options. multiple with a single answer13.
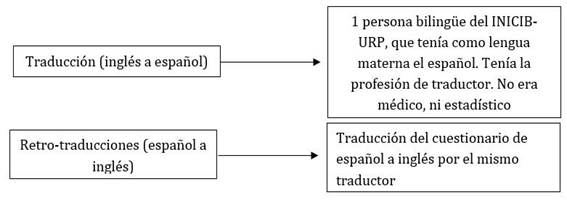
The questionnaire was submitted to the translation process by a translator from the team of the Institute of Biomedical Sciences of the Ricardo Palma University (INICIB-URP), into Spanish and subsequently retranslated to analyze whether the items maintained the purpose for which they were elaborated12.Figure 1
One of the most applied strategies to calculate evidence of content validity of an instrument is to submit it to expert judgment15-18. The task of the judges is to evaluate the content of the items; for the evaluation of the instrument, the evaluation of each item was carried out through the Expert through three indicators to be evaluated: clarity, coherence, and relevance, whose rating is given through six response options to eliminate the intermediate position and obtain more reliable responses20-22. Clarity refers to the syntax and semantics of each item. Coherence evaluates if the item has a logical relationship with the indicator or dimension that it is measuring. Relevance estimates whether the item is essential to measure the indicator. Sufficiency assesses whether the set of defined items is sufficient to measure a dimension.
In addition, each expert judge completed the validation certificate. They fully evaluated the assessments related to the unity of the items, the breadth of the content, and the relevance of the original instrument.
Procedure
The data obtained was stored in Microsoft Excel. The content validity coefficient using Aiken's V was calculated through the application developed by Merino and Livia23, the same one that provides confidence intervals using the scoring method. The calculation of the exact critical value of Aiken's V was obtained with the formula proposed by Aiken24.
Statistical analysis
To calculate the degree of agreement among the expert judges, Aiken's V was used. This coefficient presents values ranging from 0.00 to 1.00, where the value of 1.00 would indicate the maximum agreement among the judges in the contents. Evaluated. The calculation of the Aiken V coefficient takes into account the average of the grades, the minimum possible score, and the range of possible scores. For the purposes of controlling the sampling error, it is important to specify the range of possible values that the coefficient would assume using the intervals of trust25.
The analysis of the items was carried out based on the opinions of the expert judges and the results of Aiken's V according to the semantic adaptation guidelines found in the guidelines for the translation and adaptation of the tests14.
As a decision criterion to keep an item, a value of 0.7 was considered for the lower limit of the confidence interval and 1 for the upper limit26, a coefficient of variation less than 25%, or that at least two judges request the exclusion of the question.
RESULTS
General quantitative analysis
The global evaluation of the questionnaire showed that Aiken's V coefficient in the aspects of clarity, relevance, and sufficiency reached values higher than 0.80.
Specific quantitative analysis
Table 2reports the results on the clarity of the items quantified using Aiken's V coefficient. As can be seen, the items obtained favorable evaluations on clarity, presenting V values greater than 0.80, a critical value less than 0.7, in addition to a coefficient of variation less than 25%; therefore, none of the items He was removed.
Table 2. Mean, standard deviation, coefficient of variation, Aiken's V and confidence interval of the relevance of each question - Clarity
| Mean | SD | CV | Aiken's V | 95% CI | |
| Ítem 1 | 5,60 | 0,89 | 15,97 | 0,92 | 0,75-0,98 |
| Ítem 2 | 5,80 | 0,45 | 7,71 | 0,96 | 0,80-0,99 |
| Ítem 3 | 5,80 | 0,45 | 7,71 | 0,96 | 0,80-0,99 |
| Ítem 4 | 5,80 | 0,45 | 7,71 | 0,96 | 0,80-0,99 |
| Ítem 5 | 5,60 | 0,89 | 15,97 | 0,92 | 0,75-0,98 |
| Ítem 6 | 5,60 | 0,55 | 9,78 | 0,92 | 0,75-0,98 |
| Ítem 7 | 5,60 | 0,55 | 9,78 | 0,92 | 0,75-0,98 |
| Ítem 8 | 5,60 | 0,55 | 9,78 | 0,92 | 0,75-0,98 |
| Ítem 9 | 5,60 | 0,89 | 15,97 | 0,92 | 0,75-0,98 |
| Ítem 10 | 5,60 | 0,89 | 15,97 | 0,92 | 0,75-0,98 |
| Ítem 11 | 5,80 | 0,45 | 7,71 | 0,96 | 0,80-0,99 |
| Ítem 12 | 5,60 | 0,55 | 9,78 | 0,92 | 0,75-0,98 |
| Ítem 13 | 5,80 | 0,45 | 7,71 | 0,96 | 0,80-0,99 |
| Ítem 14 | 5,80 | 0,45 | 7,71 | 0,96 | 0,80-0,99 |
| Ítem 15 | 5,80 | 0,45 | 7,71 | 0,96 | 0,80-0,99 |
| Ítem 16 | 5,80 | 0,45 | 7,71 | 0,96 | 0,80-0,99 |
| Ítem 17 | 5,60 | 0,89 | 15,97 | 0,92 | 0,75-0,98 |
SD: standard deviation; 95% CI: 95% condidence interval
Considering the coherence parameter,Table 3, it should be noted that the items obtained Aiken's V coefficient values above the established lower critical value of 0.71, and also presented a coefficient of variation of above 20%, which would confirm the decision not to exclude any of them.
Tabla 3. Mean, standard deviation, coefficient of variation, Aiken's V and confidence interval for the relevance of each question - Coherence
| Mean | SD | CV | Aiken's V | 95% CI | |
| Ítem 1 | 5,80 | 0,45 | 7,71 | 0,96 | 0,80-0,99 |
| Ítem 2 | 5,60 | 0,55 | 9,78 | 0,92 | 0,75-0,98 |
| Ítem 3 | 5,80 | 0,45 | 7,71 | 0,96 | 0,80-0,99 |
| Ítem 4 | 5,60 | 0,55 | 9,78 | 0,92 | 0,75-0,98 |
| Ítem 5 | 5,60 | 0,55 | 9,78 | 0,92 | 0,75-0,98 |
| Ítem 6 | 5,80 | 0,45 | 7,71 | 0,96 | 0,80-0,99 |
| Ítem 7 | 5,80 | 0,45 | 7,71 | 0,96 | 0,80-0,99 |
| Ítem 8 | 5,60 | 0,55 | 9,78 | 0,92 | 0,75-0,98 |
| Ítem 9 | 5,80 | 0,45 | 7,71 | 0,96 | 0,80-0,99 |
| Ítem 10 | 5,60 | 0,55 | 9,78 | 0,92 | 0,75-0,98 |
| Ítem 11 | 5,80 | 0,45 | 7,71 | 0,96 | 0,80-0,99 |
| Ítem 12 | 5,80 | 0,45 | 7,71 | 0,96 | 0,80-0,99 |
| Ítem 13 | 5,60 | 0,55 | 9,78 | 0,92 | 0,75-0,98 |
| Ítem 14 | 5,80 | 0,45 | 7,71 | 0,96 | 0,80-0,99 |
| Ítem 15 | 5,80 | 0,45 | 7,71 | 0,96 | 0,80-0,99 |
| Ítem 16 | 5,80 | 0,45 | 7,71 | 0,96 | 0,80-0,99 |
| Ítem 17 | 5,60 | 0,55 | 9,78 | 0,92 | 0,75-0,98 |
SD: standard deviation; 95% CI: 95% condidence Interval
Table 4reports the results on the relevance of the items calculated using the Aiken V coefficient, the results shown show favorable indices in the calculation, which added to optimal values in the coefficient of variation support the decision to include them in the final instrument.
Table 4. Mean, standard deviation, coefficient of variation, Aiken's V and confidence interval for the relevance of each question - Relevance
| Mean | SD | CV | Aiken's V | 95% CI | |
| Ítem 1 | 5,80 | 0,45 | 7,71 | 0,96 | 0,80-0,99 |
| Ítem 2 | 5,60 | 0,55 | 9,78 | 0,92 | 0,75-0,98 |
| Ítem 3 | 5,80 | 0,45 | 7,71 | 0,96 | 0,80-0,99 |
| Ítem 4 | 5,60 | 0,55 | 9,78 | 0,92 | 0,75-0,98 |
| Ítem 5 | 5,60 | 0,55 | 9,78 | 0,92 | 0,75-0,98 |
| Ítem 6 | 5,80 | 0,45 | 7,71 | 0,96 | 0,80-0,99 |
| Ítem 7 | 5,60 | 0,55 | 9,78 | 0,92 | 0,75-0,98 |
| Ítem 8 | 5,60 | 0,55 | 9,78 | 0,92 | 0,75-0,98 |
| Ítem 9 | 5,80 | 0,45 | 7,71 | 0,96 | 0,80-0,99 |
| Ítem 10 | 5,60 | 0,55 | 9,78 | 0,92 | 0,75-0,98 |
| Ítem 11 | 5,80 | 0,45 | 7,71 | 0,96 | 0,80-0,99 |
| Ítem 12 | 5,60 | 0,55 | 9,78 | 0,92 | 0,75-0,98 |
| Ítem 13 | 5,60 | 0,55 | 9,78 | 0,92 | 0,75-0,98 |
| Ítem 14 | 5,80 | 0,45 | 7,71 | 0,96 | 0,80-0,99 |
| Ítem 15 | 5,80 | 0,45 | 7,71 | 0,96 | 0,80-0,99 |
| Ítem 16 | 5,60 | 0,55 | 9,78 | 0,92 | 0,75-0,98 |
| Ítem 17 | 5,80 | 0,45 | 7,71 | 0,96 | 0,80-0,99 |
SD: standard deviation; 95% CI: 95% confidence interval
DISCUSSION
Main findings
In general, it has been suggested that the use of unreliable and unvalidated questionnaires to measure knowledge about nutrition is responsible for the inconsistencies observed in the relationships between knowledge and eating behaviors27.
The findings demonstrated the validation process of the CAP-salt instrument presents evidence of content validity through expert judgment with positive Aiken V values in the categories analyzed, these being clarity, coherence, and relevance17,23,24.
Comparison with other studies
This questionnaire is the first to analyze consumer attitudes, knowledge, and behavior related to salt consumption in developing countries.
Similar studies have been carried out in developed countries such as Australia12,28, Ethiopía29, Canadá30y Kazakhstan31. These political and interested parties responsible reinforce the importance of knowing the phenomenon to be ableto implement strategieson responsible consumption of it.
In the process of construction and/or adaptation of a measurement instrument, content validity represents the first level of evidence of validity on the content of a test and the construct that is intended to be measured. The content refers to the topic, writing, format, and presentation of the items or questions of the instrument13,18.
This questionnaire is not measured in a sum of values about whether the person has high or low knowledge, attitude or practice, so it does not work in a dichotomous or even polytomous manner (with three answers). In this way, the way in which it should be handled is through each question individually and to be able to make comparisons between other variables of interest, such as gender, and the presence of some comorbidity, among others.
Significance for public health
Excessive consumption of sodium in the diet is a major public health problem both nationally and internationally. Therefore, because for monitoring and providing reliable information toinvolved in the initiatives to reduce this, it is necessary to have a tool that allows me to measure the CAP-salt in the population.
Knowing the goals that experts set for salt intake can help consumers make better-informed decisions when buying processed foods and be more mindful and sensitive when cook ing or eating. A better understanding of the relationship between salt and sodium can also make understanding nutrition information on food labels easier. In itself, knowing the CAP-salt can help consumers make better-informed decisions when buying processed foods and be more aware and sensitive when cooking or eating.
Strength and limitations
The strengths of our study are the inclusion of experts from different specialties of human medicine, with the aim of obtaining different points of view. Second, this questionnaire has been validated so that Peruvians could take it from different parts of the country, which gives it heterogeneity for the use of this tool. Third, since the questionnaire includes only 16 questions, it requires little time and effort on the part of the people taking it.
Among the study's limitations were the choice and availability of the judges, specialists, and translators and the organization of the time allocated to the validation process. Second, since the study is only focused on the Peruvian population, the results may not be generalizable to other countries, particularly in countries with different behaviors and dietary patterns and, therefore, different sources of food consumption. sodium. The INICIB-URP work team has future work underway to explore the factorial validity of the questionnaire in various populations.
CONCLUSION
The questionnaire of knowledge, attitudes and practices on the consumption of salt translated to our environment through the inverse translation justifies the quality of the adjustment of the items, the validity indicators based on the content represented through the Aiken's V coefficient (> 0.70), show that the instrument presents evidence of content validity in terms of clarity, coherence and relevance of the items.
REFERENCES
1. Adolescent pregnancy ENT#091;InternetENT#093;. ENT#091;citado 31 de agosto de 2021ENT#093;. Disponible en: https://www.who.int/news-room/fact-sheets/detail/adolescent-pregnancy [ Links ]
2. Strazzullo P, D'Elia L, Kandala N-B, Cappuccio FP. Salt intake, stroke, and cardiovascular disease: meta-analysis of prospective studies. BMJ. 2009;339:b4567. DOI: http://dx.doi.org/10.1136/bmj.b4567 [ Links ]
3. Graudal NA, Hubeck-Graudal T, Jurgens G. Effects of low sodium diet versus high sodium diet on blood pressure, renin, aldosterone, catecholamines, cholesterol, and triglyceride. Cochrane Database Syst Rev.2020; 12(8):CD004022.DOI: http://dx.doi.org/10.1002/14651858.CD004022.pub5 [ Links ]
4. Organización Mundial de la Salud. Reducir el consumo de sal ENT#091;InternetENT#093;. OMS fact sheets ENT#091;citado el 3 de agosto de 2021ENT#093;. Disponible en: https://www.who.int/es/news-room/fact-sheets/detail/salt-reduction [ Links ]
5. Mente A, O'Donnell MJ, Rangarajan S, McQueen MJ, Poirier P, Wielgosz A, et al. Association of urinary sodium and potassium excretion with blood pressure. N Engl J Med. 2014;371(7):601-11. DOI: http://dx.doi.org/10.1056/NEJMoa1311989 [ Links ]
6. Carrillo-Larco RM, Bernabe-Ortiz A. Sodium and Salt Consumption in Latin America and the Caribbean: A Systematic-Review and Meta-Analysis of Population-Based Studies and Surveys. Nutrients. 2020;12(2):E556. DOI: http://dx.doi.org/10.3390/nu12020556 [ Links ]
7. Carrillo-Larco RM, Saavedra-Garcia L, Miranda JJ, Sacksteder KA, Diez- Canseco F, Gilman RH, et al. Sodium and Potassium Consumption in a Semi-Urban Area in Peru: Evaluation of a Population-Based 24-Hour U r i n e C o l l e ct i o n.Nutrients.2018;10(2):245.DOI : http://dx.doi.org/10.3390/nu10020245 [ Links ]
8. World Health Organization. Strategies to monitor and evaluate population sodium consumption and sources of sodium in the diet: report of a joint technical meeting convened by WHO and the Government of Canada ENT#091;InternetENT#093;. World Health Organization. ENT#091;cited January 19, 2022ENT#093; . Disponible en: https://apps.who.int/iris/handle/10665/44614 [ Links ]
9. Salicrup LA, Ordunez P, Engelgau MM. Hypertension control activities in Latin America and the Caribbean: opportunities for late-stage (T4) translation research. Rev Panam Salud Publica. 2018;42:e22. DOI: http://dx.doi.org/10.26633/RPSP.2018.22 [ Links ]
10. Rubio DM, Berg-Weger M, Tebb SS, Lee ES, Rauch S. Objectifying content validity: Conducting a content validity study in social work research.Soc Work Res.2003;27(2):94 - 104. OI : http://dx.doi.org/10.1093/swr/27.2.94 [ Links ]
11. Pedrosa I, Suárez-Álvarez J, García-Cueto E. Evidencias sobre la Validez de Contenido: Avances Teóricos y Métodos para su Estimación ENT#091;Content Validity Evidences: Theoretical Advances and Estimation MethodsENT#093;. Acción psicol. 2014;10(2):3. doi:10.5944/ap.10.2.11820 [ Links ]
12. Grimes CA, Riddell LJ, Nowson CA. Consumer knowledge and attitudes to salt intake and l abelled salt information. Appetite. 2009;53(2):189-94. DOI:http://dx.doi.org/10.5944/ap.10.2.11820 [ Links ]
13. Abad FJ, Díaz JO, Gil VP, García CG. Medición en ciencias sociales y de la salud ENT#091;InternetENT#093;. 2011 ENT#091;cited January 23, 2022ENT#093;. Available at: https://dialnet.unirioja.es/servlet/libro?codigo=552272 [ Links ]
14. Hambleton R, Muñiz J. Directrices para la traduccion y adaptacion de los tests . Papeles del psicólogo.1996 ; 66 . Disponible en:https://www.papelesdelpsicologo.es/resumen?pii=737 [ Links ]
15. Galicia Alarcón LA, Balderrama Trápaga JA, Edel Navarro R. Content validity by experts judgment: Proposal for a virtual tool.Apertura. 2017;9(2):42-53. DOI: http://dx.doi.org/10.32870/ap.v9n2.993 [ Links ]
16. Boateng GO, Neilands TB, Frongillo EA, Melgar-Quiñonez HR, Young SL. Best Practices for Developing and Validating Scales for Health, Social, and Behavioral Research: A Primer. Front Public Health ENT#091;InternetENT#093;. 2018 ENT#091; citado el 23 de enero de 2022 ENT#093; ; 6 . DOI : https://doi.org/10.3389/fpubh.2018.00149 [ Links ]
17. Mayaute LME. Cuantificación de la validez de contenido por criterio de jueces. Revista de Psicología. 1988 ; 6 ( 1 - 2 ) : 103 -11 . DOI: https://doi.org/10.18800/psico.198801-02.008 [ Links ]
18. American Educational Research Association, American Psychological Association, National Council on Measurement in Education. Estándares para Pruebas Educativas y Psicológicas. Lanham, MD: American Educational Research Association; 2018. Available at: https://www.aera.net/Standards14-Spanish [ Links ]
19. Escobar-Pérez J, Martínez A. Validez de contenido y juicio de expertos: Una aproximación a su utilización. Avances en Medición. 2 0 0 8 ; 6 ( 1 ) : 2 7 - 3 6 . Disponible en: https://www.humanas.unal.edu.co/lab_psicometria/application/files/9416/0463/3548/Vol_6._Articulo3_Juicio_de_expertos_27-36.pdf [ Links ]
20. Boluarte Carbajal A, Tamari K. Validez de contenido y confiabilidad inter-observadores de Escala Integral Calidad de Vida. PSICO. 2017;35(2):641-66. DOI: http://dx.doi.org/10.18800/psico.201702.009 [ Links ]
21. 21. George Reyes C, Trujillo L. Aplicación del Método Delphi Modificado para la Validación de un Cuestionario de Incorporación de las TIC en la Práctica Docente. Rev Iberoame Eval Educ. 2018;11(1):113-34. DOI: https://doi.org/10.15366/riee2018.11.1.007 [ Links ]
22. Maldonado E, Pacheco R, Zamarripa J. Validación mexicana del cuestionario de clima de aprendizaje adaptado a la educación física (Mexican validation of learning climate questionnaire for physical e d u c a t i o n ) . Retos.2017;32:115 - 8.DOI: https://doi.org/10.47197/retos.v0i32.55170 [ Links ]
23. Merino C, Livia J. Intervalos de confianza asimétricos para el índice la validez de contenido: un programa visual basic para la V de Aiken. Anales de Psicología / Annals of Psychology. 2009;25(1):169-71. Available at: https://revistas.um.es/analesps/article/view/71631 [ Links ]
24. Aiken LR. Three coefficients for analyzing the reliability and validity of ratings. Educ Psychol Meas. 1985;45(1):131-42. Available at: http://dx.doi.org/10.1177/0013164485451012 [ Links ]
25. Penfield RD, Giacobbi Jr Peter R. Applying a Score Confidence Interval to Aiken's Item Content-Relevance Index. Meas Phys Educ Exerc Sci. 2 0 0 4 ; 8 ( 4 ) : 2 1 3 - 25.D O I : http://dx.doi.org/10.1207/s15327841mpee0804_3 [ Links ]
26. Cicchetti DV. Guidelines, criteria, and rules of thumb for evaluating normed and standardized assessment instruments in psychology. Psychol Assess ENT#091;InternetENT#093;. 1994 ENT#091;cited January 23, 2022ENT#093;;6(4):284-90. Available at: http://dx.doi.org/10.1037/1040- 3590.6.4.284 [ Links ]
27. Hawkins M, Elsworth GR, Osborne RH. Questionnaire validation practice: a protocol for a systematic descriptive literature review of health literacy assessments. BMJ Open. 2019;9(10):e030753. DOI: http://dx.doi.org/10.1136/bmjopen-2019-030753 [ Links ]
28. Khokhar D, Nowson C, Margerison C, Bolam B, Grimes C. Comparison of salt-related knowledge, attitudes and behaviours between parents and caregivers of children under 18 years of age and other adults who do not care for children under 18 years of age in Victoria, Australia. BMJ N ut r P r e v H e a l t h . 2 0 1 9 ; 2 ( 2 ) : 5 1 - 6 2 . D O I : http://dx.doi.org/10.1136/bmjnph-2018-000018 [ Links ]
29. Saje SM, Endris BS, Nagasa B, Ashebir G, Gebreyesus SH. Dietary sodium and potassium intake: knowledge, attitude and behaviour towards dietary salt intake among adults in Addis Ababa, Ethiopia. Public Health N u t r . 2 0 2 1 ; 2 4 ( 1 1 ) : 3 4 5 1 - 9 . D OI : http://dx.doi.org/10.1017/S1368980020003663 [ Links ]
30. Bhana N, Utter J, Eyles H. Knowledge, Attitudes and Behaviours Related to Dietary Salt Intake in High-Income Countries: a Systematic Review. C u r r N u t r R e p . 2 0 1 8 ; 7 ( 4 ) : 1 8 3 - 9 7 . D O I : http://dx.doi.org/10.1007/s13668-018-0239-9 [ Links ]
31. Aubakirova M, Sultanov M, Izimov A, Sakko Y, Bex T, Mussagazin A, et al. Factors influencing salt-reducing behavior in young adults: a pilot cross-sectional study from Kazakhstan. Central Asian Journal of Global Health ENT#091;InternetENT#093;. 2020 ENT#091;cited January 23, 2022ENT#093;;9(1). DOI: http://dx.doi.org/10.5195/cajgh.2020.415 [ Links ]
32. Khokhar D, Nowson C, Margerison C, Bolam B, Grimes C. Comparison of salt-related knowledge, attitudes and behaviours between parents and caregivers of children under 18 years of age and other adults who do not care for children under 18 years of age in Victoria, Australia. BMJ Nutr Prev Health. 2019;2(2):51-62. doi:10.1136/bmjnph-2018-000018 [ Links ]
Received: December 06, 2021; Accepted: February 16, 2022
 Este es un artículo publicado en acceso abierto bajo una licencia Creative Commons
