


Services on Demand
Journal

Article
 text in
  English (pdf)
 Article in xml format
 Article references
 Send this article by e-mail
Indicators
-
 Cited by SciELO
Related links
-
 Similars in
SciELO
Similars in
SciELO
Share

 Permalink
Revista de la Facultad de Medicina Humana
Print version ISSN 1814-5469On-line version ISSN 2308-0531
Rev. Fac. Med. Hum. vol.22 no.4 Lima Oct./Dec. 2022 Epub Oct 12, 2022
http://dx.doi.org/10.25176/rfmh.v22i4.5092
Original article
Hypertriglyceridemic waist and arterial hypertension in adults: A systematic review and meta-analysis
1Instituto de Investigaciones en Ciencias Biomédicas de la Universidad Ricardo Palma, Lima, Perú.
2Universidad Tecnológica del Perú, Lima, Perú.
Objective:
Develop a systematic review and meta-analysis to determine the association between hypertriglyceridemic waist (CHTG) and arterial hypertension (HBP) in adults.
Methods:
The present study is a systematic review (SR) with a meta-analysis of analytical cross-sectional observational studies. Search strategies will be used in databases: Pubmed, SCOPUS, Web of Science, and Embase. The qualitative analysis was presented in a table with the characteristics of each study. For quantitative analysis, a random-effects meta-analysis was performed due to the heterogeneity of the studies. These variables were compared using Odds Ratios (OR) as a measure of association with their corresponding 95% confidence interval.
Results:
Five studies were included for statistical analysis. A statistically significant association was found between both variables (OR: 1.36; 95% CI 1.07 to 1.71). In turn, there was a high heterogeneity (I squared 92%).
Conclusions:
This SR found that CHTG is associated with the presence of hypertension. However, given the few studies found, it is recommended to carry out more primary studies with a prospective design before carrying out the next SR on the subject and with standardized cut-off points to make more homogeneous comparability.
Keywords: Hypertriglyceridemic waist; Arterial hypertension; Adults; Systematic Review. (Source: MeSH NLM).
INTRODUCTION
Arterial hypertension (HTN) is one of the adults' most common chronic diseases. It is responsible for approximately 8.5 million deaths from strokes, ischemic heart disease, and other vascular and kidney diseases worldwide1.
From 1990 to 2019, the number of people over 30 with high blood pressure doubled2. Globally, the prevalence of AHT fluctuates around 30%3. In Peru, the prevalence of AHT is estimated at 21.7%4.
As it is a silent disease that can be detected from the first level of care, searching for ways to reach the diagnosis using easily accessible instruments is an essential task of the health system, as well as detecting the factors associated with its appearance. Of the numerous publications that have been made about AHT and its risk factors, there are currently works on its association with various metabolic alterations5,6; however, insufficient emphasis has been placed on its relationship with visceral fat.
It is known that the hypertriglyceridemic waist (CHTG) has been proposed in recent years as a tool for recognizing individuals with insulin resistance, prediabetes, and diabetes7-10. Likewise, this has been determined as a useful tool at the cardiovascular level11,12since it evaluates both serum triglyceride levels and pathological abdominal waist, two measurements that can be easily taken from the first level of care, which is related to levels of pathological conditions can result in an indicator of chronic non-communicable diseases such as high blood pressure13-15.
Despite the presence of studies between AHT and CHTG, there has not been a complete analysis that evaluates whether this association exists and what its magnitude is.
For this reason, a systematic review and meta-analysis were carried out in the present investigation to determine the association between CHTG and hypertension in adults.
METHODS
Design and study area
This study is a systematic review (SR) with a meta-analysis of analytical cross-sectional observational studies.
The PRISMA 2020 statement (Preferred Reporting Items for Systematic reviews and Meta-Analyses) was used as a guide16. This SR was registered in PROSPERO (ID: CRD42022325900) (Available at: http://www.crd.york.ac.uk/prospero/)
Search strategy
Search strategies will be used in different databases, which will be Pubmed, SCOPUS, Web of Science, Embase. The key terms used were: Hypertension and Hypertriglyceridemic Waist. The search strategy for each database is available in Supplementary Annex 1.
Selection of studies
The selection criteria included CHTG and AHT, analytical observational studies (case-control studies, cohort studies, and cross-sectional analyses), and those carried out in the population over 18 years of age. Papers that were in a language other than English, Spanish, Portuguese or French that cannot be obtained in their full version, case reports, case series, ecological studies, letters to the editor, review articles, and secondary studies were excluded, and conference abstracts.
The Rayyan software was used to select the articles from the databases above. Two main researchers participated in the selection of studies, who independently reviewed the titles and abstracts of all the articles found to find those that met the selection criteria and eliminate duplicate articles. The software is available at: https://rayyan.qcri.org.
The researchers classified the studies and compared them with the observations given. If the two researchers agreed and had independently approved the study, it was selected. If both did not agree and had each independently excluded the study, it was not included. In case of conflict, if one of the two researchers wanted to include an article and the other did not, a third reviewer's intervention was requested to make the final decision.
After the initial selection, the evaluation of the full text of all the articles included by the researchers in the previous step continues. Additionally, the bibliographic references of those studies that cite them were searched to find studies that were not included in the initial search. Each reviewed article selected in the previous stages was included in a Sheet of the EXCEL 2022 program where it was finally placed if the study was included; if it was not included in the review, the reason for non-inclusion was written.
Data extraction and qualitative analysis
The Microsoft Excel 2022 program was used to collect the following data for each selected article: Author, year, country, study design, sample size, percentage of males, the mean or median age of the population, selection criteria, the prevalence of hypertriglyceridemic waist, the cut-off point used for abdominal waist, the prevalence of arterial hypertension, the measure of association, adjustment of variables.
Risk of bias
the risk of bias tool was used New Castle Ottawa for cohort studies17and the one modified in the review by Modesti et al. for cross-sectional studies18.
Quantitative analysis
For the qualitative analysis, a table was presented with the characteristics of each study. For quantitative analysis, a random-effects meta-analysis was performed due to the heterogeneity of the studies. The variables of interest were worked in a dichotomous way, being the independent variable of the study, the CHTG, and the dependent variable, the AHT, expressed in whether there is the presence or absence of the variable in question. The dichotomous data presented were compared using Odds Ratios (OR) as a measure of association with their corresponding 95% confidence interval.
In the event that the study showed some other measure of association (for example, prevalence ratios), an email was sent to the corresponding author of the respective manuscript, to request if they could share said measure as OR.
Finally, the variability between studies was evaluated with the I squared (I2)19, which was considered up to 40% as a cut-off point according to Cochrane, with <40% being a possibly insignificant heterogeneity and >40% heterogeneity representative moderate to high20.
RESULTS
Eligible studies
A total of 149 published studies were identified. After removing the duplicate studies (55) recognized by the program and the investigators, 94 publications were evaluated through title and abstract. Then, if 67 articles were excluded because they did not meet the required criteria for the study evaluated through the title and abstract, there were 27 remaining studies, which were analyzed in full text, and 5 were excluded because they did not belong to the category of required studies or be only descriptive studies. The inclusion and exclusion criteria were applied within the final group of 22 studies, leaving 6 studies included10,15,21-23. Additional supplementary material will describe the final reasons for the 22 studies in the latter group.
Characteristics of the studies
Within 6 included studies (n=25814) with a sample made up of 354 to 9015 participants, 5 cross-sectional studies and 1 cohort study (of 7 years duration) were found, with respect to gender only 2 studies had a higher percentage of men in their population, the percentages of men in the population ranged from 23.7% to 51.8%. Regarding the age of the population, the cut-off point to be defined for the studies was 40 years (3 articles), 20 years (1 article), >18 years (2 articles); the mean/median age of the population ranged from 40 to 65 years.
CTHG had a prevalence of 13.96% to 56.9%. Pathological waist circumference was defined by 3 studies with the cut-off point given by the NCEP-ATP III (34) ≥88cm for women and ≥102cm for men; 2 studies used the cut-off point according to IFD ≥ 80cm for women and ≥ 90 for men; only 1 study used two different parameters, both NCEP-ATP III and JIS ≥80cm for women and ≥94cm for men. Cut-off points for triglycerides ≥ 150 mg/dl. On the other hand, hypertension had a prevalence of 12.48% to 84.1%; the cut-off point was ≥ 140/90 mmHg.
Risk of bias assessment
Of the 6 studies, 5 were assessed using the modified NCO tool for cross-sectional studies and 1 was assessed using the NCO tool for cohort studies. Of all the studies, only 2 did not justify whether the sample size was satisfactory and 2 did not compare the characteristics of those surveyed and those not surveyed. Assessment of publication bias using the funnel plot was not performed due to the number of studies (<10)20. Finally, 5 studies had a final score of 7 or 8 evaluated as low risk, and only 1 study had a score of 5 evaluated as a moderate risk study (Table 1and2).

Table 1. Evaluation of the quality of the included studies using the Newcastle-Ottawa Scale (NOS) adapted for cross-sectional studies.
| Author, years | Selection | Comparability | Result | Score | Final Judgment | |||||
|---|---|---|---|---|---|---|---|---|---|---|
| Representativeness of the sample1 | Sample size2 | Determination of exposure3 | Non-respondents4 | Study controls for the most important factor5 | Study controls for any additional factors6 | Evaluation of the result7 | Appropriate statistical analysis8 | |||
| Yan Xuan MS et al, 2022 | ( | ( | ( | ( | (( | ( | ( | 8 | Low Irrigation | |
| Vera-Ponce VJ et al, 2022 | ( | ( | ( | ( | (( | ( | 7 | Low Irrigation | ||
| Tangvarasittichai S et al, 2015 | ( | ( | ( | (( | ( | ( | 7 | Low Irrigation | ||
| Fernández García JC et al, 2020 | ( | ( | ( | (( | ( | ( | 7 | Low Irrigation | ||
| Taloyan M et al, 2012 | ( | (( | 5 | Moderate Risk | ||||||
1Representativeness of the sample: A star to studies with random sampling or census.
2Sample size: one star was assigned to studies with a justified and satisfactory sample size.
3Determination of exposure: The way in which the dependent variable has been measured is clearly explained
4Non-respondents: If the comparability between the characteristics of the respondents and non-respondents was established and the response rate was satisfactory, a star was assigned.
5The study controls for the most important factor: An adjustment has been made, either methodological or statistical, for the most important confounding variable.
6The study controls for any additional factor: An adjustment has been made, either methodological or statistical, for other confounding variables
7Outcome assessment: If the study explicitly mentioned how self-medication was defined and how long the recovery period was, it was given one star.
8Adequate statistical analysis: One star was given if a complex sample was not used and the sample was calculated correctly, or if a complex sample was used and such a sample was considered to estimate the prevalence of self-medication.
Table 2. Evaluation of the quality of the included studies using the Newcastle-Ottawa Scale (NOS) adapted for cohort studies.
| Author, years | Selection | Comparability | Result | Score | Final Judgment | ||||||
|---|---|---|---|---|---|---|---|---|---|---|---|
| Representativeness of the exposed cohort1 | Selection of the unexposed cohort2 | Verification of exposure3 | Result of interest not present at the beginningng of the study4 | Control of the study by the most important factor (sex/age)5 | Study controls for any important additional factors6 | Outcome assessment7 | Sufficient duration of follow-up8 | Adequate cohort follow-up | |||
| Janghorbani M et al, 2017 | ( | ( | ( | ( | ( | ( | ( | ( | 8 | Low Irrigation | |
1Representativeness of exposed cohort: is truly representative or somewhat representative of the community.
2Selection of the unexposed cohort: Drawn from the same community as the exposed cohort.
3Comparison check: comes from secure registry as (surgical); or structured interview.
4Demonstration that the outcome of interest was not present at the start of the study: star if not present.
5Comparability of cohorts based on design or analysis: study controls existed for important factors; or for any additional study factors (controlling for important secondary factors).
6Evaluation of results: it is an independent blind evaluation or through a registration link.
7Was the follow-up long enough for the results to occur? Star if it was long enough.
8Adequacy of cohort follow-up: whether follow-up is complete; or if subjects lost to follow-up are unlikely to introduce bias; or if there is a description provided of the missed traces.
Table 3. Characteristics and results of the included studies on the association between CHTG and HT.
| Author | Year | Country | Study design | Sample size | Sex (% of men) | Mean/Median age of the sample | Selection criteria | Prevalence of CHTG | Criteria for cut-off of abdominal perimeter | Prevalence of AHT | MAssociation measure | Adjustment of variables |
|---|---|---|---|---|---|---|---|---|---|---|---|---|
| YanXuan MS, et al. | 2022 | China | Transversal | 9015 | Hombres 3933 (43.62%) | 60 | Inclusion: Participants aged 40 years and over; minimum 5 years of residence in Shanghai, treated at the health center of the luwan-Ruijim branch. Exclusion: Participants who did not give or are unable to give their consent; pregnant; participants with critical illness such as: cancer, organ transplant or dialysis treatments; participants with missing data on blood pressure, triglyceride level, waist circumference; participants outside the selection period; participants who did not finish with the corresponding controls. | 1909 (21.2%) | IDF | 7426 (82.3%) | OR 1.28; IC del 95 %: (1.04,1.58) Hombres 1.03 (1.01,1.04) Mujeres 1.37 (1.07,1.77) | Age, sex, BMI, smoking, alcohol consumption, physical activity, educational level, diabetes Mellitus. |
| Vera-Ponce VJ, et al. | 2022 | Perú | Transversal | 4090 | Hombres 2029 (49.6%) | 40 | Inclusion: ENINBSC participants aged 20 years and over Exclusion: Participants who changed their usual diet due to illness; that do not obtain the complete data of the variables of interest. | JIS (218.49%) ATPII (13.96%) | ATP III | 509 (12.48%) | OR 1,52; IC 95% 1,17 a 1,98 | Age, sex, BMI, smoking, alcohol consumption, physical activity, place of residence. |
| Janghorbani M , et al | 2017 | Irán | Cohorte | 1417 | Initial sample 3483 Hombres 919 (26.39%) | 42.6 | Inclusion: First-degree relatives of patients with type 2 Diabetes Mellitus (DM2). Exclusion: Participants with onset of DM2 or prevalent hypertension; who did not attend the follow-up exam; pregnant ; participants with missing data. | ATP III | Incidencia 281 (19.8%) | OR 2.29 IC 95% (1,55-3,38) | Age, sex, plasma glucose in fasting | |
| Tangvarasittichai S. , et al | 2015 | Tailandia | Transversal | 4206 | Hombres 997 (23.7%) | 53 | Inclusion: Participants aged 40 years and over; participants who are located within the 7 selected regions of Thailand. Exclusion: Participants with known end-stage renal failure, cancer, or any life-threatening disease; participants who present during the selection an infectious process. | Hombres 236 (23.7 %) Mujeres 1131 (35.2 %) | IDF | Hombres (56.12 %) Mujeres (40.7 %) | OR Hombres 1.74; IC del 95% (1.07,2.84) Mujeres 1.84; IC del 95% (1.54,2.21) | Age, sex, BMI, smoking, alcohol consumption, high triglyceride levels, low HDL levels and high cholesterol levels |
| Fernández García JC , et al | 2020 | España | Transversal | 6732 | Hombres 3488 (51.8%) | 65 | Inclusion: Men participants in the age range 55-75 years and women in the age range 60-75 years with overweight or obesity (BMI ≥ 27 kg and < 40 kg/m2), and who present at least 3 criteria of the syndrome metabolic. Exclusion: Participants with a history of CVD or cancer in the last 5 years (with the exception of non-melanoma skin cancer); with inability to follow the recommended diet or inability to perform physical activity; with low probability of changing eating habits; that they will not attend the scheduled visits for the intervention; who is bedridden or immobile, pregnant or hospitalized at the time of the study; participants who present a serious psychiatric disorder, addiction to alcohol consumption, drug addiction. | 2574 (38.2%) | ATP III | 2100 (81.6 %) con CHTG 3497 (84.1%) sin CHTG | OR 0.84; IC del 95% (0.73,0.96) | Age, BMI, smoking, sedentary lifestyle, educational level, physical activity, adherence to the Mediterranean diet, presence of comorbidities (diabetes mellitus or arterial hypertension) |
| Marina Taloyan , et al | 2012 | Suecia | Transversal | 354 | Hombres Asirios/sirios 173 (48.9) Suecos 181 (51.1%) | Asirios/Sirio: 61 Suecos: 64 | Inclusion: Participants with DM2 residing in Södertälje-Sweden who were selected from the 4 primary care centers. Exclusion: Participants who were not Assyrian/Syrian or Swedish; who did not complete their studies. | Asirios/Sirios (55.2%) Suecos (56.9%) | ATP III | Asirios/Sirios 100 (58%) Suecos 139 (77%) | OR 2.83; IC del 95% (1.20,6.71) | Age, sex, elevated total cholesterol levels, elevated triglyceride levels |
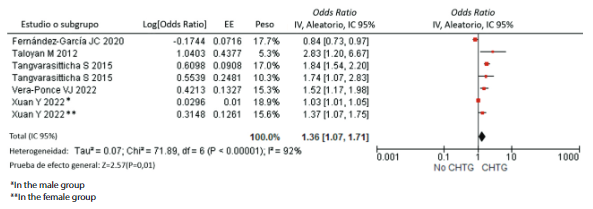
Meta-analysis for CHTG and HT
Regarding the analysis of CHTG and HT, the studies that independently presented a statistically significant association were the study by Taloyan et al.23(OR: 2.83; CI 95% 1.20 to 6 .67), Tangvarasittichai et al.22(female group; OR 1.84; 95% CI 1.54 to 2.20) and Vera-Ponce et al.15(OR 1.52; 95% CI 1, 17 to 1.98) (Figure 2). Finally, a statistically significant association was found globally between both variables of interest (OR: 1.36; 95% CI 1.07 to 1.71).
All the studies that were part of the meta-analysis of cross-sectional studies presented a high heterogeneity Chi 2 p<0.001, I2 (92%). In addition, no meta-analysis of the cohort subgroup was performed because only one study was part of it, Janghorbani et al.21(OR: 2.29; 95% CI (1.55 to 3.38) p<0.001, being independently statistically significant
DISCUSSION
This is the first SR combined with a meta-analysis that sought the association between TCHG and AHT in the adult population. A significant association was found between both variables of interest. However, it should be considered that there are still few studies on the subject, which is why we worked practically only with cross-sectional studies. Moreover, these works differed in several aspects, one of the main ones being the country of origin of the study. If we organize them into continents, we find the following classification: three studies of the Asian continent, two studies from the European continent, and only one from America.
Overall, a statistically significant association was found. This shows that despite the heterogeneity of the studies, the association with arterial hypertension was preserved. Independently, it has been seen in the study by Vera-Ponce VJ et al.15being the only included study that integrated two different measures of abdominal circumference, also achieving that its association with arterial hypertension in said population is maintained.
Within each study, the heterogeneity found may be due to different conditions; for example, Taloyan M et al23took people from Assyria/Syria and Sweden as the specific population; Fernández-García JC et al10took overweight or obese participants from specific age and BMI ranges; while Janghorbani M et al21only took first-degree relatives of patients with Diabetes Mellitus.
On the other hand, the cut-off points used as parameters in the abdominal waist should be mentioned. Although ATPIII BP values have been used as the classic and comparable cut-off between studies, several studies have considered using the most suitable for their own population, as recommended by the IDF or JIS criteria. For this reason, it is necessary to clarify a standard definition of AP, to increase homogeneityespecially when research work is carried out24.
The association between CHTG and hypertension can be seen from two angles: the presence of obesity and hypertriglyceridemia. First, choosing the abdominal waist as a marker of obesity, specifically of fatty adiposity, is important. Although BMI is often used to assess general obesity as a cardiovascular risk25, many studies have considered WC a more specific marker26-28. In this way, the excessive release of fatty acids that exceeds the storage and oxidation capacity in tissues such as muscle, liver and pancreatic beta cell; therefore, there is the activation of other alternative metabolic pathways, which are harmful to the cell and lead to the generation of reactive oxygen species (ROS) and the accumulation of toxic intracellular metabolites. Activation of this systemic proinflammatory process also activates the sympathetic nervous system. This increases peripheral vascular resistance by stimulating the alpha receptors of the blood vessels. While at the level of the renal glomerulus, beta 1 receptors are stimulated, releasing plasmatic renin, and activating the renin-angiotensin-aldosterone system. This is how sodium and water retention occurs, increasing long-term cardiac output, in addition to the additional peripheral vasoconstrictor effect of angiotensin II29,30.
Serum triglycerides, which are transported by lipoproteins, specifically very low-density lipoproteins. On the one hand, this biochemical parameter alone is a good translator of increased abdominal fat. While it is also known that hypertriglyceridemia is related to the atherogenic and proinflammatory process, causing long-term endothelial dysfunction, which is considered the substrate of arterial hypertension31,32
it is important to consider the following limitations. In the first place, it is a systematic review with meta-analysis only in analytical cross-sectional studies since the causality of the association found cannot be proven; however, it is the first global step of how the analytical behavior of both variables should be. Second, as described above, different guides and cut-off points have been used to measure waist circumference in studies around the world, which can be seen reflected in the diversity of selected studies; however, being the first systematic review that addresses these two variables of interest, it was decided to perform a meta-analysis and maintain the statistical value despite the high heterogeneity presented. Third, although it would have been ideal to working with prospective studies, only one was found that met the proposed criteria.
CONCLUSIONS
This SR found that CHTG is associated with the presence of AHT. However, given the few studies found, it is recommended to carry out more primary studies with a prospective design before carrying out the next SR on the subject and with standardized cut-off points to make more homogeneous comparability. Suppose these results are confirmed in subsequent studies. In that case, CHTG could be considered a predictive marker for long-term hypertension, with a fairly affordable utility in daily clinical practice, due to its low cost and easy application.
REFERENCES
1. Jordan J, Kurschat C, Reuter H. Arterial Hypertension. Dtsch Arztebl Int. 2018;115(33-34):557-68. doi:10.3238/arztebl.2018.0557 [ Links ]
2. NCD Risk Factor Collaboration (NCD-RisC). Worldwide trends in hypertension prevalence and progress in treatment and control from 1990 to 2019: a pooled analysis of 1201 population-representative studies with 104 million participants. Lancet. 2021;398(10304):957-80. doi:10.1016/S0140-6736(21)01330-1 [ Links ]
3. Mills KT, Bundy JD, Kelly TN, Reed JE, Kearney PM, Reynolds K, et al. Global Disparities of Hypertension Prevalence and Control: A Systematic Analysis of Population-based Studies from 90 Countries. Circulation. 2016;134(6):441-50. doi:10.1161/CIRCULATIONAHA.115.018912 [ Links ]
4. INEI - Perú: Enfermedades No Transmisibles y Transmisibles, 2020 [Internet]. [citado el 30 de noviembre de 2021]. Disponible en: https://www.inei.gob.pe/media/MenuRecursivo/publicaciones_digitales/Est/Lib1796/ [ Links ]
5. de Oliveira CM, Ulbrich AZ, Neves FS, Dias FAL, Horimoto ARVR, Krieger JE, et al. Association between anthropometric indicators of adiposity and hypertension in a Brazilian population: Baependi Heart Study. PLoS One. 2017;12(10):e0185225. doi:10.1371/journal.pone.0185225 [ Links ]
6. Choi JR, Ahn SV, Kim JY, Koh SB, Choi EH, Lee GY, et al. Comparison of various anthropometric indices for the identification of a predictor of incident hypertension: the ARIRANG study. J Hum Hypertens. 2018;32(4):294-300. doi:10.1038/s41371-018-0043-4 [ Links ]
7. Andrade JR, Velasquez-Melendez G, Barreto SM, Pereira TSS, Mill JG, Molina MDCB. Hypertriglyceridemic waist phenotype and nutritional factors: a study with participants of ELSA-Brasil. Rev Bras Epidemiol. 2017;20(3):382-93. doi:10.1590/1980-5497201700030003 [ Links ]
8. Barreiro-RibeiroFrancieli, Junqueira VC, Cassia da S de, Porto Z, Bernardi RMD, Fernandes C, et al. Hypertriglyceridemic Waist Phenotype Indicates Insulin Resistance in Adolescents According to the Clamp Technique in the BRAMS Study. Childhood Obesity. 2016; doi:10.1089/chi.2016.0180 [ Links ]
9. Braz MAD, Vieira JN, Gomes FO, da Silva PR, Santos OT de M, da Rocha IMG, et al. Hypertriglyceridemic waist phenotype in primary health care: comparison of two cutoff points. Diabetes Metab Syndr Obes. 2017;10:385-91. doi:10.2147/DMSO.S143595 [ Links ]
10. Fernández-García JC, Muñoz-Garach A, Martínez-González MÁ, Salas-Salvado J, Corella D, Hernáez Á, et al. Association Between Lifestyle and Hypertriglyceridemic Waist Phenotype in the PREDIMED-Plus Study. Obesity (Silver Spring). 2020;28(3):537-43. doi:10.1002/oby.22728 [ Links ]
11. Buchan DS, Boddy LM, Despres J-P, Grace FM, Sculthorpe N, Mahoney C, et al. Utility of the hypertriglyceridemic waist phenotype in the cardiometabolic risk assessment of youth stratified by body mass index. Pediatr Obes. 2016;11(4):292-8. doi:10.1111/ijpo.12061 [ Links ]
12. Cabral Rocha AL, Feliciano Pereira P, Cristine Pessoa M, Gonçalves Alfenas R de C, Segheto W, da Silva DCG, et al. Hypertriglyceridemic waist phenotype and cardiometabolic alterations in Brazilian adults. Nutr Hosp. 2015;32(3):1099-106. doi:10.3305/nh.2015.32.3.9305 [ Links ]
13. Chen S, Guo X, Yu S, Yang H, Sun G, Li Z, et al. Hypertriglyceridemic waist phenotype and metabolic abnormalities in hypertensive adults: A STROBE compliant study. Medicine (Baltimore). 2016;95(49):e5613. doi:10.1097/MD.0000000000005613 [ Links ]
14. Freitas RS, Fonseca M de JM da, Schmidt MI, Molina MDCB, Almeida M da CC de. Hypertriglyceridemic waist phenotype: associated factors and comparison with other cardiovascular and metabolic risk indicators in the ELSA-Brasil study. Cad Saude Publica. 2018;34(4):e00067617. doi:10.1590/0102-311X00067617 [ Links ]
15. Vera-Ponce VJ, Alvarado LR, Chávez FH, Zuzunaga-Montoya FE, Vera-Ponce VJ, Alvarado LR, et al. Cintura hipertrigliceridémica y su asociación con la hipertensión arterial una muestra de pobladores adultos peruanos. Revista de la Facultad de Medicina Humana. 2022;22(1):103-9. doi:10.25176/rfmh.v22i1.4116 [ Links ]
16. Moher D, Liberati A, Tetzlaff J, Altman DG, PRISMA Group. Preferred reporting items for systematic reviews and meta-analyses: the PRISMA statement. PLoS Med. 2009;6(7):e1000097. doi:10.1371/journal.pmed.1000097 [ Links ]
17. Ottawa Hospital Research Institute [Internet]. [citado el 11 de julio de 2022]. Disponible en: https://www.ohri.ca/programs/clinical_epidemiology/oxford.asp [ Links ]
18. Modesti PA, Reboldi G, Cappuccio FP, Agyemang C, Remuzzi G, Rapi S, et al. Panethnic Differences in Blood Pressure in Europe: A Systematic Review and Meta-Analysis. PLOS ONE. 2016;11(1):e0147601. doi:10.1371/journal.pone.0147601 [ Links ]
19. Higgins JPT, Thompson SG. Quantifying heterogeneity in a meta-analysis. Stat Med. 2002;21(11):1539-58. doi:10.1002/sim.1186 [ Links ]
20. Cochrane Handbook for Systematic Reviews of Interventions [Internet]. [citado el 27 de noviembre de 2021]. Disponible en: https://training.cochrane.org/handbook [ Links ]
21. Janghorbani M, Aminorroaya A, Amini M. Comparison of Different Obesity Indices for Predicting Incident Hypertension. High Blood Press Cardiovasc Prev. 2017;24(2):157-66. doi:10.1007/s40292-017-0186-3 [ Links ]
22. Tangvarasittichai S, Seangsuk C, Chaisomboon C, Meemark S, Tangvarasittichai O. Association of abdominal obesity, hypertriglyceridemia, and hypertriglyceridemic waist phenotype with hypertension and type 2 diabetes mellitus. Int J Diabetes Dev Ctries. 2015;35(4):439-47. doi:10.1007/s13410-015-0302-7 [ Links ]
23. Taloyan M, Saleh-Stattin N, Johansson S-E, Agréus L, Wändell P. Hypertriglyceridemic waist may explain ethnic differences in hypertension among patients with type 2 diabetes in Sweden. BMC Res Notes. 2012;5:474. doi:10.1186/1756-0500-5-474 [ Links ]
24. Cabrera-Rode E, Stusser B, Cálix W, Orlandi N, Rodríguez J, Cubas-Dueñas I, et al. Concordancia diagnóstica entre siete definiciones de síndrome metabólico en adultos con sobrepeso y obesidad. Revista Peruana de Medicina Experimental y Salud Publica. 2017;34(1):19-27. doi:10.17843/rpmesp.2017.341.2763 [ Links ]
25. Gómez-Ambrosi J, Silva C, Galofré JC, Escalada J, Santos S, Millán D, et al. Body mass index classification misses subjects with increased cardiometabolic risk factors related to elevated adiposity. International Journal of Obesity. 2012;36(2):286-94. doi:10.1038/ijo.2011.100 [ Links ]
26. Seo D-C, Choe S, Torabi MR. Is waist circumference =102/88cm better than body mass index =30 to predict hypertension and diabetes development regardless of gender, age group, and race/ethnicity? Meta-analysis. Prev Med. 2017;97:100-8. doi:10.1016/j.ypmed.2017.01.012 [ Links ]
27. Chen X, Liu Y, Sun X, Yin Z, Li H, Deng K, et al. Comparison of body mass index, waist circumference, conicity index, and waist-to-height ratio for predicting incidence of hypertension: the rural Chinese cohort study. J Hum Hypertens. 2018;32(3):228-35. doi:10.1038/s41371-018-0033-6 [ Links ]
28. Janssen I, Katzmarzyk PT, Ross R. Waist circumference and not body mass index explains obesity-related health risk. Am J Clin Nutr. 2004;79(3):379-84. doi:10.1093/ajcn/79.3.379 [ Links ]
29. Shariq OA, McKenzie TJ. Obesity-related hypertension: a review of pathophysiology, management, and the role of metabolic surgery. Gland Surg. 2020;9(1):80-93. doi:10.21037/gs.2019.12.03 [ Links ]
30. Kotsis V, Stabouli S, Papakatsika S, Rizos Z, Parati G. Mechanisms of obesity-induced hypertension. Hypertens Res. 2010;33(5):386-93. doi:10.1038/hr.2010.9 [ Links ]
31. Evans MC, Stalam T, Miller M. Cardiovascular Risk Assessment in Patients with Hypertriglyceridemia. Curr Cardiol Rep. 2018;20(9):71. doi:10.1007/s11886-018-1013-8 [ Links ]
32. Malhotra G, Sethi A, Arora R. Hypertriglyceridemia and Cardiovascular Outcomes. Am J Ther. 2016;23(3):e862-870. doi:10.1097/MJT.0000000000000116 [ Links ]
8 Article published by the Journal of the faculty of Human Medicine of the Ricardo Palma University. It is an open access article, distributed under the terms of the Creatvie Commons license: Creative Commons Attribution 4.0 International, CC BY 4.0(https://creativecommons.org/licenses/by/1.0/), that allows non-commercial use, distribution and reproduction in any medium, provided that the original work is duly cited. For commercial use, please contact revista.medicina@urp.edu.pe.
Received: June 22, 2022; Accepted: August 24, 2022
 Este es un artículo publicado en acceso abierto bajo una licencia Creative Commons
