


Servicios Personalizados
Revista

Articulo
 Inglés (pdf)
 Articulo en XML
 Referencias del artículo
 Enviar articulo por email
Indicadores
-
 Citado por SciELO
Links relacionados
-
 Similares en
SciELO
Similares en
SciELO
Compartir

 Permalink
Tecnia
versión impresa ISSN 0375-7765versión On-line ISSN 2309-0413
Tecnia vol.29 no.2 Lima jul. 2019
http://dx.doi.org/10.21754/tecnia.v29i2.711
10.21754/tecnia.v29i2.711
EXPERIMENTAL TECHNIQUES FOR STRUCTURES AND SOIL PROBLEMS
Development of analytical models for confined masonry walls based on experimental results in Lima city
Miguel Diaz 1,2*, Carlos Zavala1,2, Erika Flores1,2, Lourdes Cardenas1,2
1 Civil Engineering Faculty, National University of Engineering, Lima, Peru.
2 Japan-Peru Center for Earthquake Engineering Research and Disaster Mitigation, Lima, Peru.
ABSTRACT
For 30 years the Structural Laboratory of the Peru Japan Center for Earthquake Engineering Research and Disaster Mitigation (CISMID) from the Faculty of Civil Engineering (FIC) of the National University of Engineering (UNI) is been testing different types of structural system, mainly confined masonry walls. In that sense, large number of experiments have been conducted in confined masonry walls. Analytical model for capacity curve is presented for walls with different types of masonry units, such as industrial hollow bricks, solid handmade bricks and tubular bricks which are the most representative units in Metropolitan Lima and Callao. Tetra-linear models are calibrated with experimental results in order to provided generalized model in terms of sensitive parameters which determines the capacity curve for flexural shear failure mechanism, such as longitudinal and transversal steel ratio, slenderness ratio and axial load ratio where shear stress is observed in the cracking, yielding, maximum and ultimate points.
Keywords: masonry walls, capacity curve, shear stress, deformation limits.
1. INTRODUCTION
Nowadays, two main regions in Peru are exposed to a seismic gap, Lima and Tacna. They are expecting major earthquakes according to studies conducted under SATREPS Project (cooperation from Japanese Government to the National University of Engineering of Lima of Peru, between 2010 and 2015). These studies showed that a severe earthquake (Mw8.6~8.9) may occur in Lima City [11] . It becomes more important because Lima concentrates over 25% of population of Peru, and large number of dwellings presents high seismic vulnerability; thus, it can result in harmful consequences.
According to seismic risk assessments conducted by CISMID since 2010, by order of the Ministry of Housing, Construction and Sanitation (MVCS), the National Center for the Estimation, Prevention and Reduction of Disaster Risk (CENEPRED) and Ministry of Economy and Finance (MEF), masonry dwellings represent 83% in Metropolitan Lima and Callao [6] .
In twentieth century, a few severe earthquakes occurred in Lima; and it was observed that most adobe structures collapsed, while burnt-clay masonry structures remained standing. Thereafter, people accepted that burnt-brick masonry structures are stronger and more suitable for earthquake prone areas, so its use was massively extended in the country. It has been widely demonstrated during seismic events, and experimental and numerical studies that confined masonry walls can be earthquake-resistant structures [1] , [2] , [10] , [9] , [13] ; and, design procedures are prescribes in standards and codes. Nevertheless, in the last decades, owners from less advantaged sectors hired nonqualified builders; consequently, masonry dwellings were built without any earthquake design criteria using low-quality materials in places with unfavorable site conditions. In that sense, non-engineered dwellings represent over 60% of buildings in Lima, according to the National Institute of Statistics and Informatics of Peru (INEI).
The Structural Laboratory of the Peru Japan Center for Earthquake Engineering Research and Disaster Mitigation (CISMID) from the National University of Engineering (UNI) is been testing different types of structural system, mainly masonry structures since 1989.
2. BACKGROUND
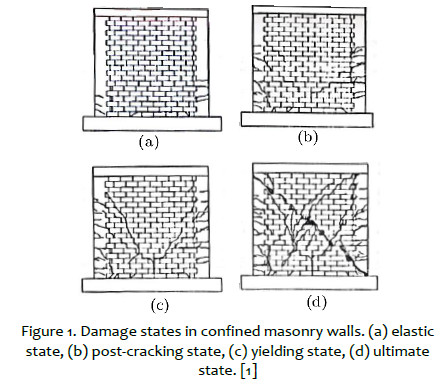
Mechanism of failure under lateral load is represented in Figure 1, and it can be described as follows: within the elastic state some slight horizontal cracks may appear on masonry and bottom part of tie-columns; the limit of this state is called cracking point. After the elastic state, slight diagonal cracks appear on masonry and half bottom part of tie-columns; the limit of this states is called yielding point, within this state it is observed a small stiffness change. Beyond the yielding point, as the lateral load increases, crack patterns on masonry and tie-columns grow until the wall reaches the maximum strength; the limit of this state is called maximum point; within this state is observed a significant stiffness change. Beyond the maximum point, masonry is drastically damaged, and tie-columns take almost all lateral load, thus, there is a high rate of reduction of restoring force in the element until its failure; so then, the deformation is controlled by taking as limit a reduction of 20% of the maximum strength in the restoring force; the limit of this state is called ultimate point; within this state it is observed from almost horizontal slope to negative slope in the capacity curve.
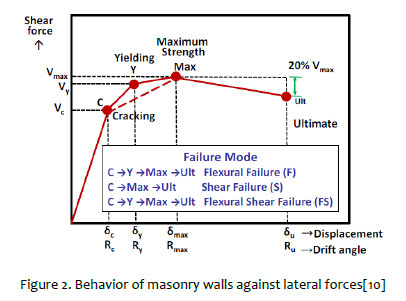
These studies considered tetra-linear model for the capacity curve constructed by four points, namely: points at cracking, yielding, maximum and ultimate state, as shown in Figure 2.
In order to take advantage of experimental data related to masonry structures Sugano et al. and Cardenas et al. in 2014 proposed some formulations to calculated the maximum average shear stress in terms of most sensitive parameters; such as, slenderness ratio (h⁄l), normalized longitudinal steel ratio (Pt∙σy⁄Fm), normalized transversal steel ratio (Pwe∙σwy⁄Fm) and normalized axial load ratio (σ0⁄Fm).
Where:
h : height of wall.
L : length of wall.
l : effective length of wall (≈0.9∙L).
Pt : longitudinal steel ratio (αt∙⁄t.l).
Pwe : transversal steel ratio (αw⁄t.sep ≤ 0.012).
αt : section area of tensile reinforcement of tie column.
αw : section area of lateral reinforcement of tie column.
σy : yielding stress of longitudinal bars of tie column.
σwy : yielding stress of transversal bars of tie column.
σ0 : axial load.
Fm : axial strength of masonry pile.
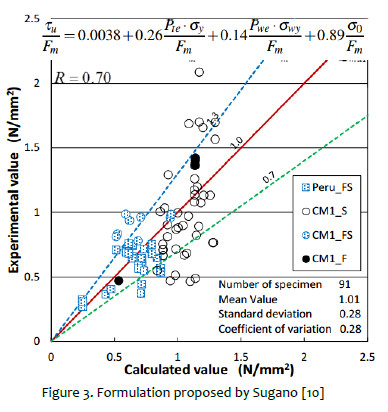
Sugano et al. proposed expression to calculate the maximum average shear stress and deformation in terms of longitudinal and transversal steel ratios and axial stress, based on experimental results from Peru (34 walls) and from Japan (55 walls), as shown in Figure 3. Those expressions calculated accurately the maximum shear stress, but values of deformations were roughly calculated.
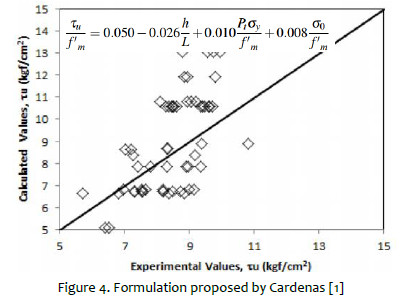
Cárdenas et al. collected experimental results and provided a database, considering capacity curves of walls with different types of units and other characteristics, as shown in Figure 4. Representative deformations expressed in drifts were grouped by each type of masonry units. Additionally, stiffness ratios were used to constructed tetra-linear curves to represent the capacity curve, considering the elastic, the post-cracking, the post-yielding and the ultimate stiffness. It was observed that calculations of average shear stress at each state were roughly calculated in terms of stiffness ratios. However, representative deformation for each type of masonry units presented low scattering.
These studies are useful to professionals and the scientific community related to earthquake engineering to construct damage curves, fragility curves or some curve to represent the vulnerability of masonry dwellings.
In this article, analytical models for capacity and hysteresis curves are presented for walls with different types of masonry units, such as industrial hollow bricks, solid handmade bricks and tubular bricks which are the most representative units in Metropolitan Lima and Callao. tetra-linear models are calibrated with experimental results in order to provided generalized model in terms of sensitive parameters which determines the capacity curve for shear deformations, such as average shear stress, longitudinal and transversal steel ratio, slenderness ratio and axial load. Besides, hysteric curves are also calibrated in order to proposed models for inelastic dynamic analysis.
In consequence, the proposed expression can be useful to model inelastic behavior of confined masonry buildings, especially those which are non-engineered, thus, provided the most suitable retrofitting technique to reduce the seismic risk.
3. MASONRY WALLS
Masonry walls are grouped in terms of the mechanical properties. Thus, it is possible to identify in Metropolitan Lima and Callao,
The most representative masonry walls of these confined masonry dwellings, shown in Figure 5, are made of industrial hollow bricks (less than 20% of hollow area), handmade solid bricks and industrial tubular bricks. The last type is supposed to be used for partition walls only, because of its low cost.
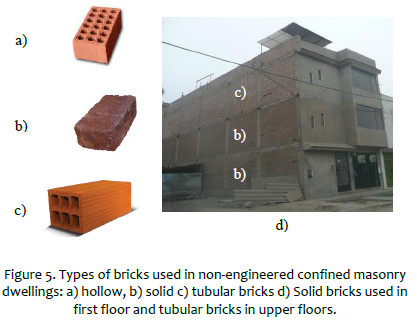
Generally, in non-engineered confined masonry dwellings, walls in first floors are composed of solid bricks, while the walls in upper floors are composed of tubular bricks. The concept of these structures is based on less weight in upper floors, considering gravity loads only. As mentioned above, Peru has several earthquake prone areas, such as its capital, Lima. Consequently, dwellings must be designed as earthquake-resistant structures. Also, there are dwellings in which structural walls are made only from tubular bricks. It is known that walls made from tubular bricks have low lateral load capacity, and their failure mode is brittle; even if it has confinement [7] , [8] . For that reason, tubular bricks are not allowed for construction of structural walls according to Peruvian Standards. Besides, masonry structures shall be up to five stories high. Nevertheless, number of stories is exceeded in some areas because of the lack of control; this results in structures with high seismic vulnerability.
4. EXPERIMENTAL VALUES
After filtering experimental database, 42 cyclic loading tests in masonry walls are treaded, and their respective tests in masonry components, such as axial load test and diagonal tension test.
Experimental values are grouped in terms of shear stress ratio at cracking point (τcr⁄Fm), shear stress ratio at yielding point (τm⁄Fm), shear stress ratio at maximum point (τm⁄Fm) and shear stress ratio at ultimate point (τu /Fm).
Figure 6 shows the relationship between experimental values of shear stress ratio and slenderness ratio. The experimental range of slenderness ratio is between 0.6 and 1.3. It is observed in this range that there is no trend in this relationship; although it is known that walls with high values of slenderness ratio are most susceptible to cause flexural failure mechanisms. Hence, it is important to mention that the proposed formulations must be applied between the studied range, and the influence of slenderness ratio is neglected.
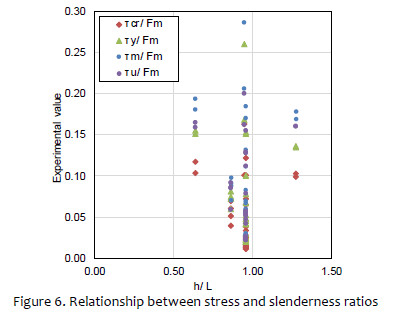
Figure 7 shows the relationship between experimental values of shear stress ratio and axial stress ratio. There is a trend in this relationship, because, as known that an increment of axial load in well-confined walls results in an increment of strength and ductility.
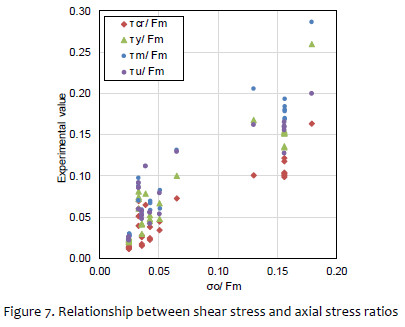
Figure 8 , Figure 9 , Figure 10 and Figure 11 show the relationship between the shear stress ratio at cracking, yielding, maximum and ultimate points, and parameters of reinforcement such as normalized longitudinal steel ratio (Pt∙σy⁄Fm) and normalized transversal steel ratio (Pwe∙σwy⁄Fm).
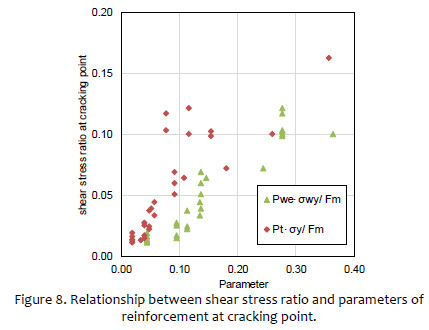
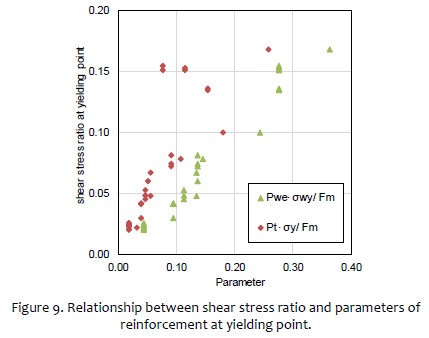
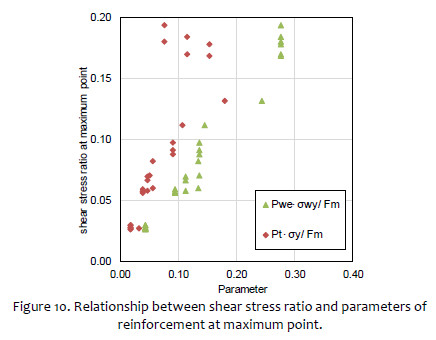
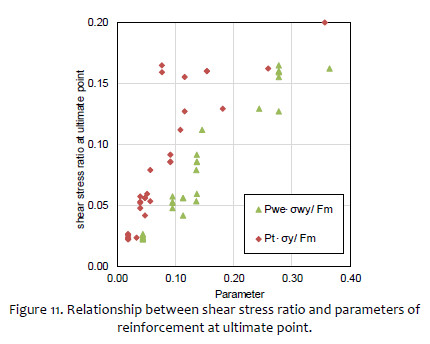
It is observed that there is a trend in the relationship between the shear stress ratio at cracking, yielding, maximum and ultimate points, and parameters of reinforcement. Nevertheless, this trend is improved when the normalized longitudinal steel ratio is linearized. In this sense, the best correlation of this parameter results when it is powered by 0.7.
5. PROPOSED FORMULATIONS
5.1. Analytical models
Capacity curves of structural elements can be represented as multi-linear curves. It was observed that confined masonry walls present different states limited by the elastic, the cracking, the yielding, the maximum and the ultimate points, as shown in Figure 2 . In this sense, the proposed formulations can be utilized to construct the capacity curve, nevertheless, deformations are needed; that´s why, representative drifts at cracking, yielding, maximum and ultimate point are grouped by type of masonry unit, using experimental data collected by Sugano et al. and Cardenas et al. and updated in this study.
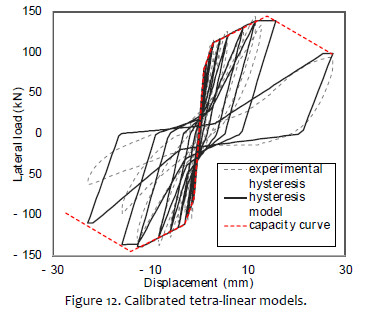
Capacity curve based on tetra-linear models can improve the hysteresis behavior of confined masonry models. There are hysteresis models that use four lines, such as the degrading trilinear slip hysteresis model which was adapted by Professor Saito [12] .
Figure 12 shows one of the experimental hysteresis curves and its corresponding analytical models. It is observed that behavior of confined masonry walls under lateral loads may be non-symmetric. However, hysteresis modeling is improved by applying the tetra-linear model.
5.2. Formulations for average shear stress
Equations proposed by Sugano and Cardenas presented similar terms, such as longitudinal steel ratio, axial stress and constant coefficient. Nevertheless, they also presented different terms. In case of Sugano, the calculation of maximum average shear stress included transversal steel ratio, because it attempts to predict the strength for shear, flexural or flexural-shear failure; while, in case of Cardenas, the calculation included slenderness ratio.
In this study, longitudinal and transversal steel ratio and axial stress ratio are included in the proposed formulations, considering flexural shear failure, because this failure was widely observed in confined masonry walls tested in the last years and damaged confined masonry walls in the last seismic events. In this sense, a general equation is proposed in Eq. (1).

A multilinear regression based on Eq. (1) was conducted to obtain coefficients β0, β1, β2 and β3, which are summarized in Table 1 . It was observed in the statistical analysis that the longitudinal steel ratio has very small influence shear stress ratio at cracking and yielding point, because when confined masonry wall leaves its elastic state, masonry and confinement given by stirrups of tie-columns and axial load works much more than other elements.
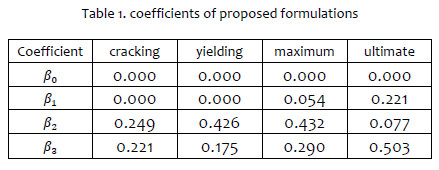
Figure 13, Figure 14 , Figure 15 and Figure 16 show the relationship between experimental and calculated values using the proposed formulations.

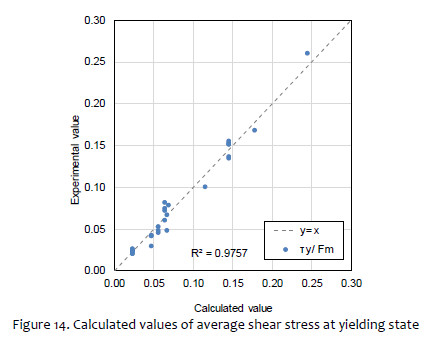
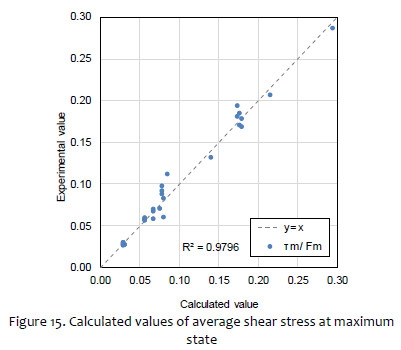

It is observed in these figures, that proposed formulations present high accuracy; nevertheless, as mentioned above, the formulations can be applied for confined masonry wall with units from Metropolitan Lima and Callao, considering values of parameters within the range of experimental values described in this study. However, this methodology can be applied for
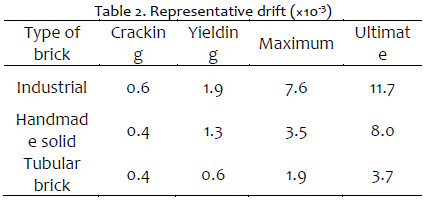
5.3.Representative deformations
Table 2 summarizes the representative deformations expressed in drifts grouped according experimental tests conducted in the laboratory of structures [1] , [2] , [3] , [5] , [13] , [7] , [8] , [14] , [4] .
CONCLUSIONS
Confined masonry walls, especially non-engineered walls, are very complex structural elements to predict their behavior, that’s why this study, from collected experimental data, proposes accurate formulations to calculate the average stress ratio at cracking, yielding, maximum and ultimate point in order to construct the capacity curve expressed in a tetra-linear model.
It is observed that the relationship between slenderness ratio and shear stress ratio there has not present trend, that’s why this parameter is neglected in the proposed formulations. Nevertheless, this parameter must be between 0.6 and 1.3 to apply these formulations.
The longitudinal steel ratio has very small influence in the shear stress ratio at cracking and yielding point, because when confined masonry wall leaves its elastic state, masonry and confinement given by stirrups of tie-columns and axial load works much more than other elements.
These formulations improve the capacity curve and hysteresis modeling. Therefore, their application can be widely used for confined masonry walls, including non-engineered walls. Nevertheless, parameters must be within the experimental range describes in this study for characteristic masonry from Lima Metropolitan and Callao. However, this methodology can be applied to other masonry conditions while experimental data exits.
ACKNOWLEDGEMENT
Authors would like to express their gratitude to the Vice-Rectorate for Research of UNI for its support for the research Also, authors are grateful to National Fund for Scientific Development (FONDECYT), the National Training Service for the Construction Industry (SENCICO) and the Peruvian Ministry of Economy and Finance for the support of experimental tests, which was included in the National Budget PP-068 for their support for conducting experimental tests.
REFERENCES
[1] Cardenas L, Roy R, Estacio L and Zavala C 2014 Implementation of Database of Masonry Walls Test – Review of Existing Test Data in Peru. Journal of Disaster Research 9(6) [ Links ]
[2] CISMID 2015 Comparison of Behavior of Non-Engineering Masonry Walls under Lateral Cyclic Loading without and with Retrofitting. Program 0068 – Reduction of Vulnerability and Assistant of emergencies by Disasters. Lima-Peru. (In Spanish) [ Links ]
[3] CISMID 2017 "Tests of full-scale walls and elaboration of corresponding fragility curves oriented to the development of knowledge about seismic behavior of nonengineered masonry walls and to enable the estimation of losses for earthquake scenario", Report commissioned by SENCICO [ Links ]
[4] CISMID 2015 Experimental Study of Mechanical Properties of Tubular Units without and with Retrofitting. Program 0068 – Reduction of Vulnerability and Assistant of Emergencies by Disasters. Lima-Peru.(In Spanish) [ Links ]
[5] Diaz M, Zavala C, Gallardo J, Lavado L 2017 "Experimental study of non-engineered confined masonry walls retrofitted with wire mesh and cement-sand mortar", 16th World Conference on Earthquake Engineering, Chile [ Links ]
[6] Diaz M 2019 "Report on statistical analysis and target study Area in Lima Metropolitan and Callao". Project FONDECYT-CISMID-FIC-UNI Development a digital tool for feasibility of confined masonry dwelling retrofitting in multi seismic scenarios based on assessment of vulnerability and risk [ Links ]
[7] Lavado L, Taira J and Gallardo J 2014 Current State of Masonry Properties Material on Emerging Zones in Lima City. Journal of Disaster Research, 9(6) [ Links ]
[8] Salinas R and Lazares F 2008 Seismic Performance of Confined Masonry Buildings with Tubular Bricks in Developing Areas. Proceedings of 14th World Conference on Earthquake Engineering. China [ Links ]
[9] SENCICO 2006 Norma E-070. "Masonry". Ministry of Construction, Housing and Sanitation. Peru [ Links ]
[10] Sugano S, Saito T, Zavala C and Cardenas L 2014 Strength and Deformation of Confined Brick Masonry Walls Subjected to Lateral Forces – Review of Existing Test Data in Japan and Peru. Journal of Disaster Research, 9(6) [ Links ]
[11] Pulido N, Tavera H, Perfettini H, Chlieh M, Aguilar Z, Aoi S, Nakai S and Yamazaki F 2011 "Estimation of Slip Scenarios for Megathrust Earthquakes: A Case Study for Peru," in Effects of Surface Geology on Seismic Motion, pp 1-6 [ Links ]
[12] Saito 2019 "Technical Manual Version 6.1 of Structural Earthquake Response Analysis (STERA)" [ Links ]
[13] Zavala C and Kaminosono T, et al. 2003 "Construction Monitoring and Improvement Techniques for Masonry Housing," CISMID-IDI Report [ Links ]
[14] Zavala C, Lavado L, Taira J, Cardenas L and Diaz M 2014 Comparison of Behaviors of Non-Engineered Masonry Tubular Block Walls and Solid Engineered Walls. Journal of Disaster Research, 9(6) [ Links ]
* Corresponding author:
Received: 29/06/2019
Accepted: 12/08/2019

