


Servicios Personalizados
Revista

Articulo
 Inglés (pdf)
 Articulo en XML
 Referencias del artículo
 Enviar articulo por email
Indicadores
-
 Citado por SciELO
Links relacionados
-
 Similares en
SciELO
Similares en
SciELO
Compartir

 Permalink
Tecnia
versión impresa ISSN 0375-7765versión On-line ISSN 2309-0413
Tecnia vol.29 no.2 Lima jul. 2019
http://dx.doi.org/10.21754/tecnia.v29i2.706
10.21754/tecnia.v29i2.706
SEISMIC PROTECTION SYSTEMS
Applicability study of a low cost seismic isolator prototype using recycled rubber
André Muñoz1,2*, Miguel A. Díaz 1,2, Roy Reyna 1,2
1 Civil Engineering Faculty, National University of Engineering, Lima, Peru.
2 Japan-Peru Center for Earthquake Engineering Research and Disaster Mitigation, Lima, Peru.
ABSTRACT
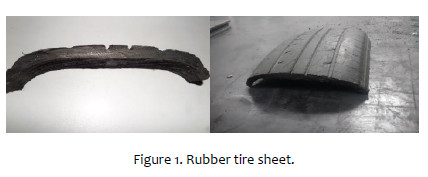
In order to protect buildings against earthquakes that are categorized as "common" according to the Peruvian Earthquake Resistant Standard, a prototype of Recycled Rubber Seismic Isolator ("RRSI") was developed in the structural laboratory of the Japan-Peru Center for Earthquake Engineering Research and Disaster Mitigation - CISMID, Peru. The raw material used to manufacture this device was recycled rubber tires; the rubber tire was cut into square shape sheets with 190mmx190mm of cross-section and a total thickness of around 11 mm. Rubber tire sheets were joined to each other by a vulcanization process, including rubber layers with 3mm of thickness made of recycled rubber tire powder in between rubber tire sheets; and in between the rubber tire sheet and the steel plate at both ends of the bearing.
Two specimens were tested in a shaking table under a free vibration impulse or displacement in order to get their natural vibration frequency, natural period, and inherent damping. Then, to obtain the hysteretical behavior, a cyclic lateral reversal-loading test was conducted on three different specimens applying a constant axial load of 330MPa, 270MPa, and 220MPa respectively and a lateral displacement pattern with different levels of shear deformations up to the failure, which occurs at a shear strain of around 100%.
From the experimental results, a nonlinear hysteretic behavior and energy dissipation were observed, decoupling the lateral movement. Finally, a numerical model was proposed to model the nonlinear hysteretic behavior of the RRSI based on a Modified Bouc-Wen model. This numerical model was simulated by using the specimens as base isolators for buildings.
Keywords: Base isolation, vibration isolation, recycled rubber, bouc wen hysteretic model, time history analysis.
1. INTRODUCTION
Seismic isolation systems have proved their efficiency in protecting buildings against earthquakes since the last decades [1] . As Peru is located in a high seismic hazard zone, it is necessary to protect essential buildings like hospitals, governmental buildings, etc., to ensure the life of its inhabitants, to keep the structure and non-structural elements without any damage, and that the building remains operational post-earthquake [2] .
Seismic isolation system is expensive to afford [3] [4] , especially in developing countries so, to protect buildings that are not categorized as essential buildings, such as dwellings, or other minor structures, it will be almost impossible to afford the use of this kind of system.
For this reason, this research aims to develop a prototype of an isolator device with a low cost of manufacture, Recycled Rubber Seismic Isolator ("RRSI"), using recycled rubber tire sheets.
1.1. Scope
The main goal of this research is to develop a prototype of a base isolation device with a low cost of manufacture using recycled rubber tire sheets. As specific goals, the behavior of the "RRSI" specimen will be studied under a free vibration test, a lateral reversal-loading test and, a numerical hysteresis model will be developed to simulate the experimental results.
2. OUTLINE OF THE TESTS
2.1. Specimens
The raw material used was recycled rubber tires [5] , the rubber tire was cut into a square shape sheet of 190mm x 190mm and about 1.1cm of thickness (See Figure 1 ), the internal wire mesh was kept as a contribution for the vertical stiffness of the isolator support, amount of wire-reinforcement is about 8.59% of the cross-section.
Rubber tire sheets were joined to each other through a vulcanization process, with a rubber layer of 3mm thickness made of recycled rubber tire powder in between rubber tire sheets; and in between the rubber tire sheet and the steel plate at both ends of the bearing.
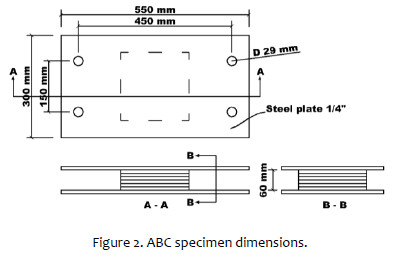
The total rubber section of the isolator consists of four rubber tire sheets, with a total height of 6cm. Also, in order to assemble the isolator with the steel frame, holes of 29mm of diameter were made in both steel plates. The geometry of the specimen is shown in Figure 2.
2.2. Free vibration test
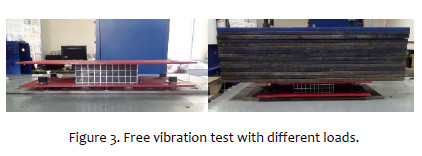
A free vibration test was conducted to obtain the dynamic properties of the specimen, this test consists of applying an initial impulse or deformation over the isolator, getting its natural vibration frequency, natural period and inherent damping.
To carry out the free vibration test, different dead loads were applied on top of the isolators, then, a sequence of initial impulse and initial deformation was applied to the specimen as it is shown in Figure 3.
The measurement of the specimen response during the test was done with accelerometers and displacement laser transductors at the bottom and the top of the specimen. The isolator response was recorded during the test.
2.3. Lateral reversal load test setup
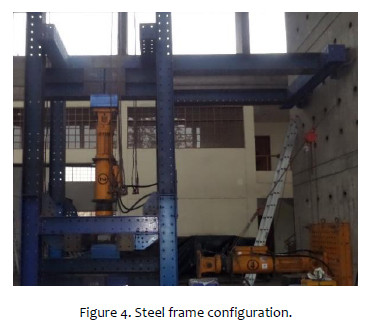
Three specimens were tested in a cyclic lateral reversal loading test to study its behavior under cyclic lateral loads. This test consists of applying a constant axial load of about 100kN described in section 4.3.1, which is the mean axial load obtained by the analysis of the target building, and a lateral displacement pattern with increasing levels of shear deformations up to the failure (See Table 1).

The set up of this test and steel frame configuration is shown in Figure 4.
For the load measurement, two load cells were used; meanwhile, the horizontal and vertical displacements as the nodding of the top and bottom of the isolator were measured using displacement transducers, which distribution is shown in Figure 5.
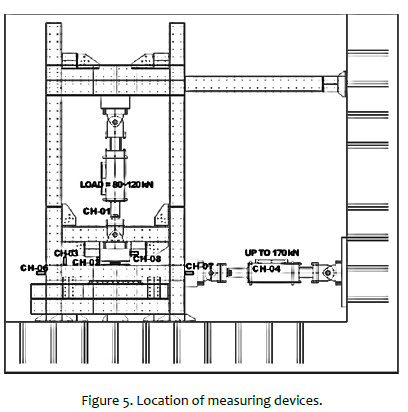
During the application of the axial load, substantial vertical deformation was observed in RRSI-1 while applying a load of 200kN. That is why the axial load was reduced to 80kN, 100kN, and 120kN for RRSI-1, RRSI-2, and RRSI-3 respectively.
This vertical deformation also came with little bulge sideways because the steel wire inside the rubber does not provide a vertical stiffness enough to carry the applied load [4] .
During the application of the horizontal load, friction was produced between the rollers located below the bottom steel frame; this phenomenon can be seen in the hysteresis curves of all the isolators.
3. TESTS RESULTS
3.1. Free Vibration Test
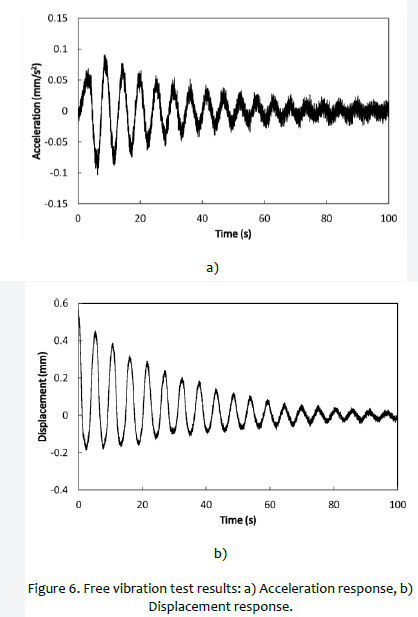
The displacement and acceleration responses of the specimens were recorded and are shown in Figure 6. The data was processed through the cleaning of external signals (noise) by filtering, leaving out no significative frequencies like the ones that were produced by secondary or local modes.
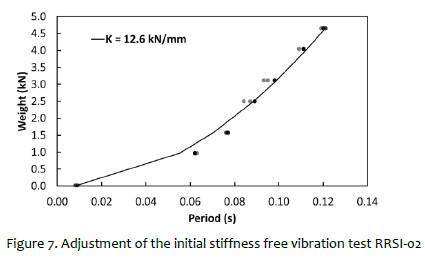
Using the processed data, a Fast Fourier Transform Analysis was performed, from the Fourier spectrums of all the tests, its fundamental period was calculated, from this data is possible to obtain the initial stiffness by fitting the Weight vs Period graph shown in Figure 7. The initial stiffness of the isolators were 5.54kN/cm and 12.6kN/cm for RRSI-1 and RRSI-2 respectively.
Lateral reversal load test
The experimental hysteresis curve of specimens RRSI-1, RRSI-2, and RRSI-3 are shown in Figure 8.
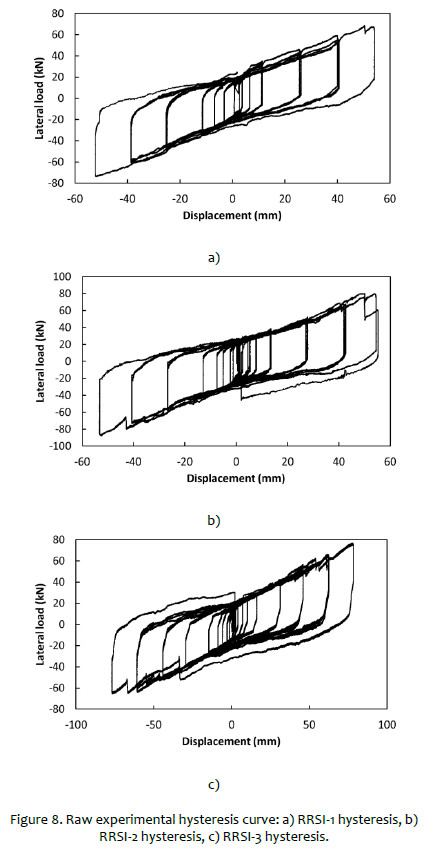
The raw experimental curve needs to be processed because factors like nodding, friction, and pauses during the tests needs to be eliminated.
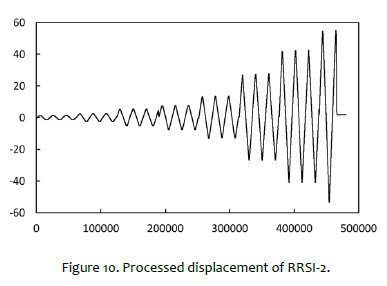
The first factor to be processed is all the pauses during the test, as can be seen in the displacement obtained from the RRSI-2 in Figure 9, almost at the end of each drift, a pause has been made. By deleting these points with zero loads, the pauses are also eliminated as it can be seen in Figure 10.

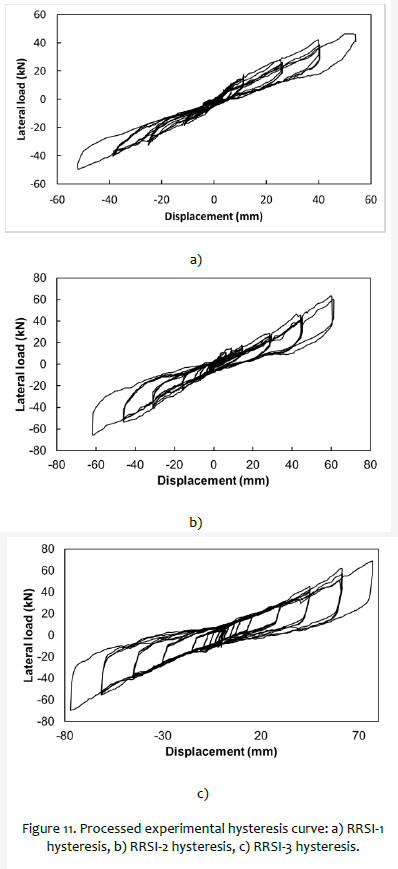
As said in 2.3, the action of the friction needs to be eliminated, in order to do this, it was determined that the part of the hysteresis with constant displacement located when the curve change its direction (from pushing to pulling and vice versa); furthermore, in this vicinity, the density of points is much lower than other sections of the curve.
Finally, the effect of the nodding was registered by a displacement transductor, to delete this effect, the respective loads needs to be subtracted from the total lateral load.
The hysteresis of the isolators without the external factors described before are shown in Figure 11.
4. NUMERICAL SIMULATION
4.1. Bouc-Wen hysteresis model
The basic formula of Bouc-Wen model, described by Ikhouane [6] and Saito [7] is shown in Eq. (1) and (2).

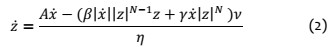
Where, β, γ and N are parameters that control the shape of the hysteresis loop, while A, ν and η are variables that control the material degradation.
However, this type of Bouc-Wen model does not fit well with the experimental data due to its lack of reproduce the pinching effect and the hardening effect at the end of the loop so, inspired on the Bouc-Wen Baber and Noori model [8] [9] and using the properties of the Gauss bell, a modified Bouc-Wen model is developed. This model is described by the Eq. (3), (4), (5) and (6).


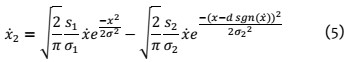
The described hysteretic model have 11 parameters that are shown in Eq. (7).
4.2. Modified Bouc-Wen identification by Modified Firefly Algorithm
Due to the large number of parameters and the differential nature of the model, Modified Firefly Algorithm (MFA) [10] is used to identify the best parameters that fit the experimental curves.
To carry on the MFA simulation the following points are taken into account, the dimension of the solution space is 11 due to the number of parameters, the number of generations is 1000 and the number of fireflies in each generation is 500. Also, the experimental data is first fitted to an original Bouc-Wen model to approximately obtain the first 6 parameters of the Eq. (7). Then, the full Modified Bouc-Wen model is fitted through the MFA algorithm obtaining the curves shown in Figure 12.
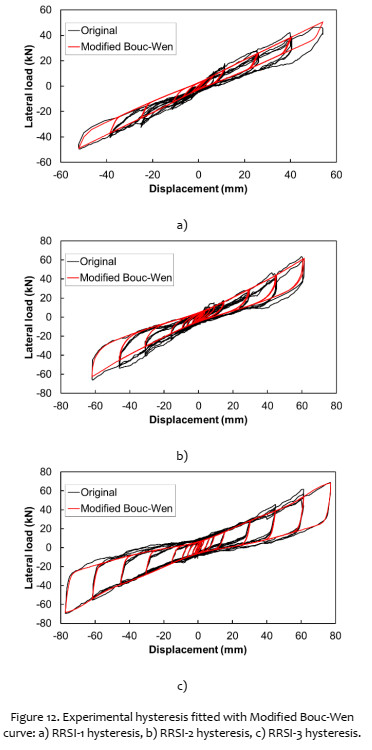
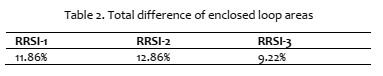
By the comparison of the enclosed area of each loop, the percentage of error for each isolator is obtained, as is shown in Table 2 , the max error reached is 12.85%.
4.3. Nonlinear Analysis Settings
Once the hysteretic properties of the isolators are identified, a nonlinear analysis must be carried on to obtain its performance below a "Common" rated building under different earthquakes
4.3.1. "Common" building properties
As indicated in the section 1, this isolator is intended to be used in "Common" buildings. This is why the chosen building to be analyzed is a two floor masonry dwelling built in the CISMID (from now called "CISMID house") as part of the "Proyect for Construction Monitoring and Improvement Techniques for Masonry Housing". A typical floor of this building is shown in Figure 13.

As result of the test of this building, its hysteretic behavior is obtained and identified with a Takeda-Slip model.
Two models are analyzed, the first one consist of the fixed building and the second one has a first isolated floor using 10 RRSI-3 due to the axial loads transmitted to the isolators oscillate between 100kN and 120kN, the second and third floor corresponds to the first and second floor of the studied building.
Due to the lack of programs that allow to introduce new hysteretic models like the Modified Bouc-Wen described in section 4.2, a FORTRAN program developed by Dr. Miguel A. Díaz was used to carry on the simulation.
4.3.2. Records to be used
The records used in this analysis belong to real historical earthquakes from Peru and Japan, and are listed in Table 3. These earthquakes were scaled in two different forms.

The first group of records was scaled by Match Spectrum algorithm, with a spectrum corresponding to a building with the parameters Z4, U = 1 and varying the soil parameter from S0 to S4, so the performance of the isolators can be seen in different kinds of soils, as well as different predominant frequencies.
The second group of records was scaled arithmetically, in order to obtain the performance of the isolator under different levels of accelerations.
5. RESULTS AND DISCUSSION
5.1. Nonlinear Analysis Results
5.1.1. Ica, Pisco and Chincha earthquake
A comparison between the fixed and isolated models was realized with the record of the Ica, Pisco and Chincha earthquake. The comparison between the last floor of both model is shown in Figure 14. The comparison between their upper floor hysteresis is shown in Figure 15, and the hysteresis performance of the isolated floor is shown in Figure 16.
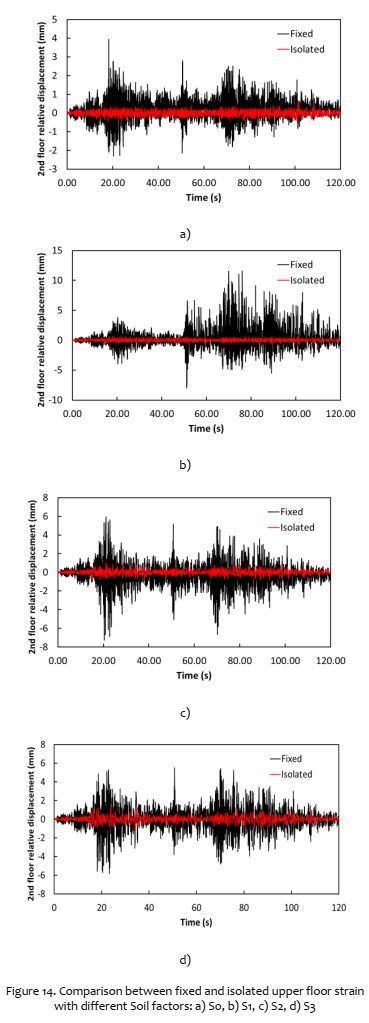
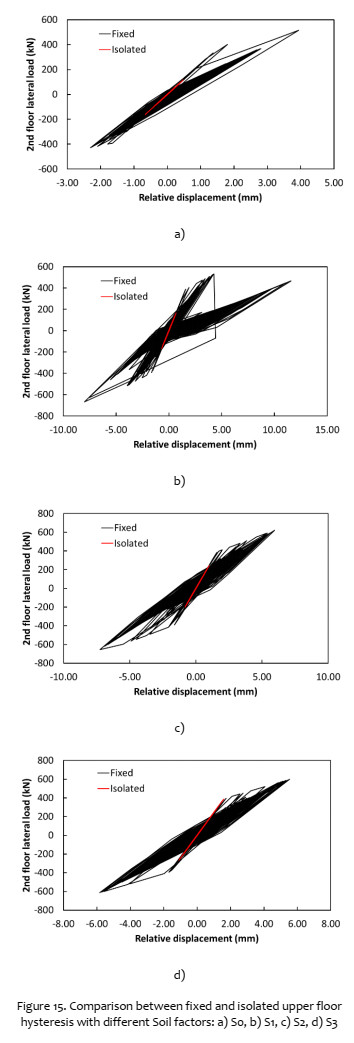


The maximum strains shown in Table 4 indicate that, when using the isolation system, it can reduce the strains between 3 and 10 times. Also, as it is shown in Figure 15, the fixed building enters into its inelastic range. Meanwhile, when using the isolation system, the superstructure keeps its linear range. This means that the isolated structure would not suffer from damage.

CONCLUSIONS
- From the experimental results of free vibration test, it was confirmed that the prototype of base isolation with low cost of manufacture decouples the movement, improving the response by reducing the acceleration on top of the device.
- In the lateral reversal loading test, a large vertical deformation was observed because the steel wire inside the rubber does not provide a vertical stiffness enough to carry the applied load; for this reason, the axial load was took between 80kN and 120kN.
- Although the specimens failed at around 100% of the rubber strain deformation of the specimen, the deformation of the prototype could be enough to decouple the isolation system.
- From the comparison of the experimental result with the analytical hysteretical model developed, a good approach was obtained, with a maximum error of 12.86%. However, when displacements beyond the maximum tested are reached, the hysteretical model can fail in its accuracy. it is recommended to improve the prototype to provide an adequate vertical stiffness and to increase its shear deformation capacity.
- From the nonlinear dynamic analysis, it can be concluded that the isolator reduces the strains of the building in around five times.
- When the isolation system is used, the building keeps its linear behavior as is shown in its hysteresis curves; this means that the structure would not suffer damage.
ACKNOWLEDGEMENTS
The authors would like to express their gratitude to Japan-Peru Center for Earthquake Engineering Research and Disaster Mitigation CISMID, Civil Engineering Faculty of the National University of Engineering. In addition, the authors want to thanks E. Zavala, D. Escalante, L. Nuñez, J. Cueva and E. Flores for their support during the experimental research.
REFERENCES
[1] Higashino M 2006 Response Control and Seismic Isolation of Buildings. Routledge Available from: http://dx.doi.org/10.4324/9780203018866 [ Links ]
[2] Ministerio de Vivienda, Construcción y Saneamiento. RM-355-2018-Vivienda Norma Técnica E.030 Diseño Sismorresistente. [ Links ]
[3] Kelly JM 1997 Seismic Isolation for Earthquake-Resistant Design Earthquake-Resistant Design with Rubber [Internet]. Springer London, pp 1–18. Available from: http://dx.doi.org/10.1007/978-1-4471-0971-6_1 [ Links ]
[4] Kelly JM, Konstantinidis DA 2011 Mechanics of Rubber Bearings for Seismic and Vibration Isolation. John Wiley & Sons, Ltd Available from: http://dx.doi.org/10.1002/9781119971870 [ Links ]
[5] Turer A, Özden B 2007 Seismic base isolation using low-cost Scrap Tire Pads (STP). Materials and Structures [Internet]. Springer Science and Business Media LLC; 13; 41(5), pp 891–908. Available from: http://dx.doi.org/10.1617/s11527-007-9292-3 [ Links ]
[6] Ikhouane F, Mañosa V, Rodellar J 2007 Dynamic properties of the hysteretic Bouc-Wen model. Systems & Control Letters [Internet]. Elsevier BV, 56(3), pp 197–205. Available from: http://dx.doi.org/10.1016/j.sysconle.2006.09.001 [ Links ]
[7] Saito T 2017 STERA 3D Technical Manual Version 5.8. Toyohoshi university of technology [ Links ]
[8] Chatzi EN, Smyth AW, Masri SF 2010 Experimental application of on-line parametric identification for nonlinear hysteretic systems with model uncertainty. Structural Safety [Internet]. Elsevier BV; 32(5), pp 326–37. Available from: http://dx.doi.org/10.1016/j.strusafe.2010.03.008 [ Links ]
[9] Sengupta P, Li B Modified Bouc–Wen model for hysteresis behavior of RC beam–column joints with limited transverse reinforcement 2013 Engineering Structures [Internet]. Elsevier BV; 46, pp 392–406. Available from: http://dx.doi.org/10.1016/j.engstruct.2012.08.003 [ Links ]
[10] Zaman MA, Sikder U 2015 Bouc–Wen hysteresis model identification using Modified Firefly Algorithm. Journal of Magnetism and Magnetic Materials [Internet]. Elsevier BV; 395, pp 229–233. Available from: http://dx.doi.org/10.1016/j.jmmm.2015.07.080 [ Links ]
* Corresponding author:
Received: 29/06/2019
Accepted: 07/08/2019

