


Services on Demand
Journal

Article
 English (pdf)
 Article in xml format
 Article references
 Send this article by e-mail
Indicators
-
 Cited by SciELO
Related links
-
 Similars in
SciELO
Similars in
SciELO
Share

 Permalink
Tecnia
Print version ISSN 0375-7765On-line version ISSN 2309-0413
Tecnia vol.29 no.2 Lima July 2019
http://dx.doi.org/10.21754/tecnia.v29i2.700
10.21754/tecnia.v29i2.700
EARTHQUAKE ENGINEERING DESIGN AND EVALUATION
Site response analysis and its comparison with the peruvian seismic design spectrum
Zenón Aguilar 1,2*, Juan Tarazona 1, Luis Vergaray 1, José Barrantes 1
1 Civil Engineering Faculty, National University of Engineering, Lima, Peru.
2 Japan-Peru Center for Earthquake Engineering Research and Disaster Mitigation, Lima, Peru.
ABSTRACT
The site response analyzes provide an idea of the behavior of soils under seismic loads, involving a large number of variables that determine the non-linear behavior of the soil. Due to the complexity of these analyzes, in practice the effects of nonlinear soil behavior are incorporated as factors that modify the seismic response spectrum in rock (linear behavior). In this study, nonlinear site response analysis has been performed for 50 soil profiles in an attempt for covering a wide range of shear wave velocity profiles using the software DEEPSOIL V.7. For this purpose, 03 seismic records have been spectrally adjusted to uniform hazard spectrum of 475, 1000 and 2475 years of return period of a reference soil profile with Vs30 of 760 m/s. Subsequently, a comparison of the results obtained from the site response analysis with the parameters stipulated in the Peruvian Seismic Design Code E.030 (2018) for the design spectrum was made, in order to evaluate if the last one adequately matches the response of each type of soil. Discrepancies in the ranges of Vs30 values that this standard considers for the classification of soils and the factors that determine the width of the platform of the design spectrum have been found, implying that a new range of Vs30 for the soil classification is needed.
Keywords: Site response, Peruvian design spectrum, nonlinear soil behavior.
1. INTRODUCTION
Site response analysis is used to predict the effects caused in a soil deposit due to seismic loads and based on these, the design spectrum is developed, the stresses and dynamic deformations for the evaluation of liquefaction hazard are evaluated and the earthquake induced stresses, that could lead to structures instability[1] are determined. Although the source of a seismic event is unique, there are several factors that influence the wave propagation, among which the soil plays a preponderant role.
The seismic design codes provide guidelines for the construction of seismic design spectra, which are indicators of seismic demand levels of a particular region. In Peru, the seismic design code (E.030) establishes a design spectrum that depends on the type soil, importance factor and other parameters that determines its geometry. However, since there is some concerns in the way the shear wave velocity ranges for defining the type of soils were established, it is necessary to evaluate their adequacy to validate or recommend their redefinition.
The objective of this research is to perform site response analyzes on representative soil profiles for the coast of Peru, under the effect of strong ground motions of scenario earthquakes for this Peruvian region. Based on the results, possible trends in the behavior of soils during large events will be sought through the comparison between acceleration response spectra and the amplifications factors obtained from the input spectrum and the surface spectrum ratio.
Subsequently, a comparison of the shape of the obtained response spectra with the design spectra of the E.030-2018 code is performed, as well as the influence of some other parameters on the soil response is evaluated. This entails a revision of the classification methodology of soils currently proposed by this regulation. The results here presented seeks to start a discussion on the suitability of the design spectrum of the Peruvian seismic code, in order to promote its improvements.
2. PERUVIAN SEISMIC DESIGN CODE
The Peruvian Seismic Design Code E.030-2018 (PSDC) classifies the seismic soil behavior using predominantly the average value of the shear waves velocity of the first 30 meters (Vs30) as shown in Table 1 .
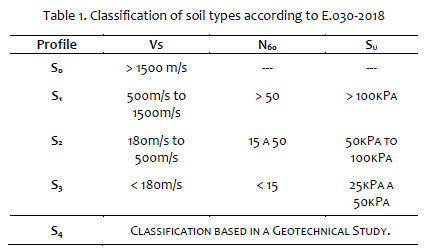
The S0 soil type includes very hard rock; soil type S1, from very dense granular soils to soft rocks; soil type S2, to medium dense granular soils and firm cohesive soils; soil type S3, to soft soils and soil type S4 correspond to special soils.
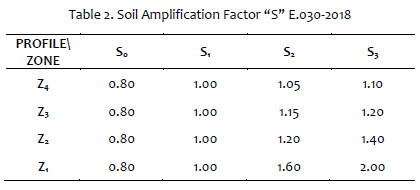
Additionally, it considers a base design spectrum, which is scaled with a soil amplification factor according to the soil classification and the seismic zone, in order to obtain the design spectrum of a specific site. (Table 2 ).
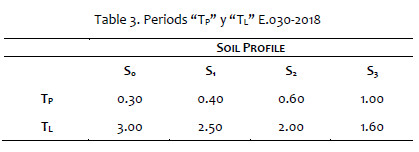
Moreover, the PSDC define the TP and TL parameters (Table 3), where, the former determines the upper limit of the platform zone at short periods and the second, the lower limit of the long period zone.
3. SITE RESPONSE ANALYSIS
In this research, nonlinear effective stress site response analyses are performed using the one-dimensional analysis software DEEPSOIL 7.0[2] for each one of the 6 acceleration time histories of the 3 scenario earthquakes and 50 compilated soil profiles. Input ground motions were considered to be outcropping and they were applied directly to the compliant base in the DEEPSOIL model, as recommended by Stewart et al.[3] .
The unit weight and shear wave velocity for the underlying bedrock was considered equal to 22 kN/m3 and 760 m/s for all scenarios. These values have been chosen since the uniform hazard spectra have been developed for a rigid half-space with similar characteristics.
The MRDF constitutive model and the Rayleigh damping formulation presented by Park and Hashash [4] were used in the analysis. The target shear modulus reduction and damping curves used are based on the data available in the literature. For rock, the relation of Idriss[5] was employed. In the case of granular soils and fine soils, the curves of Menq[6] and Darandelli[7] were respectively assigned, and the required parameters for each formulation were obtained from soil mechanical test.
The maximum frequency is the highest frequency that can propagate through a soil layer when performing time domain site response analyses, which is given by fmax = Vs/4H, where Vs is the shear wave velocity of the layer, and H is its thickness [8] .
Seismic site response analysis that calculates large levels of shear strain should consider the dynamic shear strength of the soil. In this study, the model developed by Groholoski et al.[9] , which has a curve fitting scheme that automatically corrects the reference curves for each soil based on the specified shear strength at large strains, was used.
3.1. Database of sites
S wave profiles of several type of soils were compiled in order to cover a wide range of Vs30 values, since the current PSDC use this value to characterize the seismic behavior of the soil. The 50 soil profiles have Vs30 values distributed in the range of 135 to 1020 m/s, for soil types from soft clay to hard rock, as shown in Figure 1 . From these data, the Vs30 =1020 m/s soil profile was excluded for further analysis, since it is an isolated profile.
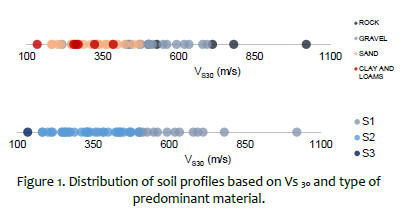
These profiles cover all types of soils, varying from rocks, gravels, sands, clays and loams, which have been visually classified in addition to the soil classification test. The dynamic properties of these soils where assumed based on the available literature.
3.2. Earthquake scenarios and acceleration time histories
A probabilistic seismic hazard assessment was conducted for 10%, 5% and 2% of exceedance probability in 50 year for a soil profile with a Vs30 of 760 m/s in downtown Lima, which is located in the Peruvian coast, corresponding to the seismic zone 4 of the PSDC. A set of three uniform hazard spectra, for 475, 1000 and 2475 years return periods events were obtained.
Then, 03 earthquake records were selected in order to perform a spectral matching process. These records correspond to the earthquakes of Lima 1974 (Mw 8.1), Atico 2001 (Mw 8.4) and Valparaíso 1995 (Mw 8.0) obtained from SENCICO database[10] , all of them are interface earthquakes, being representative for the seismicity of this region of Peru, that it is influenced by the subduction of the Nazca Plate beneath the South American Plate.
The two horizontal components of the 3 earthquake records have been matched to the uniform hazard spectra of 475, 1000 and 2475 years return period event. Subsequently, the 6 adjusted acceleration time histories were used as input earthquakes to develop the site response analyzes.
4. RESULTS OF 1D SITE RESPONSE ANALYSIS
300 one-dimensional site response analyses were performed with the DEEPSOIL 7.0 software, considering the 50 soil profiles and the 6 spectrally matched acceleration time histories, for each one of the 3 specified return period events. Firstly, the amplification factor was analyzed in order to identify trends that depends on the Vs30 value and the intensity of the ground motion. Figure 2 shows the amplification factor for periods ranging from 0.0 to 5.0 s and for three intensity levels: 475, 1000 and 2475 years of return period events. It can be seeing that the amplification factor becomes higher for intermediate to long periods depending on the soils shear strength. 3 remarkably zones are identified: For Vs30 lower than 200 m/s the amplification is higher for periods from 1.0 s to 3.0 s and a strong deamplification can be observed for periods lower than 1 s; for Vs30 values from 200 m/s to 350 m/s, the amplification is higher in the range of 0.3 s to 1.2 s. For Vs30 values from 350 m/s to 500 m/s, the amplification trends are similar than the previous range, however, the amplification factors are considerably lower. For soils with Vs30 values above 500 m/s, the amplification is low and practically uniform. These trends are slightly dependent of the ground motion intensity level, showing the incidence of the nonlinear behavior of the soils.
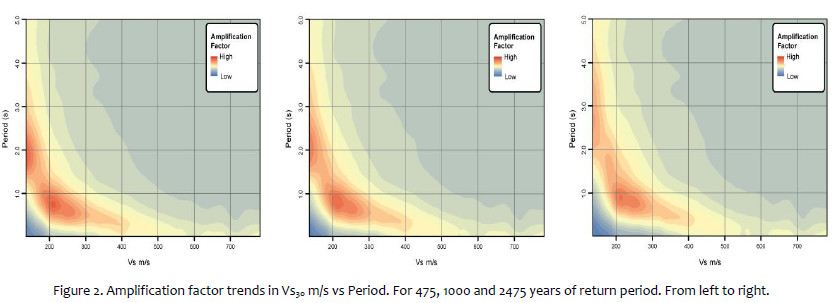
Figure 3 shows the amplification factor for each range of shear wave velocity Vs30, the solid line represents the average value and the dashed lines the ± one standard deviation, as can be expected, not only the tendencies in the amplification can be appreciated, but also the magnitude of the amplification can be evaluated.
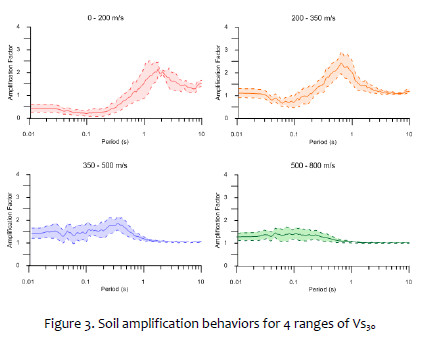
While soil with low shear wave velocities can reach values of amplification factor (AF) around 3.0, soils with higher shear wave velocities present AF of up to 2 times the original acceleration value. Although the maximum AF values for the ranges of Vs30 < 200 m/s and Vs30 between 200 – 350 m/s are 3.0, they do not have the same behavior, because the former amplifies the waves mainly in the period range of 1.0 to 2.0 s, while the second amplifies the waves mainly for periods lower than 1.0 s. It should be mentioned, as well, that for soils with Vs30 <200 m/s there is a strong deamplification in the short period range, meanwhile for Vs30 between 200 – 350 m/s, there is still an amplification for this range of periods.
For Vs30 between 350 – 500 m/s the AF trend does not have a clear peak, so the AF is slightly homogeneous around 1.60 up to a period of 0.60 s and the maximum value reach 2 at the period of 0.40 s. This trend is accentuated for Vs30 between 500 – 800m/s, where the amplification factor is constant around 1.30 for short periods and practically there is no amplification for the long period range.
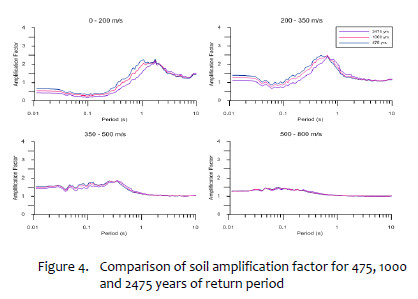
As was previously mentioned, the intensity level of the seismic acceleration has a low influence on the AF trends. It can be observed in Figure 4 , which shows a comparison of the average AF for each one of the 3 specified return period events. There can be noticed that for lower shear wave velocities while the intensity level increase, the soil tends to amplify more in the long period range and deamplify more in the short period range. This is most likely to occur due to the high nonlinearity of the soil, which is larger for soft or loose soils. On the contrary, while the shear wave velocity increases, this behavior becomes negligible, as can be appreciated in the range of 500 – 800 m/s.
5. COMPARISON WITH THE PERUVIAN SEISMIC DESIGN CODE
5.1. Comparison of the soil specific spectral shapes and the seismic design spectrum.
The spectral shapes of the seismic response analysis for different types of soils were compared with the Peruvian seismic design spectrum (Figure 5 ). The Peruvian seismic design spectrum defined for each type of soil S1 (> 500 m/s), S2 (500 to 180 m/s) and S3 (< 180 m/s) and the correspondent average response spectrum ± one standard deviation are plotted in this figure, for the three levels of the seismic events (475, 1000 and 2500 years of return period).
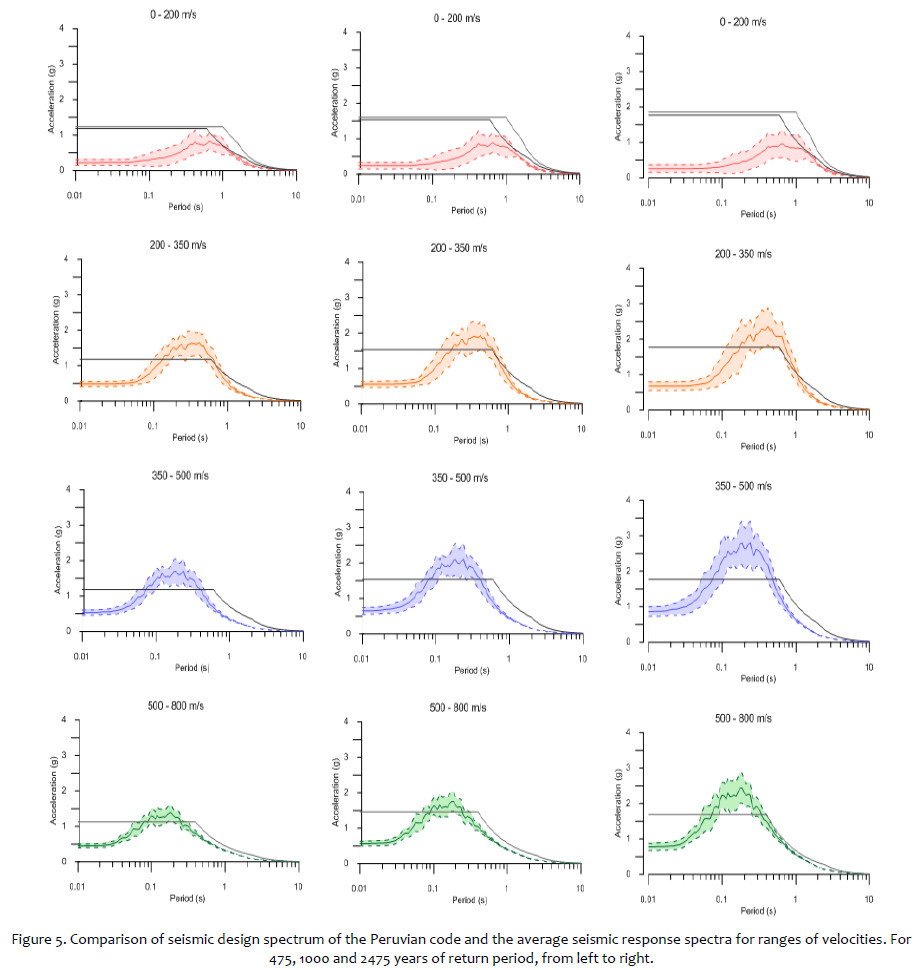
It can be noticed that for Vs30 lower than 200 m/s, the design spectrum adequately envelopes the expected response spectra, however, it is evident that at periods less than 0.2 s, the S2 and S3 soil types design spectra do not reflect the behavior of the expected response spectra, overestimating the real demands.
For Vs30 between 200 to 350 m/s, it is observed that the design spectrum underestimates the expected response spectra for periods from 0.15 s to 1.5 s and shows a premature end of the platform; however, for periods less than 0.10 s the expected spectra tend to be stable and is overestimated by the design spectrum.
Moreover, for Vs30 between 350 to 500 m/s, unlike the previous range, an underestimation of the expected response spectra for periods from 0.1 s 0.6 s is observed, and despite these soils, as the previous ones, are classified as S2 soil type by the Peruvian code, the platform zone moves horizontally to the left, in other words, the spectrum tends to move towards shorter periods as the Vs30 values increase. On the other hand, for this range of Vs30 values, a greater amplification of the response spectra can be observed at higher intensities of seismic demand.
Finally, for Vs30 values higher than 500 m/s, it is observed that the expected response spectra is slightly underestimated for periods from 0.05 s to 0.40 s for the 475 years return period event and the amplification increases for 1000 and 2475 years return period events. In addition, as in the former cases, the expected spectra are overestimated in the short period range.
5.2. Platform width of expected response spectra and TP Parameter of the design spectrum
As mentioned in the item 2, the Tp parameter, defines the upper limit of the design spectrum platform width in the Peruvian code. In order to evaluate the adequacy of this parameter for each type of soil of this code, a comparison of the platforms determined from the expected response spectra is carried out (Figure 6 ), from which it can be inferred that for S2 type soils presents an adequate correlation for soils with Vs30 > 350 m/s, however, for the case of lower accelerations there is an underestimation that is grossly accentuated as Vs30 tends to 200 m/s. For S3 type soils, even there is no much data to evaluate, the tendency shown by the results is to have wider platform than the considered by the seismic code.
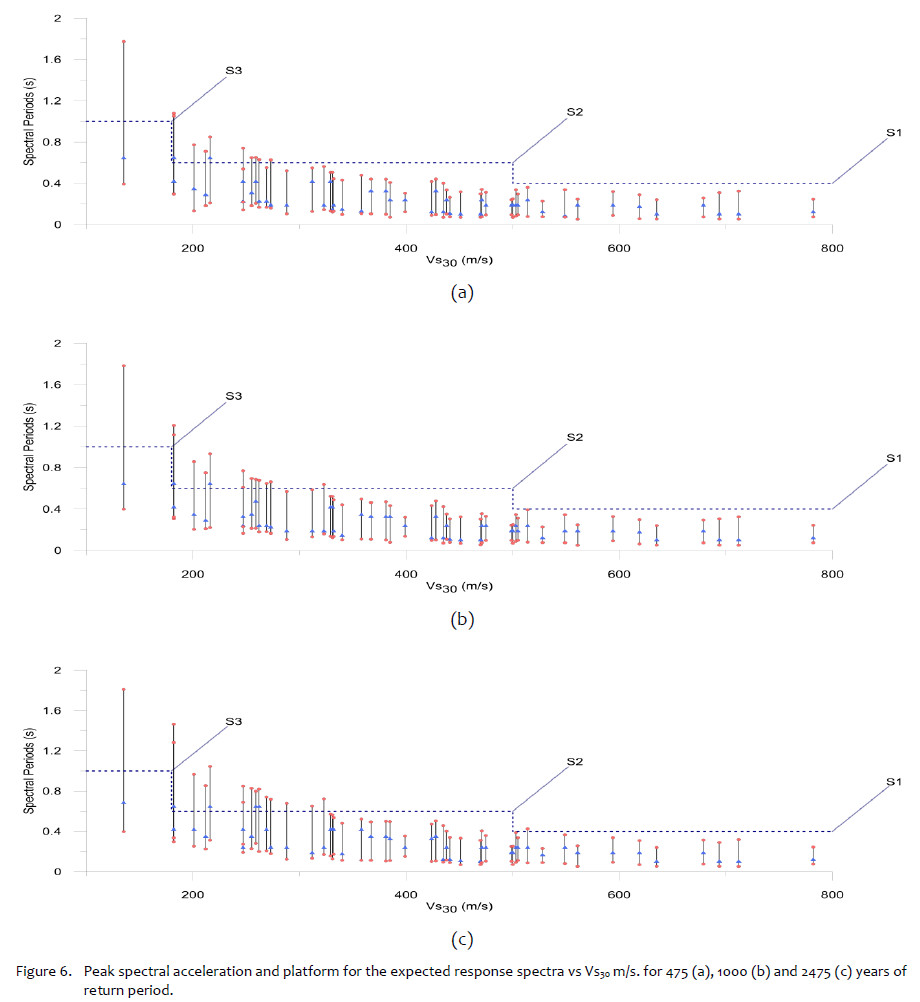
The expected response spectra platform is variable in terms of location and extension, being in the short period range and having a small width for soils with high Vs30 values, moving toward longer periods and widening for smaller shear waves velocities. It should be mentioned that the level of intensity of the seismic event has an important influence for ranges of Vs30 lower than 350 m/s, due to the fact that a higher seismic demand on soil contributes to widen the platform of the spectrum due to the high nonlinearity developed by these soft soils.
5.3.Discussion of results
Based on the aforementioned information, it is highly recommended to evaluate the possibility to adequately discretize the Vs30 range of values for the S2 and S3 soil types established by de Peruvian seismic code. S1 soil type, with Vs30 larger than 500 m/s, has an adequate seismic behavior to represent a rigid or firm soil. S2 soil type needs to be divided into two groups of soils, the first one with Vs30 from 350 to 500 m/s, and the second one with Vs30 from 200 to 350 m/s. The soft or loose soils should be classified as those with Vs30 < 200 m/s; however, since there is a small amount of data in this last range of Vs30, a further analysis is needed.
CONCLUSIONS
One-dimensional soil response analysis for several average shear wave velocity (Vs30) soil profiles were performed. Acceleration time histories for three levels of seismic intensity were considered to represent the seismic hazard of the Peruvian coast and response spectra were obtained considering non-linear soil models and the results were compared with the Peruvian code design spectrum.
The amplification factor of the response spectra depends mainly on the average shear wave velocity of the soil profile. The intensity level of the movement has a lower influence in the amplification factor, which is explained by the non-linearity of the soils.
Results of the comparison of the obtained response spectra with the Peruvian code seismic design spectra show that there is a good correspondence only for the S1 soil type, which is adequately classified as those with Vs30 larger than 500 m/s.
Larger discrepancies are found for S2 soil type classification, with Vs30 from 180 to 500 m/s. Results show that this Vs30 range needs to be divided in two groups, the first one with Vs30 from 350 to 500 m/s and the second one with Vs30 from 200 to 350 m/s. For Vs30 smaller than 200 m/s there is no much data for the analysis, however the tendency is that the soft or loose soil should be classified as those with Vs30 < 200 m/s.
Discrepancies have also been found between the Tp parameter and the width of the response spectra platforms. The design spectrum of the Peruvian seismic code overestimate and underestimate the spectral acceleration at different range of periods. Therefore, it is recommended to review the seismic code in order to define Vs30 that better represent the seismic behavior of the soft and medium dense soils.
It should be noted that this work is only a first step for the development of a site classification system that adequately includes the behavior of the different types of soil found throughout the Peruvian territory. We hope that future research can contribute or deepen what has been developed in this research.
ACKNOWLEDGEMENT
This work would not have been possible without the support of Nestor Bellido, Alyssa Bernedo and Pedro Bautista during the compilation of information and processing stage. Additionally, we thank to ZER Geosystem Peru S. A. C. consulting company, for providing us the data of soil profiles, and with the necessary resources to carry out the present research.
REFERENCES
[1] Kramer S Geotechnical Earthquake Engineering Upper Saddle River New Jersey Prentice Hall pp 254-256 [ Links ]
[2] Hashash Y M A, Musgrove M I, Harmon J A , Ilhan O, Groholski D R, Phillips C A , and Park D 2017 DEEPSOIL 7.0, User Manual. [ Links ]
[3] Stewart J P, Kwok A O, Hashash Y M A, Matasovic N, Pyke R, Wang Z, Yang Z 2008 Benchmarking of nonlinear geotechnical ground response analysis procedures. Pac Earthq Eng Res Cent [Report 2008/04] [ Links ].
[4] Hashash Y M A, Musgrove MI, Harmon JA, Ilhan O, Groholski D R, Phillips C A and Park D 2017 DEEPSOIL 7.0, User Manual. pp 50-51 [ Links ]
[5] Schnabel P B, Lysmer J and Seed H B 1972 SHAKE: A computer program for earthquake response analysis of horizontally layered sites. Report No. EERC pp 72-12, Earthquake Engineering Research Center, University of California, Berkeley, California. [ Links ]
[6] Menq FY 2003 Dynamic Properties of Sandy and Gravel Soils. Phd Disertation, University of Texas at Austin, TX , USA [ Links ]
[7] Darendelli M B 2001 Development of a new family of normalized modulus reduction and material damping curves (Phd Disertation) University of Texas at Austin [ Links ]
[8] Hashash Y M A, Musgrove M I, Harmon J A, Ilhan O, Groholski D R, Phillips C A and Park D 2017 DEEPSOIL 7.0, User Manual. pp 43 [ Links ]
[9] Groholski D R, Hashash, Y M A, Kim B, Musgrove M, Harmon J and Stewart, J P 2016 Simplified Model for Small-Strain Nonlinearity and Strength in 1D Seismic Site Response Analysis. Journal of Geotechnical and Geoenvironmental Engineering, 142(9), 04016042. doi:10.1061/(ASCE)gt.1943-5606.0001496. [ Links ]
[10] SENCICO 2013 Generation of synthetic accelerograms for the coast of Peru. Specific Interinstitutional Cooperation Agreement Between the General Institute of Research of The National University of Engineering and The National Training Service for The Construction Industry – SENCICO. [ Links ]
* Corresponding author:
Received: 29/06/2019
Accepted: 07/08/2019

