


Servicios Personalizados
Revista

Articulo
 Inglés (pdf)
 Articulo en XML
 Referencias del artículo
 Enviar articulo por email
Indicadores
-
 Citado por SciELO
Links relacionados
-
 Similares en
SciELO
Similares en
SciELO
Compartir

 Permalink
Tecnia
versión impresa ISSN 0375-7765versión On-line ISSN 2309-0413
Tecnia vol.29 no.2 Lima jul. 2019
http://dx.doi.org/10.21754/tecnia.v29i2.704
10.21754/tecnia.v29i2.704
EARTHQUAKE ENGINEERING DESIGN AND EVALUATION
Analysis of structural performance of existing RC building designated as tsunami evacuation shelter in case of earthquake-tsunami scenarios in Lima city
Julian Palacios 1*, Miguel Diaz 1, Jorge Morales 1
1 Japan-Peru Center for Earthquake Engineering Research and Disaster Mitigation, Lima, Peru.
ABSTRACT
In 1746, Lima Region was hit by a severe earthquake and a consecutive tsunami in Callao City caused 96% of casualties in the Callao City population. Under SATREPS Project [1], several studies were realized, and they concluded that a severe earthquake (Mw8.6~8.9) may occur in Lima City [2], following by tsunami which may hit a large coastal area. In that sense, harmful scenarios can occur. Based on last studies, and historical earthquake consequences in Callao City; Local government in La Punta, the most tsunami prone district in Callao, has designated 19 reinforced concrete (RC) buildings as tsunami shelters. Nevertheless, the lack of the structural vulnerability studies of these buildings in front of an earthquake and consecutive tsunami scenario, makes uncertain the good performance of the buildings. Guidelines of other countries such as Japan, The United States and Chile, are oriented to calculate the tsunami forces; nevertheless, these guidelines lack information about structural performance of buildings in front of earthquake-tsunami scenarios. This paper describes a methodology to assess the sequential action of the earthquake and the consecutive tsunami to evaluate the structural performance and the damage level to ensure the safety of buildings and their inhabitants.
Keywords: Nonlinear analysis; Capacity degradation; Hydrodynamic forces.
1. INTRODUCTION
Since the 2000s, several investigations were carried out into tsunami impact on coastal structures, given that many tsunamis occurred since then. For instance, after the 2004 Indian Ocean earthquake and tsunami, 150,000 deaths were reported in eleven countries including Indonesia, Thailand, Malaysia, India and Sri Lanka. Jain et al. [3] remark that damage in buildings and other structures during this event was mainly due to the tsunami impact.
In the United States, since 2004, the Federal Emergency Management Agency (FEMA) has developed projects to collect information about tsunami forces, in order to propose design guidelines for tsunami shelters [4]. The second edition of the guidelines was published in 2012.
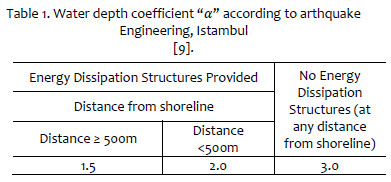
In Japan, numerous investigations were performed to establish structural requirements for design and construction of structures to withstand tsunami loads. In 2005, the Japanese Cabinet Office (JCO) established design guidelines for tsunami shelters, introducing a coefficient "𝛼" which roughly estimates the intensity of the tsunami pressures on structures. A relationship between "𝛼" and the Froud number was obtained by testing specimens in laboratory [5].
Subsequently, the reliability of this coefficient was examined by surveying the buildings affected in the 2004 Indian Ocean tsunami [6] and the inventory data from the 2011 East Japan tsunami [7]. In 2011, the Ministry of Lands, Infrastructure, Transport and Tourism of Japan (MLIT) proposed provisional guidelines for the structural design of tsunami shelters, where the coefficient "𝛼" is rectified so that it depends on the existence of energy dissipation-oriented structures and the distance between the building and the coast.
In 2014, Macabuag [8] performed a sensitivity analysis for concrete frame structures under tsunami loads based on design guidelines (arthquake Engineering, Istambul
[9 ], [4] and [10]) this study neglects the structural damage before the tsunami impact though. Finally, they conclude that Japanese guidelines arthquake Engineering, Istambul
[9 ] estimate a more conservative load pattern for tsunami design.
Despite the efforts to propose guidelines for structural analysis under tsunami loads, the structural behaviour after the earthquake effect was not analyzed yet. In that sense, the objective of the earthquake response analysis should be to estimate the stiffness and strength degradation caused by the earthquake, to ensure that this degraded structural capacity is sufficient to deal with the tsunami effects.
One of the coastal areas prone to tsunami impact is La Punta district, therefore various activities have been carried out to mitigate the tsunami damage by establishing evacuation routes, evacuation drills and developing a tsunami contingency plan. This plan includes the usage of existent buildings as tsunami shelters, those ones were selected by the Civil Defense Committee simply because of their heights (which must have at least four stories), their appearance of being well-designed, the access ease and their rooftop areas (the plan is regulated by Ordinance N ° 003-013/2010 [11]). However, assessments have not performed yet on their structural behaviour to ensure the functionality after the earthquake and the subsequent tsunami.
Based on the research and the aforementioned issues, the contribution of this research is to propose a methodology regarding the structural damage due to earthquake demands that a building withstand by performing tsunami analyses and taking into account the non-linear behaviour of the structure.
2. DESIGN STANDARDS (MLIT 2570)
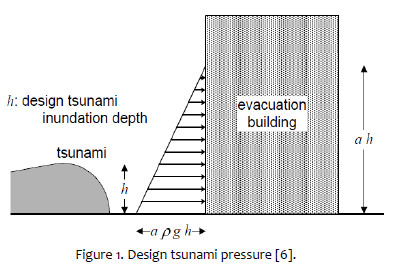
The distribution of tsunami pressure, which acts along the structure facade, is assumed to be a triangular shape whose height is equivalent to "α" times the design inundation depth "h". Note that "a*h" in equation (1) is directly related to the tsunami force, henceforth, this factor is named as Tsunami Equivalent Height (TEH). The "α" values are provided by the MLIT, as shown in Table 1 and the physical representation of this value is depicted in Figure 1. The design formula is:
px (z)= p*g*(a*h-z) (1)
where,
px(z): Tsunami wave pressure at the level of "z" from the ground.
ρ: Density of water.
α: Water depth coefficient which increase the tsunami inundation depth.
2.1. Relationship between Froud Number and coefficient "α"
To know the relationship between the tsunami wave dynamic and the coefficient "α", investigations has further developed to analyze the link between Froude number and this coefficient. The Froude number was defined in equation (2), as follows:
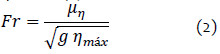
where,
Fr: Froude number.
μη: Runup velocity at the time when runup water surface elevation η takes its maximum value.
ηmáx: Maximum depth of incoming tsunami runup.
The relationship between "α" and "Fr" is shown in Figure 2 where "α" increases linearly from 1.0 to 3.0 as the "Fr" increases from 0.1 to 1.6.
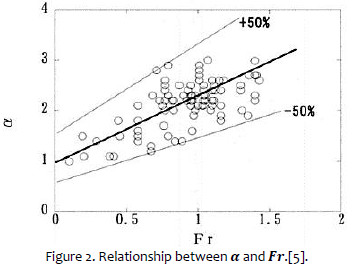
The equation (3) represents the relationship:
α=1.2*Fr+1.0 (0.1≤Fr≤1.6) (3)
3. EARTHQUAKE AND TSUNAMI LOADS
3.1. Earthquake Loads
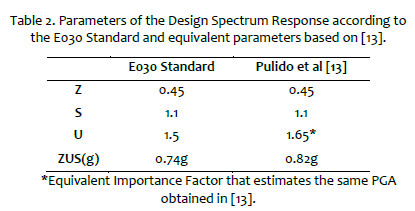
In 2015, Pulido et. al. [13] made the study of ground motions for megathrust earthquakes expected in Lima and Callao. In this study, a peak ground acceleration (PGA) of 800 cm/s2 was estimated in La Punta district, roughly 0.815g. This value corresponds to the Importance factor of 1.65, which is higher than the value set in the technical standard NTP E. 030 [12] updated in 2018 (E030) for shelter buildings. Table 2 shows the values calculated from the E030 standard and according to Pulido et al. [13] note that the acceleration difference is significant.
In order to evaluate earthquake and tsunami actions, investigations should be carried out on the relationship between the tsunamigenic earthquake scenario and the seismic demand.
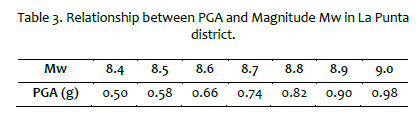
Likewise, based on Pulido et al. [13], a linear relationship was defined between the peak acceleration ground acceleration (PGA) and the moment magnitude (Mw), shown in Table 3. Defining that relationship is a way to address the data uncertainty for events larger than 8.0 Mw (Abrahamsom et al. [14]).
3.1.1. Earthquake response in La Punta district
The estimation of the target spectrum is relevant for the nonlinear dynamic analysis to generate earthquake motions whose response spectrums should be compatible with the site-specific response spectrum, the target spectrum. In that sense, the response spectrum of earthquakes records was calculated from the data of the Directorate of Hydrography and Navigation accelerograph station (DHN), which is located at 0.35km from the district of La Punta. The earthquakes magnitudes of the records vary from 3.9 to 5.5 Mw and the location of epicenters were off the coast of Callao, Ancón, Cañete, Ica, etc. (Figure 3 shows the spectrums).
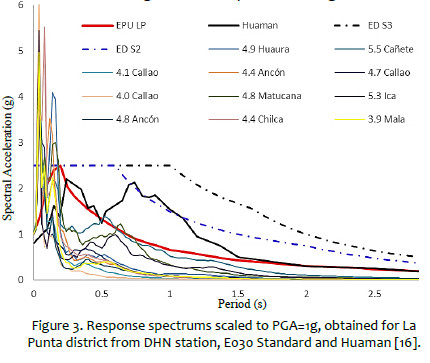
Also, the design response spectrum for soil type S2 and S3 were obtained from the Standard E030 (ED S2 and ED S3). Furthermore, the Uniform Hazard Spectrum for La Punta district (EPU LP) was downloaded from the website of the National Training Service for Construction Industry – SENCICO [15].
The EPU LP is the most suitable target spectrum relying on the results from the records of the DHN station. In contrast, the design spectrum tends to be quite conservative (see Figure 3). Therefore, the uniform hazard spectrum is defined as the target spectrum in the study area.
Nevertheless, the proper calculation of the target spectrum requires deeper analyses. In this context, Huaman [16] did a seismic microzonation of La Punta district in 1991, where the dynamic response was calculated in the Peruvian naval school, located at 0.60 km from the study building (henceforth, LP building). In this study, the response spectrum was calculated considering the stratigraphic profile of La Punta district. All the response spectrums aforementioned were scaled to PGA = 1g, to be compared among themselves.
3.1.2. Generation of Synthetic Ground Motions
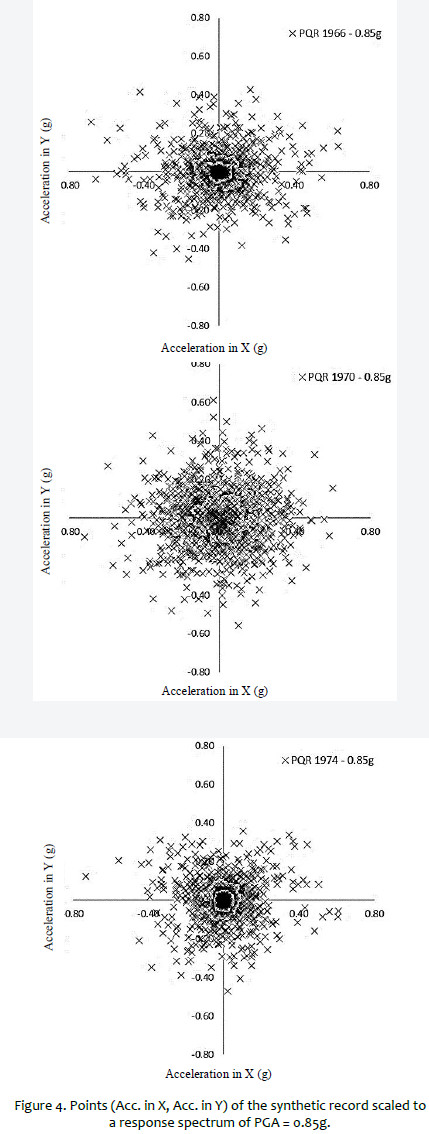
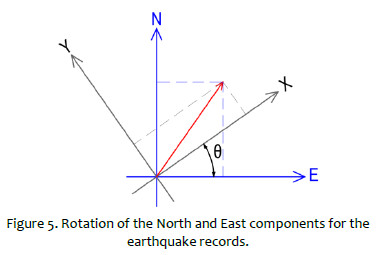
For the generation of motion records, the response spectrum of earthquake records in 1966, 1970 and 1974 at "Parque de la Reserva" accelerograph station (PQR) were calculated and then scaled to the target spectrum. To have a variety of motion intensities, target spectrums are defined in a PGA range of 0.55g - 0.85g, whose shape is shown in Figure 3. The horizontal components were scaled in orthogonal directions using the SeismoMatch software, which uses wavelet algorithms to match spectrums. In addition, an analysis of acceleration components was performed to consider the most unfavorable accelerations in the direction of analysis (Figure 5 shows the way in which the North and East components of the records were rotated), from this analysis the unfavorable angles were 92°, 19° and 88° for the records of 1966, 1970 and 1974 respectively. Figure 4 depicts the results of this analysis, the components were rotated to have the highest accelerations in the X direction, in the same way, the most unfavorable acceleration components were calculated in the Y direction. It is true that the earthquakes were not recorded in the study area, but these are valid for La Punta district due to the direction of seismic wave propagation, as the directions from the hypocenter to La Punta are almost the same for the PQR station.
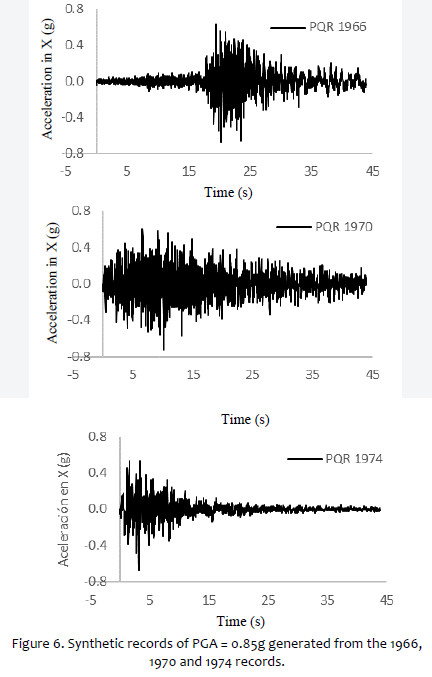
Taking into account the procedure aforementioned, 24 synthetic records were generated for nonlinear dynamic analyses. Three records from PQR station were scaled to four spectrums of different PGA values, so that 12 synthetic records are obtained, and each one is analyzed in the most unfavorable directions for X and Y. The most unfavorable acceleration components in the X direction are shown in Figure 6, for 1966, 1970 and 1974 records.
3.2. Tsunami Loads
To calculate the tsunami load, tsunami numerical simulations are carried out in La Punta district. The simulation consists of two phases: the propagation phase and the inundation phase. With the results of this simulation, tsunami loads are calculated using equation (1). In this way the most unfavorable load patterns are obtained for the tsunami-seismic analyses.
3.2.1. Tsunamigenic Scenarios
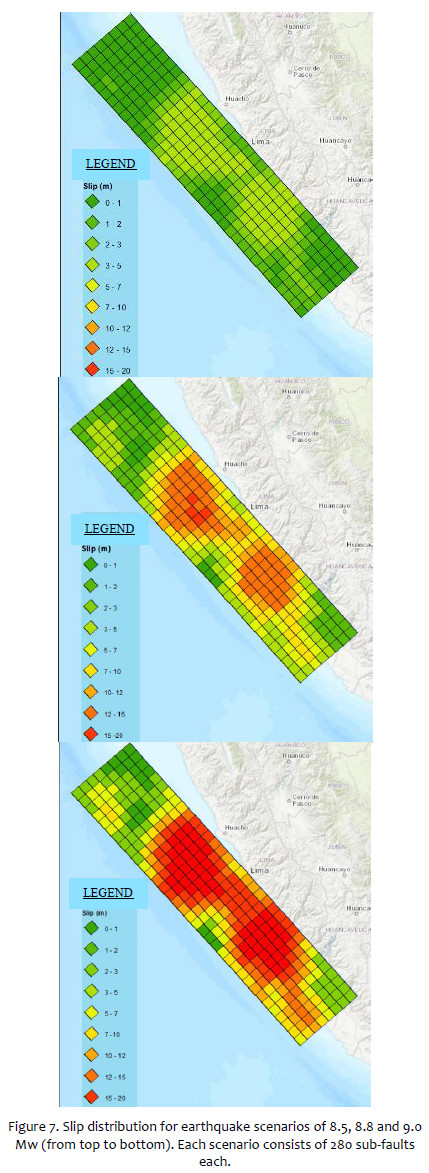
In this study, the earthquake hazard is defined by six different seismic scenarios. The first one is a model based on the distribution of interseismic coupling in the subduction zones obtained by considering a study period of 265 years since the earthquake of 1746, it also includes the measurements of the seafloor crustal deformation estimated from GPS stations and acoustic transponders, as well as information of historical earthquakes to finally propose a slip distribution, which results in a moment magnitude of 8.8 Mw [2]. The other five scenarios are calculated by scaling the slip of the previous scenario resulting in earthquakes magnitudes from 8.5 to 9.0 Mw, in order to have a range of scenarios of different intensities. Figure 7 shows the slip distributions for earthquakes scenarios of 8.5, 8.8 and 9.0 Mw.
From each tsunami scenario, the seafloor deformation is estimated by using the Okada model [17], derived from Greens function solution to the elastic half space problem. The seafloor deformation is assumed as the initial condition of the tsunami simulation.
3.2.2. Tsunami Numerical Simulation
3.2.2.1. Shallow Water Theory
In shallow water theory, there is an assumption that depth is much less than the horizontal component of the wavelength. The continuous non-linear two-dimensional shallow water equations, equations (4) to (9), are discretized by the staggered leapfrog finite difference scheme [18] using a constant grid size for each region with cartesian coordinates. The final two basic expressions of the shallow water theory are shown below.
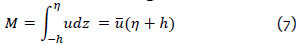
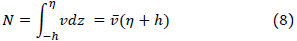
The continuity equation can be written as:
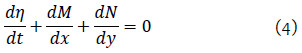
where,
η : wave amplitude
M y N: discharge fluxes in the x and y direction
t: time
The momentum equations with bottom friction terms can be written as:
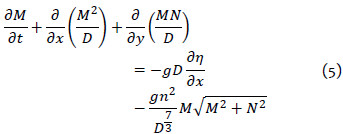
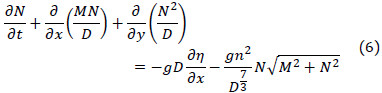

Where,
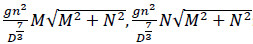 : bottom friction terms:
D : total water depth.
η : Manning roughness coefficient.
u,v : velocity vectors in x and y direction.
ū̅,v̅ : average velocity in x and y direction.
g : gravitational acceleration.
h : sea depth.
3.2.2.2.Tsunami Propagation
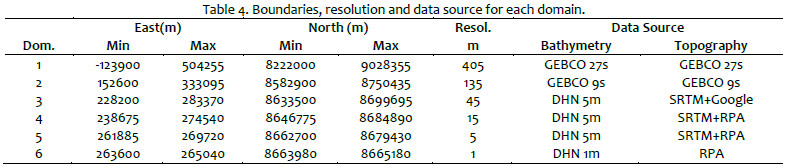
Propagation and inundation were calculated by using the TUNAMI-N2 code [19] in the Universal Transverse Mercator (UTM) coordinate system. The computational area was divided into six domains and each domain was connected by using a nested grid system. The six domains are shown in Figure 8.
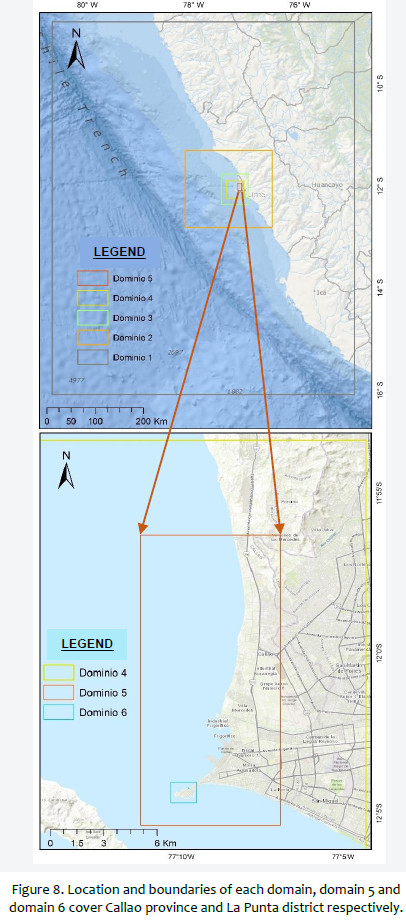
The bathymetry data was obtained from the General Bathymetry Chart of the Ocean (GEBCO), 30 arc-seconds grid data for the largest domains, and for the smallest domain the bathymetry was generated from the nautical chart of the Directorate of Hydrography and Navigation (DHN). The topography data was obtained from the Shuttle Radar Topography Mission by using an RPAs technology for La Punta district. The resolution and data source for each domain is detailed in Table 4.
Additionally, control points were placed near the LP building to know the tsunami loading effect. In the TUNAMI-N2 code, the computation time was 3 hours (180 minutes) and the time step was 0.02 seconds to check the numerical stability.
3.2.3. Tsunami Equivalent Height (TEH)
Having the velocity components, X and Y, the velocity amplitude was calculated in each control point. This velocity value was used to calculate "α" according to equation (3). The Froude number was obtained for each control point through the 180 minutes of the numerical simulation. Also, the value of "α=2" according to MLIT (Table 1) was regarded because the building is located in La Punta, where there are natural structures that dissipate energy (San Lorenzo Island and a breakwater).
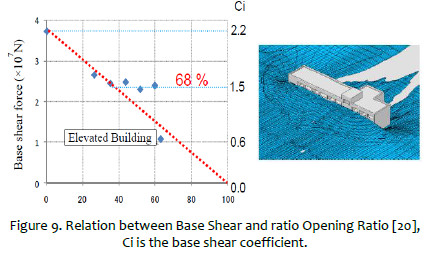
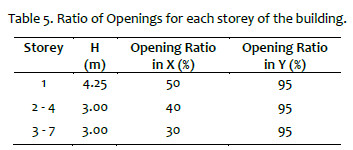
Another coefficient that must be carefully calculated to estimate the tsunami force in a building is the ratio of openings, in that sense, Okuda and Sakata [20] studied several structures by varying the ratio of openings and they concluded that increasing the ratio of openings in the building the base shear force decreases proportionally, however, if the ratio of openings is greater than 32% the force remains as if the ratio of openings was 32% (see Figure 9). Table 5 shows the ratio of opening for each storey of the building.
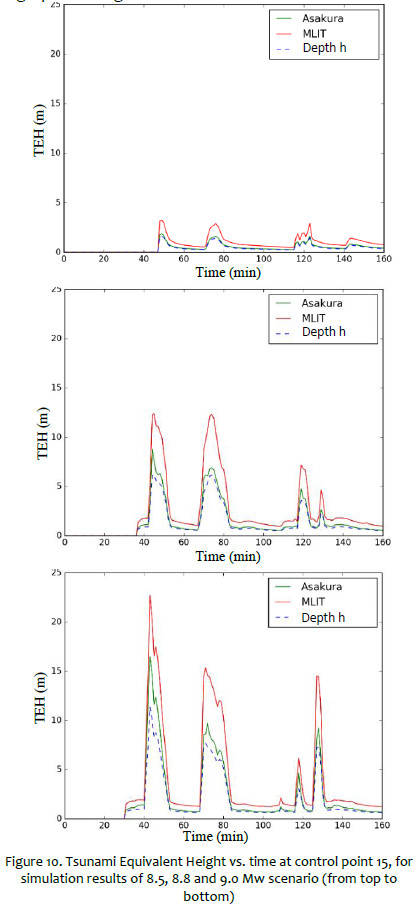
The TEH was calculated considering the coefficient "α" for both MLIT guidelines and Asakura et al. [5] in this way the maximum coefficient "𝑎" was determined. In Figure 10, the equivalent tsunami height is shown for scenarios of 8.5, 8.8 and 9.0 Mw, these heights correspond to control point 15, which recorded the major heights.
The maximum TEH in the LP building was calculated from each tsunami numerical simulation, the TEH was associated with the PGA acceleration, defined in Table 3, the relation between PGA and the TEH height is graphed in Figure 11.
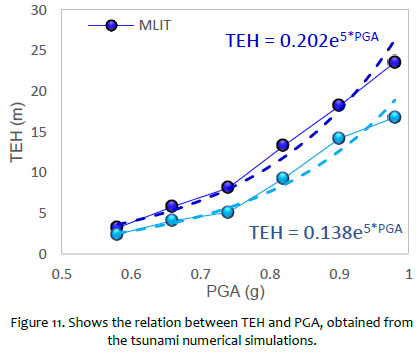
The relation obtained between these parameters is an exponential function and it is defined in equation (10):
TEH (m) = Ch *e5*PGA, 0.58g < PGA <0.98g (10)
CH depends on the choice of the coefficient "α", which can be either obtained from MLIT or or [5].
3.2.4. Tsunami Forces
The tsunami wave force can be calculated by integrating its acting pressure shown in Equation (11) considering the pressure-exposed surface area and the pressure distribution along the height of the building. Equation (11) shows that integration:
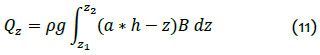
where,
Qz: design tsunami force.
B: width of pressure-exposed surface.
Z1: minimum height of pressure-exposed surface.
Z2: maximum height of pressure-exposed surface.
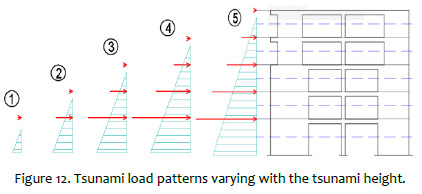
With the forces calculated in each direction, the load patterns are defined depending on the height of the tsunami, as Figure 12 depicts, so that the static nonlinear analysis was performed considering the variation of the tsunami height.
4. STRUCTURAL ANALYSIS
4.1. Description of LP building
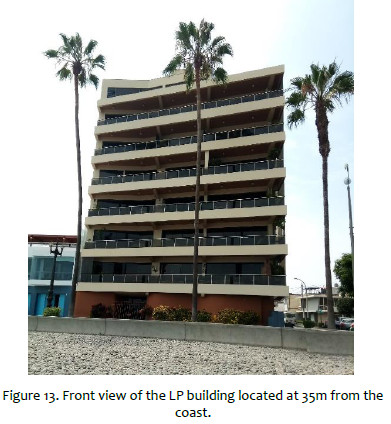
The study model is a seven-storey building, one of the 19 buildings selected as a tsunami shelter in La Punta district and the LP building is located at 35 m from the coast, as Figure 13 shows.
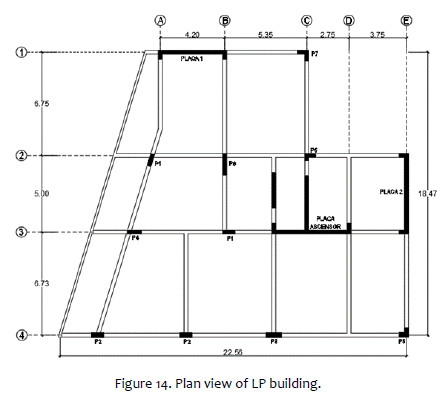
The model building type is a building of concrete shear walls in both directions. The dimensions are 18.5m wide and 22.6m long, with a constant interstory height of 3m except for the first level, which is 4.25m high. Figure 14 depicts these features.
The measurement of environmental vibration was taken to estimate the fundamental natural periods of the structure. The structural vibration was recorded at three points on the roof of the LP building and two predominant periods were obtained in the horizontal directions, 0.372s in the X direction and 0.421s in the Y direction. These predominant periods helped to verify the periods of the building's numerical model.
4.2. Numerical Modeling of the structure
In this research, Perform 3D Software [22] was used to perform the non-linear dynamic analysis considering the geometric non-linearity, the inelastic behavior of the materials and the energy degradation factors.
4.2.1. Material Properties
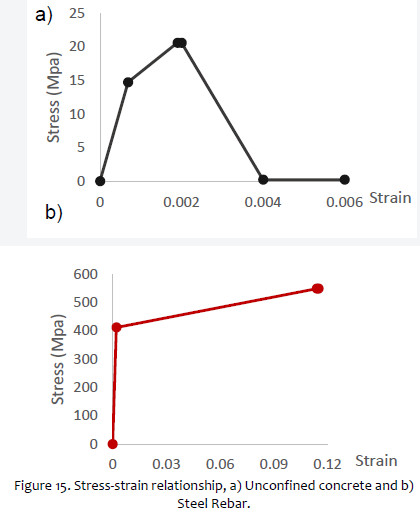
For the constitutive relationship of steel bars, a bilinear model without strength loss was considered in tension and compression. The behavior of the steel rebar (fy = 4200kg/cm2) was taken into account because it is indicated in the building plans, however, the yield and ultimate stress were reduced to consider the degradation of the strength due to several factors such as corrosion, the presence of cracks or inadequate concrete cover, which was lengthened for 39 years in the building since its construction.
On the other hand, the behavior of the concrete was modeled as unconfined concrete because the stirrup spacing in the reinforced concrete elements do not ensure an adequate confinement. The f'c considered is 210kg/cm2 and a trilinear model with strength loss was considered neglecting the traction collaboration of concrete. The relationship used for concrete and rebar is shown in Figure 15.
4.2.2. Cyclic Degradation
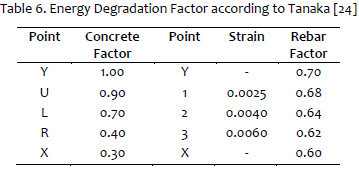
Under cyclic loading, most structural components will withstand stiffness and strength degradation. As a general rule the degradation will be progressive. As the number of cycle increases, the effective force-deformation relationship will degrade, with smaller stiffness, strength, energy dissipation and/or ductility. To consider this, it is introduced the Energy Degradation Factor for inelastic components, which is the ratio between the area of the degraded hysteresis loop and the area of the non-degraded loop (Computers and Structures, Inc. [22]). For a typical component, this area ratio is 1.0 for small deformation cycles (no degradation) and gets progressively smaller as the maximum deformation increases (increasing degradation). The degradation factor is shown in Table 6.
It should be noted that in Perform 3D the effect of "pinching", which consists of the recovery of the stiffness from tension to compression and vice versa, cannot be considered in the elements. Nevertheless, the overall behavior and the maximum lateral loads and interstory drifts are adequately estimated [23].
4.2.3. Fiber Model
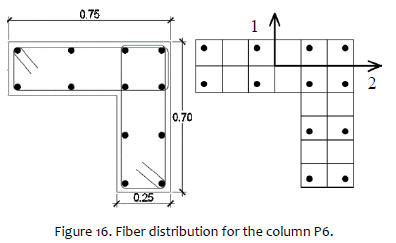
The fiber distribution in beam and column sections was configured in the software, which allows up to 12 fibers per section for a beam type element and 60 fibers for a column type element. For example, the column P6 was partitioned into 32 fibers (20 concrete and 12 rebar fibers). Figure 16 shows the fiber distribution of column P6.
4.2.4. Rayleigh Damping
This type of damping is widely used and stablish a linear relationship with the mass and stiffness matrix as shown in equation (12), see that it is a particular case of the damping proposed by Caughey and Kelly [21].
C =ar*m+βr*k (12)
where,
c: Damping matrix.
m: Mass Matrix.
k: Stiffness Matrix.
αr: Mass-related Rayleigh damping coefficient.
βr: Stiffness-related Rayleigh damping coefficient.
4.2.5. Nonlinear Static Analysis Settings
For the earthquake analysis, the building was assigned load patterns proportional to the product of the mass and modal displacement. This pattern is characterized by forces increasing with height. For the tsunami analysis, load patterns were assigned that decrease in height, unlike the pattern by earthquake load. Tsunami load patterns decrease with height, which induce a brittle failure in the structure. Tsunami loads were estimated using the procedures described in the previous sections.
Nonlinear Dynamic Analysis Settings
Rayleigh formulation was used to calculate the damping, considering 5% damping for the first two modes. The analysis time varies depending on the earthquake record and the analysis time step is 0.02s. The time history analysis is carried out for 24 synthetic records.
5. RESULTS AND DISCUSSION
5.1. Results of Seismic Analysis
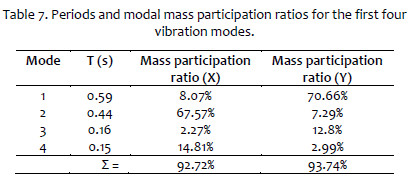
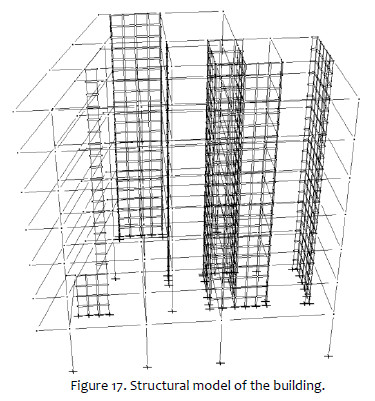
The building was modeled taking into account the plans and the predominant periods obtained from the measurement of building environmental vibrations, however, it has been considered a model where the masonry walls do not contribute to the overall structural stiffness for the non-linear analysis. Therefore, the periods of the model are reasonably greater than those obtained in the measurement of vibrations. The modal information of the non-linear model is shown in Table 7 and the structural model is depicted in Figure 17.
5.1.1. Nonlinear Dynamic Analysis (NDA)
In this section, numerical simulations were performed to know the structural response under 24 synthetic records. From the first six ones (analyzed under PGA = 0.55g), 3 of them were analyzed (related to 1966, 1970 and 1974 earthquake), in a way that the accelerations at the building base in the direction X are the most unfavorable and the other three most unfavorable in the Y direction.
For these six analyses, the maximum interstory drifts in Y are plotted in Figure 18. According to this figure, the events that cause higher drifts (in case of PGA = 0.55g) are: 1974Y (analysis made under a synthetic record obtained from the 1974 earthquake and analyzed in a way that the accelerations in the base are unfavorable in Y) and 1970Y. On the other hand, the event of 1974Y originates the highest drifts in the Y direction (when PGA=0.65g or 0.75g), however, when PGA = 0.85g, the highest drifts are obtained by the 1970Y event. From the dynamic analysis, it can be noted that while some records generate higher drifts on the upper interstories, others generate higher drifts on the lower interstories. On average, the interstories that withstand the highest drifts are the second and the third interstory.
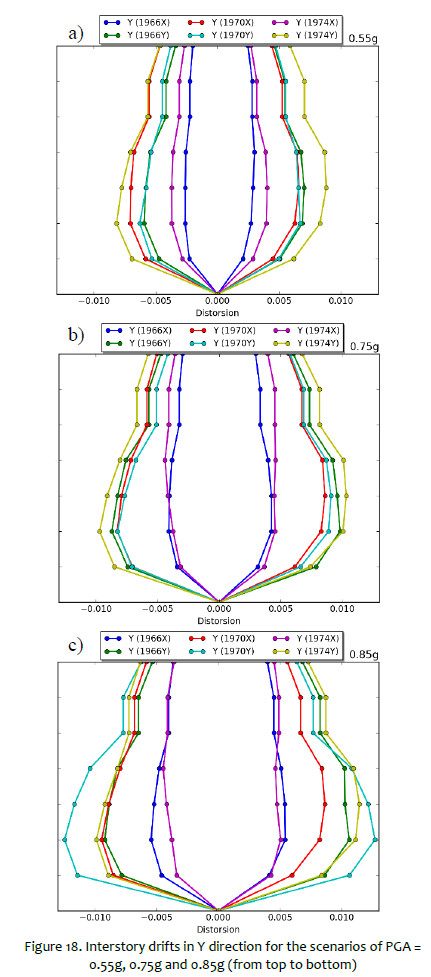
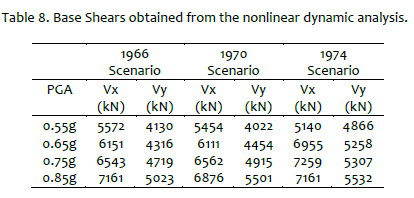
Synthetic records from the 1974 earthquake throws the maximum drifts on average. As the drifts, the base shear was obtained from the simulations, the maximum base shear that the structure withstand in the X direction is 6927 kN and in the Y direction is 5182 kN. The maximum shear obtained in each analysis is shown in Table 8. Although the highest drifts obtained by the 1970 event, when PGA = 0.85g, the maximum shear of this event is not the highest. Note that this analysis was carried out to evaluate meticulously the structural response of the irregular structure, where it is required to know the structural response in detail. In the following section, the nonlinear static analysis is performed to be compared with the results of the dynamic analysis.
5.1.2. Nonlinear static analysis (NSA)
The analysis was performed for the first and second mode, which turned out to have higher mass participation in the Y direction and in the X direction, respectively. After having carried out this analysis, the structure capacity curve was obtained, however, drifts and shears for each interstory were revised to analyze the interstories displacements, because of the drifts of the general capacity curve of the building could underestimate the drifts of some interstory, these curves are plotted in Figure 19.
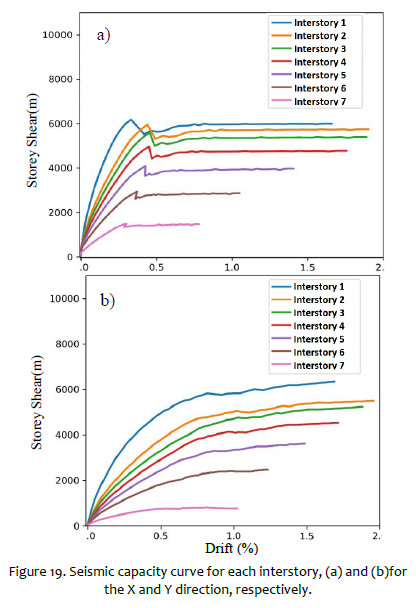
Overall, brittle behaviour can be observed in the X direction, when drift is 0.3%, unlike the analysis in the Y direction, which has more ductile behaviour. The brittle behaviour is produced by the rotation effects that cause the failure of concrete frames in the X direction. Note that the capacity curve would not be the same in case of the tsunami analysis because the force distribution in the load pattern is different.
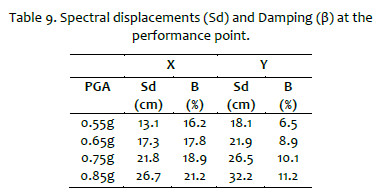
Having calculated the capacity curve of the structure, the seismic demand is defined by the spectrum of design according to the formulations provided in E030 Standard, in a way that, Z*U*S values results in 0.55g, 0.65g, 0.75 g and 0.85g corresponding to the PGA values of the NDA. Subsequently, the seismic performance point was estimated using the capacity spectrum methodology [25] considering a Type C structure, which has a poor hysteretic behavior because the structure does not have a rebar distribution that ensures a good hysteretic behavior, spectral displacements and damping at the performance points are shown in Table 9.
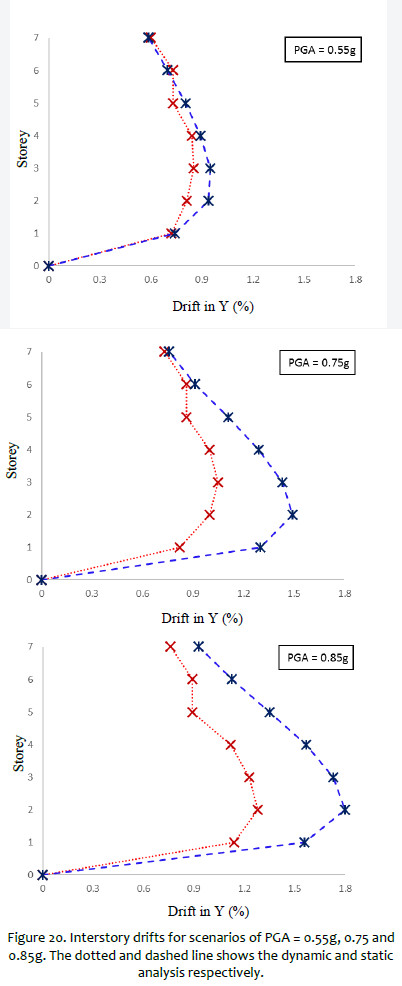
In general terms, it can be said that the nonlinear static analysis results in higher interstory drifts than the dynamic analysis, however, for the interstories 6 and 7, in case of PGA= 0.55g and 0.65g, seismic actions are underestimated.
The maximum drift for each interstory can be observed in Figure 20, and the highest drift among all the interstories for the dynamic analysis is 1.25% and for the static drift is 1.76%, this drift exceeds 29% on the dynamic analysis. For practical purposes, the results of the static analysis will be used in the following methodology, however, if the building irregularities generate higher drifts, the results of the dynamic analysis must be considered.
5.2 Results of Tsunami Analysis
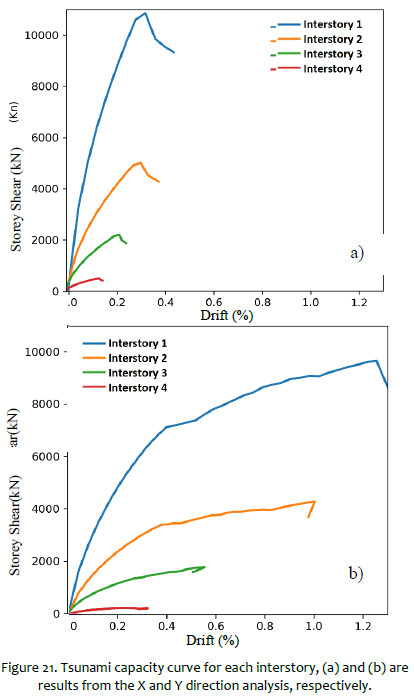
This analysis was performed by using load patterns that increase with height and is carried out by a force-controlled analysis, this means that the analysis will end at a maximum force. Unlike the seismic analysis, there will be a higher influence of the shear failure. This means that it will have higher strength but a lower ductility, due to the load pattern distribution.
As expected, the tsunami capacity curves obtained have higher strength and lower ductility compared to the seismic capacity curve. Figure 21 shows the tsunami capacity curves for each interstory. However, this curve was obtained neglecting the degradation of the structural capacity caused by the seismic event, in the following section this effect will be evaluated.
5.3 Structural Performance Assessment
Having calculated the seismic performance point, degradation parameters were obtained relying on the degrading model of Takeda, Sozen and Nielsen [26]. Additionally, the strength degradation was considered using formulations from Wang and Shah [27]. These parameters were used to estimate the damage after the seismic event and modify the structural tsunami capacity of the building. Also, the Wang and Shah equations were used to degrade the strength of the tsunami capacity curve due to the cyclic tsunami loading according to the tsunami numerical simulation.
The methodology is shown in Figure 22, here seven tsunamigenic earthquake events can be observed, where event No. 1 is a severe earthquake and gradually increases until event No. 7. The methodology objective is to evaluate a building that was not designed as a tsunami shelter but proposed as a vertical evacuation.
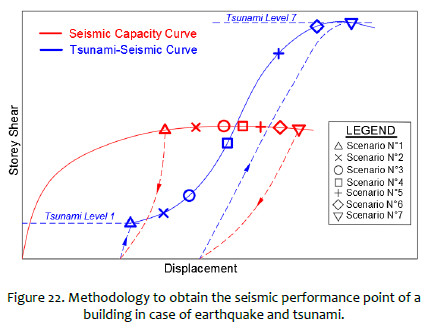
The procedure proposed in this research starts with the seismic analysis which starts at point "O" (see Figure 22) then under the earthquake loading the seismic performance point is reached (for instance, the red symbol Δ) at this point, the degradation parameters are calculated and then the base shear is unloaded until zero (the residual displacement is represented by the distance between this position and the point O). In these conditions, the tsunami waves will act and it is necessary to analyze the behavior of this effect, so the degraded tsunami capacity curve is used. It should be noted that the maximum tsunami force is related to the event intensity and the earthquake-tsunami performance point (for instance, the blue symbol Δ) is obtained by locating this force in the tsunami capacity curve.
For instance, in event No. 4, the displacements caused by the tsunami are more significant than those caused by the earthquake and at this point, the tsunami loading predominates.
To carry out a simpler analysis, the capacity curves are easily represented using trilinear curves, taking into account the conservation of the energy by comparing areas under curves. Figure 23 shows trilinear curves for earthquake and tsunami capacity curves. Furthermore, the tsunami curve was modified by applying the degradation parameters (the black curve labeled as "CCTT degraded").
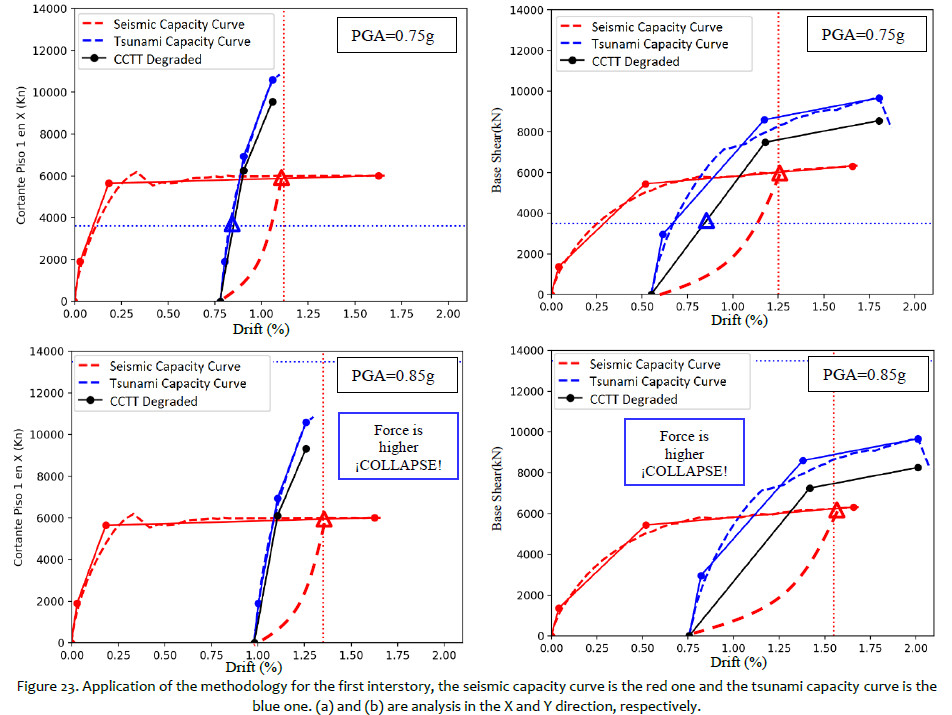
In Figure 23, the upper graphs show the results corresponding to the first interstory when PGA = 0.75g and the lower ones show the results when PGA = 0.85g. In this last event, the tsunami demand is higher than the capacity curve and there is no intersection point, this fact means that the tsunami demand exceeds the structural capacity. The building suddenly collapses for the event 0.85g due to the lack of openings to decrease the tsunami force. Figure 23 shows that tsunami drifts are more significant than seismic drifts for events of PGA greater than 0.75g.
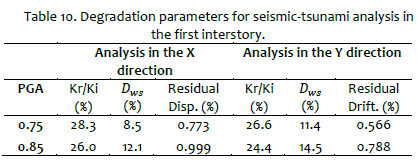
The main degradation parameters estimated in the application of the methodology for the first interstory under the events of 0.75g and 0.85g are shown in these parameters are: the ratio of the unloading stiffness and the initial stiffness (Kr/Ki), the strength degradation coefficient (Dws) and the residual drift after the seismic event.
Table 10 , these parameters are: the ratio of the unloading stiffness and the initial stiffness (Kr/Ki), the strength degradation coefficient (Dws) and the residual drift after the seismic event.
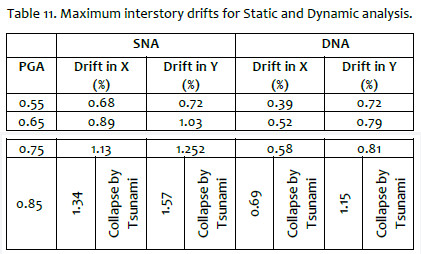
After the application of the methodology, the maximum drifts were obtained in each interstory, showing that the most affected interstory is the first one because the tsunami loads are more concentrated at the building base, those drifts are shown in Table 11. Likewise, when PGA = 0.85g a significant drift is obtained by the earthquake event but the effects of the tsunami make the structure collapse.
5.4 Level of building damage
For the estimation of structural damage, the Hazus-MH 2.1 methodology [28] was used as a reference, which defines the LP building as a C2M type structure. For a moderate-code seismic design level, assumed for the study model because for this requirement the yield capacity (dy=2.0cm y αy:=0.25g) and the ultimate capacity (du= 26.3cm y αu=0.625g) is similar to what was obtained in the capacity spectrum curve for the numerical model.
From Table 11 and the damage states [25] Table 12 can be obtained showing the damage status for each scenario, this table is an essential result obtained in this investigation.
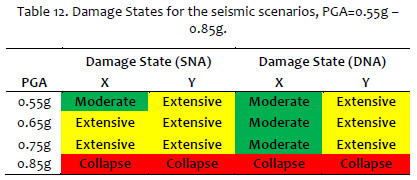
Throughout the damage state estimations and recommendations in [25], the seismic performance objective of the building is a basic one, and it does not have an adequate structural configuration to perform as a tsunami shelter which can withstand an earthquake and the actions of the subsequent tsunami.
CONCLUSIONS
- The building under studied was analyzed under four seismic scenarios, for scenarios greater than PGA=0.75g (related to a scenario of magnitude 8.7 Mw) the tsunami damage is greater than the seismic damage. The tsunami effects make the structural collapse, this is mainly due to the lack of openings to attenuate the tsunami force.
- The tsunami demand at the building was calculated from the tsunami numerical simulations of six earthquake scenarios from 8.5 to 9.0 Mw, obtaining the highest tsunami waves, the first wave arrival time and the tsunami speeds.
- The tsunami equivalent height was estimated using the coefficient proposed in MLIT 2570 and the values obtained from the tsunami simulation. Greater tsunami forces were obtained using the coefficients proposed by Japanese guidelines.
- The seismic performance points were obtained according to the capacity spectrum method, considering a type C structure, every seismic scenario causes extensive structural damage that makes the vertical evacuation extremely tough because non-structural elements would block the evacuation routes.
- Static and dynamic nonlinear analyses were carried out to evaluate a building designated as a tsunami shelter. Overall, the drifts obtained from the static analysis tends to be greater than those from the dynamic analysis.
- A methodology for structural evaluation of buildings subjected to the sequential action of earthquake and tsunami is presented. The importance of this methodology is that it can estimate the scenario in which the structure would have greater damage by tsunami action than earthquake motion.
ACKNOWLEDGEMENT
This study was supported by the Vice-Rector for Research organization of National University of Engineering. The support is gratefully acknowledged.
REFERENCES
[1] Yamazaki F, Zavala C, Nakai S, Koshimura S, Saito T and Midorikawa S 2010 Enhancement of earthquake and tsunami disaster mitigation technology in Peru: A SATREPS project [ Links ]
[2] Pulido N, Tavera H, Perfettini H, Chlieh M, Aquilar Z, Aoi S, Nakai S and Yamazaki F 2011 Estimation of Slip Scenarios for Megathrust Earthquakes: A case study for Peru, The 4th IASPEI/IAEE International Symposium, Santa Barbara [ Links ]
[3] Jain S, Murty C, Rai D, Malik J, Sheth A, and Jaiswal A 2005 Effects of M9 Sumatra Earthquake and Tsunami of 26 December 2004, Current Science, 88(3), pp 357-359, Bengaluru [ Links ]
[4] FEMA P646 2008 Guidelines for Design of Structure for Vertical Evacuation from Tsunamis, 2008 [ Links ]
[5] Asakura R, Iwase K, Tsuyoshi I, Takao M, Kaneto T, Fujii N, and Ohmori M 2003 The Tsunami Wave Force Acting on Land Structures, Coastal Engineering 2002: pp. 1191-1202, Gales, Reino Unido [ Links ]
[6] Nakano Y 2008 Design load evaluation for tsunami shelters based on damage observations after Indian Ocean Tsunami disaster due to the 2004 Sumatra earthquake, The 14th World Conference on Earthquake Engineering, Beijing [ Links ]
[7] Asai T, Nakano and Y Tateno T 2012 Tsunami load evaluation based on damage observation after the 2011 Great East Japan Earthquake, Bulletin of ERS, No. 45, Tokio [ Links ]
[8] Macabuag J, Rossetto T and Lloyd T 2014 Sensitivity analyses of a framed structure under several tsunami design-guidance loading regimes, 2nd European Conference on Earthquake Engineering, Istambul [ Links ]
[9] MLIT 2570 Acerca de los conocimientos adicionales relacionados con el método de diseño, etc. de un edificio seguro para resistencia estructural contra tsunamis (en japonés), Ministry of Land, Infraestructure, Transport and Tourism, Tokyo [ Links ]
[10] ASCE/SEI 7 2017 Minimun Design Loads For Buildings and Other Structures, Virginia [ Links ]
[11] Ordenanza N° 003-013/2010 2010 Norma que regula el acceso a los edificios que sirvan como refugios de emergencia ante la amenaza de tsunami en el distrito de La Punta, Lima [ Links ]
[12] Norma Técnica E-030 2018 Diseño Sismorresistente, Reglamento Nacional de Edificaciones, Lima [ Links ]
[13] Pulido N, Aquilar Z, Tavera H, Chlieh M, Calderón D, Sekiguchi T, Nakai S and Yamazaki F 2015 Scenario Source Models and Strong Ground Motion for Future Megaearthquakes: Application to Lima, Central Peru, Bulletin of the Seismological Society of America, California [ Links ]
[14] Abrahamsom N, Gregor N and Addo K 2016 BC Hydro Ground Motion Prediction Equations for Subduction Earthquakes, Earthquake Spectra Journal, California [ Links ]
[15] Servicio Nacional de Capacitación para la Industria de la Construcción – SENCICO 2016 Actualización eel Programa de Cómputo Orientado a la Determinación del Peligro Sísmico en el País, Lima [ Links ]
[16] Huamán C 1991 Microzonificación Sísmica de La punta y El Callao, Universidad Nacional de Ingeniería, Lima [ Links ]
[17] Okada, Y. Surface Deformation due to Shear and Tensile Faults in a Half-Space, Bulletin of the Seismological Society of America, 75, 1135-1154, 1985. [ Links ]
[18] Imamura F, Synolakis C, Trrov V and Lee S 1995 Field Survey of the 1994 Mindoro Island, Philippines Tsunami, Pure Appl. Geophys. 144, 875-890 [ Links ]
[19] Koshimura, S 2009 TUNAMI Code, Tohoku University Numerical Analysis Model for Investigation of Tsunamis, JST-JICA Perú Project, Sendai [ Links ]
[20] Okuda Y and Sakata M 2008 Simulation of Tsunami on a Building part 2: Effects of Openings of a Building, Summaries of technical papers of Annual Meeting, Architectural Institute of Japan, B-1, Structures I, pp 77-78 [ Links ]
[21] Caughey T and Kelly M 1965 Classical normal modes in damped linear dynamic systems, Journal of Engineering Mechanics, Virginia [ Links ]
[22] Computers and Structures, Inc. – CSI 2011 "CSI User Guide PERFORM-3D", California [ Links ]
[23] Burak B and Unal M 2012 Analytical Evaluation of the Cyclic Response of Reinforced Concrete Beam-to-Column Connections, The 15th World Conference on Earthquake Engineering, Lisboa [ Links ]
[24] Tanaka H 1990 Effect of Lateral Confining Reinforcement on the Ductile Behaviour of Reinforced Concrete Columns, Ph.D. Dissertation, Canterbury [ Links ]
[25] Applied Technology Council, ATC-40 1996 Seismic Evaluation and Retrofit of Concrete Buildings, California [ Links ]
[26] Takeda T, Sozen M and Nielsen N 1970 Reinforced Concrete Response to Simulated Earthquakes, Journal of the Structural Division, Nueva York [ Links ]
[27] Wang M and Shah S 1987 Reinforced Concrete Hysteresis Model Based on the Damage Concept, Earthquake Engineering and Structural Dynamics, Tokyo [ Links ]
[28] HAZUS-MH 2.1 2012 Earthquake Model Technical Manual, Earthquake Model Development Oversight Committee, FEMA [ Links ]
* Corresponding author:
Received: 29/06/2019
Accepted: 07/08/2019

