


Servicios Personalizados
Revista

Articulo
 Inglés (pdf)
 Articulo en XML
 Referencias del artículo
 Enviar articulo por email
Indicadores
-
 Citado por SciELO
Links relacionados
-
 Similares en
SciELO
Similares en
SciELO
Compartir

 Permalink
Tecnia
versión impresa ISSN 0375-7765versión On-line ISSN 2309-0413
Tecnia vol.29 no.2 Lima jul. 2019
http://dx.doi.org/10.21754/tecnia.v29i2.699
10.21754/tecnia.v29i2.699
EVALUACIÓN DE RIESGOS DE MÚLTIPLES RIESGOS EN ÁREAS RURALES Y URBANAS
Analytical fragility assessment of structures subjected to earthquake and tsunami loads: a case study on the colombian pacific coast
Miguel Rivas1[1], Patricia Luna 1, Juan Lizarazo 1
1 Engineering Faculty, Universidad Nacional de Colombia, Bogotá, Colombia
ABSTRACT
This paper presents a procedure for the fragility assessment of structures subjected to earthquake and tsunami loads, by using the inelastic displacement accumulation as a measure of damage. The proposed methodology considers a non-linear static analysis (pushover) for the earthquake case, and a non-linear static load for the tsunami case, taking as a starting point the final condition of the structure after the occurrence of an earthquake. However, since the impulse force is the critical component of the tsunami load, a simplified approach in terms of the flow depth is used to estimate the total tsunami load. By combining the earthquake effect with the tsunami hazard, a function relating the earthquake spectral acceleration, the tsunami flow depth and the lateral drift is obtained. Finally, a case study of the typical timber structures located in the municipality of San Andrés de Tumaco, at the Colombian Pacific Coast, is analyzed in order to assess de proposed methodology. The fragility curves obtained allows to determine a new approach to the Multi-hazard risk assessment in areas prone to the occurrence of earthquakes and tsunamis.
Keywords: Structural Fragility, Multi-hazard risk assessment, Earthquake, Tsunami, Analytical fragility curves.
1. INTRODUCTION
Structural fragility curves have been widely studied for earthquake hazard [1]. However, the inclusion of load combinations associated with different natural phenomena [2], has allowed the assessment of structural fragility curves from tsunami [3] and combined events [4]. Thus, it is possible to find approximations from multivariate models [5], relationships among different natural phenomena [6], and relate physical losses to economic losses [7]. Although not all tsunamis result from earthquakes [8], in areas where both hazards are present, it is necessary to be able to assess the structural fragility due to both, rather than considering each phenomenon independently from one another.
In this paper, an analytical methodology is proposed to obtain structural fragility curves considering the effects from a medium-intensity earthquake, as well as different wave heights from tsunami. As a result, it was found out that tsunami fragility curves that do not include earthquake effects, tend to overestimate the capacity of the structure by not considering the loss of rigidity of the elements due to the earthquake.
2. METHODOLOGY
The proposed methodology consisted of performing a Pushover static analysis until reaching the maximum displacement due to the earthquake acceleration. Once the final state of the structure has been obtained, the tsunami load is applied on the structure taking as a starting point the structure deformed by the earthquake.
First, the inelastic properties of the members of the structure are defined, in this case, the dissipation capacity in the inelastic range of the joints. Then, a Pushover analysis is performed representing the earthquake effect on the structure. The deformed structure is re-analyzed with a tsunami load and the accumulated displacement is taken as a measure of the damage to the structure. Subsequently, the procedure is repeated varying the acceleration produced by the quake and the height of the tsunami wave. In this way, a set of values is obtained that involve the occurrence of an earthquake of medium intensity and the tsunami.
2.1 Assumptions
For this study, the following assumptions were taken into account:
-The tsunami does not occur immediately after the earthquake, for this reason, the displacement of the structure is used as a measure of the damage.
-The damage is determined by accumulating the displacement of the structure due to the effect from the two loads.
-If the structure remains elastic after the earthquake load, the tsunami load accumulates the elastic displacement.
-If the structure reaches 100% damage after the earthquake load, this indicates that the damage from the tsunami effect is also 100%.
-The parameters of the plastic hinges are determined according to the acceptance criteria described in FEMA-356.
2.2 Earthquake and tsunami loads
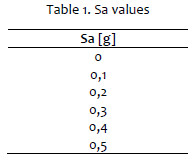
The earthquake is applied to the structure using the equivalent horizontal force method, a control node is selected and displacements are obtained for each acceleration increase (Table 1). The displacements obtained become the control parameter of the pushover analysis.
The tsunami load (FTSU) is calculated by taking the flow depth as the input. Bandara & Dias demonstrated that the impulse force is the critical component of the tsunami load [9], therefore, in cases where the complete information is not available to calculate the tsunami components under the ASCE-7 guide [10], it is possible to use an approximate formula to calculate the tsunami load in terms of the structure members width (Eq. 1).
FTSU = 2.5 pgh2w (1)
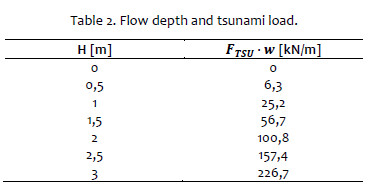
In Eq. 1 ρ is the water density, g the gravity acceleration, h the wave height and w the width of the structural member considered. In the case of columns and walls, the width w is considered as the dimension of the element in the same orientation of the tsunami load. Considering a value of ocean water density of 1027 kg/m3, Table 2 shows the calculated tsunami load by width based on the flow depth of the tsunami (H). The tsunami force results from multiplying the values in Table 2 by the width of the columns in the structure.
The main components of the tsunami load are speed, hydrostatic pressure, hydrodynamic pressure and impulse pressure. However, instead of calculating each component, expressions have been adopted to determine the total pressure. Okada et al. [11], defined the total pressure as the hydrostatic pressure of three times the flow depth. Thusyanthan and Madabhushi [12], even suggest a factor of 10 to 12 in hydrostatic loading. The simplified Bandara & Dias methodology allows a realistic estimate of the value of the tsunami load that only involves the flow depth as a variable, a parameter frequently used in the elaboration of tsunami hazard maps.
3. A CASE STUDY ON THE COLOMBIAN PACIFIC COAST
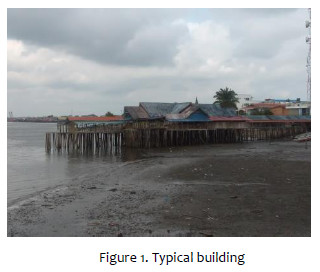
The case study analyzed corresponds to the traditional building system of San Andrés de Tumaco on the Colombian Pacific coast: timber houses built on stilts near the coastline. Because of their proximity to the sea and the subduction zone of the Pacific, these structures are exposed to earthquake and tsunami hazards, as well as to liquefaction of the soil.
3.1 Building description
The stilts are modular constructions of three spans in one direction and two spans in the other direction (Figure 1), featuring a space between columns of 2,5 meters in each direction for a total area of 37,5 m2. The average diameter of each member is 19 centimeters (taken as column width).
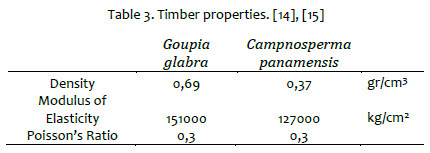
3.2 Mechanical characterization
The mechanical characterization of timber was carried out following the procedures described in ASTM D 143 [13]. In the cases that it could not be possible to perform the mechanical testing, the reference values from the Colombian wood guide [14] and the wood manual [15] were used.
The joint was characterized following the procedure described by the RILEM [16], performing a load protocol to determine its energy dissipation (Figure 2). The envelope of the hysteresis curves obtained is shown in Figure 3.
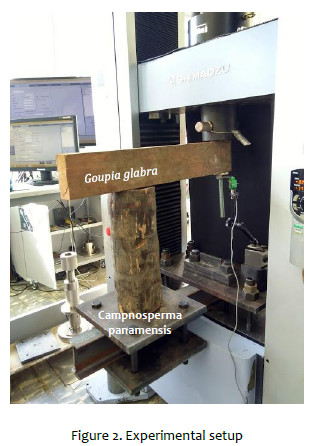
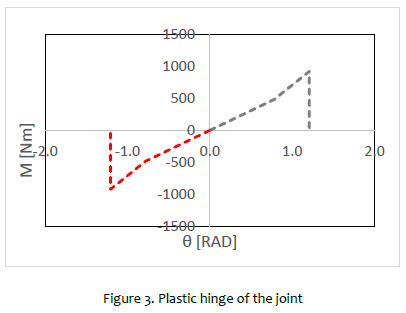
The typical joint consists of a column cut to half of the frame height and joined to the beam by a nail. The failure mechanism occurs when the nail begins to move through the pillar until being ejected. The curvature-moment graph shows a linear regime until the rotation exceeds 45 ° (yield point).
The envelope of the curvature-moment graph is translated into the definition of the material plastic hinge at the joint, which is used in the structural model to obtain the inelastic response of the system subjected to earthquake and tsunami loads. In this case, it’s obtained a function that relates the inelastic displacement of the system with two intensity measurements: acceleration (Sa) and flow depth (H).
4. RESULTS AND DISCUSSION
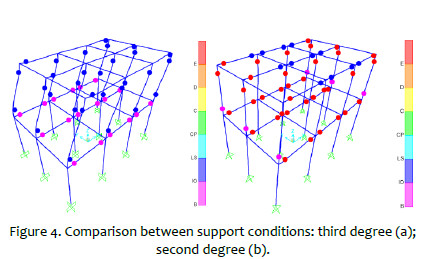
The total response of the structure shows that the displacement in a node of the roof does not increase considerably by the application of the tsunami load. Considering wave heights between 0 meters and 1,5 meters, the shear at the base increases considerably. In the case study, embedding was considered at the base because the wood used is buried 2 to 3 meters below the surface. However, the tsunami load effect on the support conditions of the structure may increase the bending moment in the connection (the piling of the pillars). For example, for an acceleration of 0,4g and a tsunami height of 1,5 meters, the embedment moment is distributed in the structure, thus depleting the capacity of the plastic hinges (Figure 4).
4.1 Hinge formation and collapse
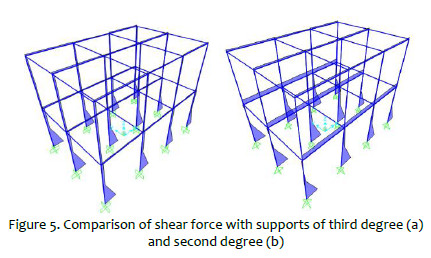
When changing the supporting condition of the structure, the shear force increase is observed along the beams that are in the same direction of the tsunami load (Figure 5). For this reason, it is possible that the structure failure could be controlled by the shear rather than by the bending moment. Additionally, considering earthquakes featuring an intensity higher than 0,4g, the displacement reached by the structure is already within the inelastic range. Consequently, it can be expected that the collapse of the structure will occur with relatively low wave heights.
4.2 Structural fragility assessment
Once the structural model was defined, 30 simulations were performed combining the acceleration values of Table 1 with the tsunami heights of Table 2. The variability in material properties and variation in the direction of application of the forces were not considered. The obtained results are adjusted to a Sigmoid function with a R correlation coefficient equal to 0.99 (Eq. 2). Figure 6 shows the graphic representation of the function, whose shape is similar to the structural fragility curves that relate the probability of damage to the structure once a intensity measure of the hazard has been reached [17] [18].
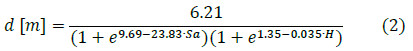
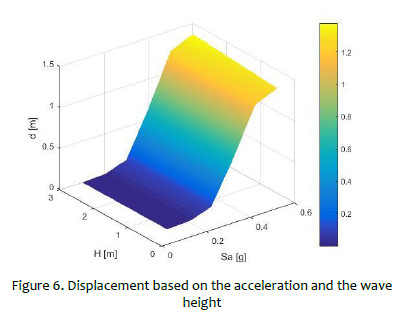
Where d is the displacement in the roof [m], Sa the Spectral acceleration [g] and H the flow depth of the tsunami [m].
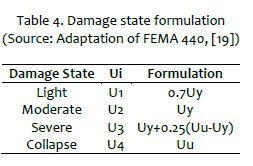
Following the procedures described in FEMA 440 (Table 4), the damage states were determined in terms of the yield deformation (Uy) and the ultimate deformation achieved by the structure (Uu).
In its general formulation, the fragility curve expresses the cumulative probability of the occurrence of damage equal to or greater than a range for a "X" demand intensity (Eq. 3) [20]:
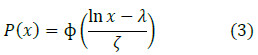
Where φ is the normal distribution, λ and ζ are the mean and the standard deviation of the In x. Additionally, parameters λ and ζ have traditionally been used to represent fragility curves and are estimated by the least square’s method or the maximum likelihood method.
Table 5 shows the values of the mean and standard deviation obtained for the construction of the fragility curves in each damage state. If the collapse damage state is taken and compared with the fragility curve obtained for the same type of structure, but only considering the tsunami effect [21], it is observed that not considering the effect of the earthquake overestimates the structural capacity (Figure 7).
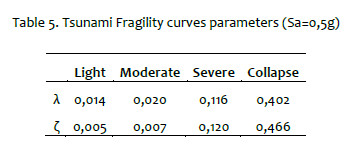
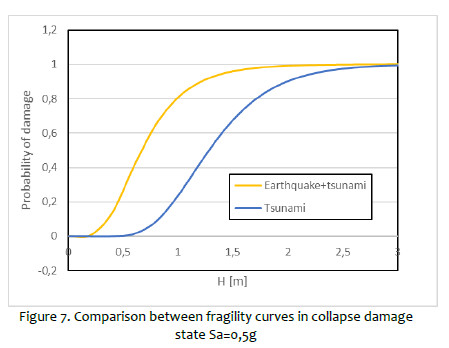
Figure 7 shows the structural fragility curves obtained for the case study, where the occurrence of earthquakes featuring an intensity less than or equal to 0,5g and wave heights of up to 3 meters was considered. As a result, it is possible to affirm that, given the occurrence of medium intensity earthquakes, with wave heights greater than 1 meter, the typical structure is already in a state of moderate damage and close to 80% probability of collapse.
CONCLUSION
It can be concluded that tsunami fragility curves that do not include earthquake effects tend to overestimate the capacity of the structures. In the case of the developed study, it was found that for relatively small wave heights (<1,5m), a collapse of the structure may have already occurred. Thus, it is also necessary to consider the conditions of the embedment in the pillars, since, when changing the support degree, an increase of the shear in the structure is expected, which could cause a failure expected to be controlled by the shear stress rather than by the bending moment.
The implemented methodology allows to consider the occurrence of a medium intensity earthquake that reduces the initial stiffness of the structure. However, it is necessary to carry out a more detailed study on the components of the tsunami force and its effect on each structure members, in order to establish whether the failure is controlled by shear stress.
ACKNOWLEDGEMENT
The authors thank Colciencias and the Jóvenes Investigadores e Innovadores program, call 775 of 2017, which partially funded this research project (DIEB Code. 38775), as well as the Materiales compuestos en la construcción civil project, DIEB code 34835 at the Universidad Nacional de Colombia (National University of Colombia). The results of this research are framed in the work developed by the tsunami group of the SATREPS project "Application of State of the Art Technologies to Strengthen Research and Response to Seismic, Volcanic and Tsunami Events, and to Enhance Risk Management" and the course J1822052 "Tsunami Damage Estimation" conducted at the IRIDeS research institute.
REFERENCES
[1] Calvi G M, Pinho R, Magenes G, Bommer J J and Crowley H 2006 Development of seismic vulnerability assessment methodologies over the past 30 years ISET J. Earthq. Technol., 43(472), pp 75–104 [ Links ]
[2] ASCE7 2016 Minimum Design Loads and Associated Criteria for Buildings and Other Structures [ Links ]
[3] Koshimura S, Namegaya Y and Yanagisawa H 2009 Tsunami Fragility — A New Measure to Identify Tsunami Damage Journal Disaster Research, 4(6), pp 479–488 [ Links ]
[4] Kameshwar S and Padgett J E 2014 Multi-hazard risk assessment of highway bridges subjected to earthquake and hurricane hazards, Eng. Struct [ Links ]
[5] I. Charvet and A. S. H. K. D. Sugawara 2015 A multivariate generalized linear tsunami fragility model for Kesennuma City based on maximum flow depths , velocities and debris impact , with evaluation of predictive, Nat. Hazards 79(3), pp 2073–2099 [ Links ]
[6] Suppasri A, Fukutani Y, Abe Y and Imamura F 2013 Relationship between earthquake magnitude and tsunami height along the Tohoku coast based on historical tsunami trace database and the 2011 Great East Japan Tsunami, 30 [ Links ]
[7] Yamin L E, Hurtado A, Rincon R, Dorado J F and Reyes J C 2017 Probabilistic seismic vulnerability assessment of buildings in terms of economic losses, Eng. Struct., 138, pp 308–323 [ Links ]
[8] D. R. Tappin et al. 2014 Did a submarine landslide contribute to the 2011 Tohoku tsunami? Mar. Geol. 357, pp 344–361 [ Links ]
[9] Bandara K M K and Dias W P S 2012 Tsunami wave loading on buildings: A simplified approach, J. Natl. Sci. Found. Sri Lanka, 40(3), pp 211–219 [ Links ]
[10] Nistor I, Palermo D, Nouri Y, Murty T and Saatcioglu M 2009 Tsunami-Induced Forces on Structures, Handb. Coast. Ocean Eng., pp 261–286 [ Links ]
[11] T. Okada, T. Sugano, and I. T, "Structural design method of buildings for tsunami resistance," Build. Lett., vol. 11, pp. 1–8, 2004. [ Links ]
[12] Thusyanthan N I and Gopal S P Madabhushi 2008 Tsunami wave loading on coastal houses: a model approach, Proc. Inst. Civ. Eng. - Civ. Eng., 161(2), pp 77–86 [ Links ]
[13] ASTM 2014 ASTM D143: Standard Test Methods for Small Clear Specimens of Timber, pp 1–31 [ Links ]
[14] Delgado M A 2013 Maderas de Colombia, WWF-Colombia - Programa Subregional Amaz. Norte Chocó Darién, p. 88 [ Links ]
[15] Green D W, Winandy J E and D. E. Kretschmann 1999 Mechanical properties of wood, Forest Pro. Madison [ Links ]
[16] RILEM 1994 RILEM TECHNICAL COMMITTEES COMMISSIONS TECHNIQUES DE LA RILEM I09-TSA : BEHAVIOUR OF TIMBER STRUCTURES UNDER SEISMIC ACTIONS Timber structures in seismic regions [ Links ]
[17] Nazri M 2018 Fragility Curves in Seismic Fragility Assessment for Buildings due to Earthquake Excitation, Singapore: Springer Singapore, pp. 3–30 [ Links ]
[18] Shinozuka M, Feng M, Lee J and Naganuma T 200 Statistical Analysis of Fragility Curves, J. Geotech. Geoenvironmental Eng. ASCE, 126, pp 1224–1231 [ Links ]
[19] FEMA 2003 Multi-hazard Loss Estimation Methodoly. Earthquake Model. Hazus. MR4. Technical Manual. Washington: Federal Emergency Management Agency [ Links ]
[20] Yamaguchi N and Yamazaki F 2000 Fragility Curves for Buildings in Japan Based on Damage Surveys After the 1995 Kobe Earthquake,12th World Conf. Earthq. Eng., pp 1–8 [ Links ]
[21] Medina S 2019 Zonificación de la vulnerabilidad física para edificaciones típicas en San Andrés de Tumaco, Costa Pacífica Colombiana, Universidad Nacional de Colombia [ Links ]
* Corresponding author:
Received: 28/06/2019
Accepted: 07/08/2019

