


Servicios Personalizados
Revista

Articulo
 Inglés (pdf)
 Articulo en XML
 Referencias del artículo
 Enviar articulo por email
Indicadores
-
 Citado por SciELO
Links relacionados
-
 Similares en
SciELO
Similares en
SciELO
Compartir

 Permalink
Tecnia
versión impresa ISSN 0375-7765versión On-line ISSN 2309-0413
Tecnia vol.29 no.2 Lima jul. 2019
http://dx.doi.org/10.21754/tecnia.v29i2.718
10.21754/tecnia.v29i2.718
EVALUACIÓN DE RIESGOS DE MÚLTIPLES RIESGOS EN ÁREAS RURALES Y URBANAS
Developing of a GIS tool to estimate the repair cost of buildings due to earthquake effects in Peru
Jorge Morales 1, Miguel Estrada2
1 Japan-Peru Center for Earthquake Engineering Research and Disaster Mitigation, Lima, Peru.
2 Civil Engineering Faculty, National University of Engineering, Lima, Peru.
ABSTRACT
Along the history, Peru have suffered many human and material losses due to the effects of natural hazards, particularly earthquakes, only in the capital city, Lima, three large earthquakes have occurred in the last century, in 1940, 1966 and 1974. But hazards itselves would not become disasters without a vulnerable population, which is the case of Peru, where the growing and developing of cities has lacked of any planification and it has been disordered, with people building without following the current regulatory framework that ensures good structural behavior during a severe seismic event. For those reasons, among others, is needed a tool that permits the identification of highly risk areas in case of earthquakes. The current study proposes an automated system on a GIS platform that allows to estimate the damage effects of earthquakes in buildings, showing the results as repairing costs. Using as basis Geotechnical information like peak ground acceleration (PGA) or Spectral acceleration (Sa), urban cadaster information (material of the building, the soil, the number of stories, etc.) and using the outputs of experimental tests and analytic simulations for different building types used in Peruvian territory, like masonry buildings, reinforced concrete buildings, adobe or quincha buildings, wooden buildings among others. This tool would allow stakeholders to have an idea of the expected damage for the next quake and would help them to take actions before the event, actions like retrofitting or relocating buildings.
Keywords: Repair cost, GIS, Earthquakes.
1. INTRODUCTION
During the 90s the General Assembly of the United Nations named the decade as the "International Decade for Natural Disaster Reduction" (IDNDR) aiming to create policies and technologies to reduce disasters for natural hazards. In 1996 the Risk Assessment tools for Diagnosis of Urban areas against Seismic disasters (RADIUS) was launched in Yokohama – Japan, creating seismic scenarios and to estimate the risk. Following the decade policies in 1999 the HAZUS program was developed in the United States, this software allows to assess the buildings seismic vulnerability for cities.
These two programs were widely used during the past decade showing good results, nevertheless, it was difficult to adapt them to the variety of structural topologies in South America and in particular in Peru.
In 2007 a large earthquake struck Pisco city in Peru, after that event CISMID developed the "Seismic Response and Damage Level Simulator" (Zavala, 2007), which considers the response of buildings after the quake and estimates the risk as repair cost, this simulator uses the Miranda Procedure adapted to Peru (Miranda, 1999).
In 2017 as part of the project South American Risk Assessment (SARA) leaded by the Global Earthquake Model (GEM) it was presented an exposure model of residential buildings for South America that considers structural parameters as construction material, structural system, number stories, etc. They obtained fragility curves after a nonlinear time history analysis using the GEM’s risk Modeller’s Toolkit for each structural typology (Villar et al., 2017)
The current study aims to develop an automatized GIS tool to estimate the repairing cost of buildings after an earthquake, using python language, the ArcGIS platform and the fragility curves of the Sara project. This tool will gather cadastral information and geotechnical information obtained from field surveys or from public institutions and use them in a friendly and fast environment to obtain the risk in terms of repairing cost of the buildings analyzed.
2. REQUIRED INPUTS
The required data to estimate the repair cost in buildings is, as mentioned before, cadastral information with structural information called exposure model and geotechnical information.
2.1. Building Exposure Model
In order to assess the seismic response of buildings is important to know physical information of buildings and gather them into a geo-database, this means to know where the buildings are and what characteristics they have. The current study will use three parameters to estimate the risk, these are shown in Table 1.
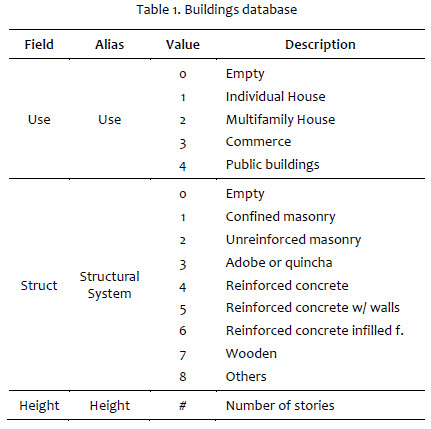
In case of lack of this information field surveys will be necessary, as mentioned by Estrada et al. in 2012, there are levels for collecting the data, by lot, by block or by sector, in any case the current tool can be used with any problem given that the input is in shape (shp) format and allows any kind of polygon, polyline or point with the database.
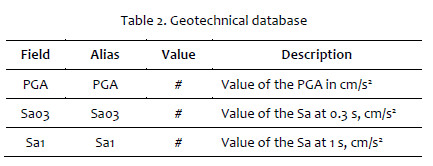
2.2. Geotechnical information
This information basically is needed as Peak Ground Acceleration (PGA) or as Spectral acceleration (Sa) in the base of the building. To obtain this data can be used information of previous studies like the ones that CISMID or the Peruvian Ministry of housing are carrying out year after year in different districts in Peru.
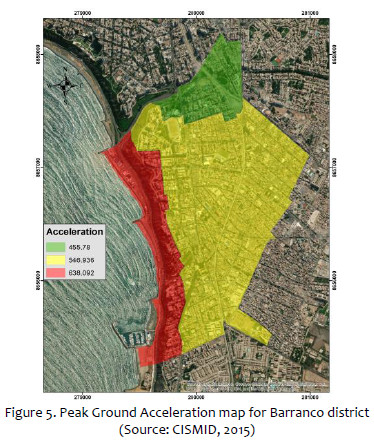
The PGA and Sa (for any time) can be calculated using diverse hazard tools like Openquake, CRISIS and many others. The current study will be using geotechnical information obtained by CISMID in 2015 for Barranco district, these accelerations were acquired after many soil tests and using the CRISIS software to simulate diverse seismic scenarios.
The format of this layer of information will be again a shape file with polygons that represent the different acceleration values of the place of study, the Table 2 show the fields required in this tool.
3. DEVELOPMENT OF THE TOOL
The main product of this tool will be thematic maps that show in an easy way how much would cost to repair buildings in a study area in terms of initial cost of the structure. In order to achieve this, is necessary to automatize the entry of data, the geoprocessing and the output of data in a matter of seconds or few minutes.
The Figure 1 shows the flowchart that was used to develop and test the tool, first, for the entry of data is important to collect both the cadastral and the geotechnical information from own resources, external databases or from collecting the data through field surveys, second, in order to process this geodatabase are necessary fragility curves or any other method that link the geotechnical information and the exposure model as damage in buildings, in the current study, analytic fragility curves were used obtained from GEM model. This fragility curves were made for several kind of structural systems, but for this study only eight are used (see Table 1).


Additionally, Figure 2, presents the curves of by plotting them with a python function used in the tool as well. In this curves the "x axis" is the geotechnical data mentioned in chapter 2 and could be PGA or Sa. There are several curves computed, each of them are used for different kind of structural systems and for different number of stories (Exposure model). Finally, the "y axis" represents the damage level of four damage states.
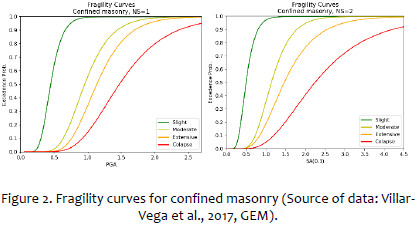
The fragility curves used follow lognormal distribution and can be computed into the tool by having the logarithmic mean and the logarithmic standard deviation. The shows an example of the data computed for all the fragility curves of the different typologies and damage states.
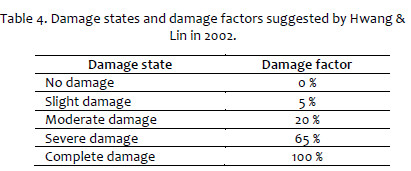
In 2002 Hwang & Lin suggested damage factors in order to find an average damage factor, which would represent the percentage of damage in the building in terms of its initial cost. The Table 4 shows the damage factors used in this study and its relationship with the damage states.
Having solved the firsts steps a Graphical User Interface (GUI) was developed to make the tool friendly and easy to use. This user interface has only eight values to be filled, which are shown in Figure 3 and in the Table 5. The module wxPython was used to complete this task due to its versatility with python language and GIS.


After the development and debugging of the GUI the last part was to show the results in a map and to validate them by compare them with another software or tool. In case of inconsistent results, the tool should be recalibrated, nevertheless in this case the results tested in the next chapter were consistent with those obtain by CISMID in 2015 for Barranco District.
The tool presented is intended to be used by decision makers or researchers, although, because of the easy interface, can be manage for any kind of user with access to a computer.
The present implement will work as a single executable file, but will need a version of ArcGIS for desktop installed (v10.0 or higher).
4. APLICATION IN BARRANCO DISTRICT
The district of Barranco is Located in Lima city, has a population of 34378 inhabitants in an area of 3.33 km2, borders the Pacific Ocean in the west and has many structural typologies. Among those reasons, was selected to be tested with the implemented tool.
The building exposure model and the geotechnical information were collected from the study carried out by CISMID in 2015 under the SATREPS Project on Enhancement of Earthquake and Tsunami Disaster Mitigation Technology in Peru.
The building characteristics were collected in a block level by selecting a representative lot in the whole block and only the 30 % of the blocks in the district were evaluated. The Figure 4 shows the thematic map of structural system and the map of number of stories for Barranco district.

The geotechnical information was obtained by considering a probabilistic seismic hazard analysis and by carrying out geotechnical and geophysical tests in order to determine the behavior of the soil in study with many seismic scenarios. The Figure 5 shows the map obtained in 2015 of the PGAs for the district of Barranco.
Finally, the tool is executed gathering all this information as mentioned in previous chapter. The result obtained is shown in the Figure 6, where the values represent percentages of the repair cost of buildings in the district in terms of the initial cost of the building.
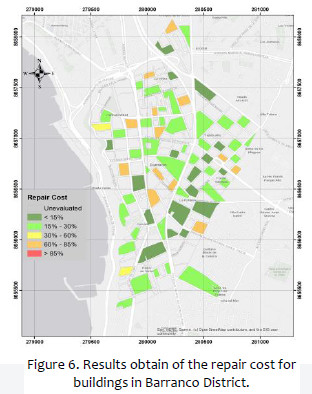
For values greater than 60 % probably would be better to demolish and reconstruct the building again.
CONCLUSIONS
- It has been developed a Tool to estimate the repair cost of buildings in a quick an easy way.
- In order to complete the perform of the tool two kind of data is necessary, a simplified exposure model and geotechnical information with values of PGA and Sa.
- The links between the cadastral information, geotechnical information and the damage to estimate are in this case the analytical fragility curves for diverse structural typologies.
- The current tool can be applied to any Peruvian city where can be obtained the inputs required. And in further upgrades could be applied to other parts of South America.
- The overall goal of the study is to help decision makers to develop prevention and mitigation plans.
ACKNOWLEDGEMENT
The authors acknowledge to the Japan Peru Center for Earthquake Engineering Research and Disaster Mitigation for the support in the develop the current study, specially to the current director, Dr. Carlos Zavala and the current research director, Dr. Miguel Diaz. Also our gratitude to the Japan International Cooperation Agency for the support during the SATREPS project and the Follow Up Project.
REFERENCES
[1] Estrada M, Zavala C, Lazares F, Morales J 2012 GIS Tool for Calculating Repair Cost of Buildings due to Earthquake Effects, 9th International Conference on Urban Earthquake Engineering/ 4th Asia Conference on Earthquake Engineering, Tokyo Institute of Technology, Tokyo-Japan [ Links ]
[2] Hwang H, Lin Y W 2002 Seismic Loss Assessment of Memphis City School Buildings. Proceedings of The Seventh U. S. National Conference on earthquake Engineering, Boston [ Links ]
[3] Martín A 2003 Aplicación de los SIG al cálculo del impacto de terremotos sobre infraestructuras y edificios, Sevilla University, Sevilla-España [ Links ]
[4] Villar-Vega M 2017 Development of a Fragility Model for the Residential Building Stock in South America, Earthquake Spectra, 33(2) pp 581-604, Earthquake Engineering Research Institute [ Links ]
[5] Zavala C 2007 Simulador de respuesta sísmica y nivel daño SRSND, CISMID/FIC/UNI. Lima [ Links ]
[6] Zavala C, Aguilar Z, Estrada M 2011 Evaluation of SRSND simulation against fragility curves for Pisco quake, 8th International Conference on Urban Proceedings of Earthquake Engineering [ Links ]
* Corresponding author:
Received: 02/08/2019
Accepted: 12/08/2019

