


 Inglês (pdf)
 Artigo em XML
 Referências do artigo
 Enviar este artigo por email
 Citado por SciELO
  Similares em
SciELO
Similares em
SciELO 
 Permalink
1. INTRODUCTION
There is evidence during a seismic event that a floor could collapse into the connection between the slab and vertical elements like columns or shear walls, eliminating any possibility for transferring the seismic forces because the slab was not designed for seismic demand in its plane.
In the 1994 Northridge earthquake, some slab connections failed because they did not have enough capacity for transmitting seismic forces to the reinforced concrete walls. Another similar case was the Canterbury Television building during the 2011 earthquake in New Zealand, where also connections collapsed.
It is a common hypothesis in practical engineering that slabs behave like a rigid diaphragm and that designing is only based on gravitational loads without consideration that the floor is a component of the seismic resistant system.
The assumption that the slab is a rigid body considers that the floor has enough capacity for transmitting seismic forces among resistant vertical elements. However, this could not be right because any element does not have infinite capacity or stiffness.
For the seismic design of a floor, it is necessary to know its maximum horizontal acceleration during an earthquake. In this paper, a simplified procedure is shown for its use in practical engineering with some parameters commonly used in Peru.
Some efforts in this direction had been developed but the procedures proposed do not reproduce the floor accelerations or, what is worse, underestimate them since the methodology used has been calibrated using elastic models.
Many seismic codes in the world, such as NTCDS2 or ASCE 73, have included recommendations for obtaining floor accelerations. In the Peruvian seismic code, no references are shown for a methodology, and it only presents a procedure to calculate the accelerations on each floor based on the maximum base shear. These might not correspond to the maximum acceleration of the floor because, these two events do not necessarily occur at the same time.
In this paper, the proposed methodology, based on the First Reduced Mode Method presented by Rodriguez1, was calibrated with non-linear inelastic analytical models and results of specimens tested on a shaking table with different types of seismic records and various structural configurations. The rW factor was included in this procedure to consider the participation of higher modes in dual systems (frames / walls). This factor corresponds to the relationship between the base moments in walls and the building under analysis.
In spite of proposals based on results from foreign designs, this methodology can be used in Peru due to seismic and design fundamentality based on American codes. Therefore, its application in Peru is validated.
The goal of this paper is to present a proposal using Peruvian seismic parameters that will be validated later with results of buildings designed by the Peruvian code of reinforced concrete design, E.060, and analyzed using local seismic signals recorded.
2. BACKGROUND
Many researchers have proposed methodologies to obtain floor accelerations4,5. Nevertheless, they cannot adequately predict the response of a model that gets into the inelastic behavior range.
Until a few years ago, the regulations still did not contemplate the importance of the seismic design of the slabs, and the formulations they presented for the calculation of accelerations often overestimated or, what is worse, underestimated the seismic demands.
Subsequently, after the failures of floor systems observed in different earthquakes, various standards worldwide2,3 became aware of the importance of the seismic design of floor systems. Thus, later versions present recommendations for the design of these elements, based on simplified procedures that can determine the accelerations developed during a seismic event. Peruvian regulations do not present a specific methodology for calculating these accelerations.
Given the lack of these procedures in Peru, it is necessary to propose a methodology that can be used in the Peruvian seismic regulations to calculate the required forces in the design of floor systems. It is in this context that it is proposed to use the First Reduced Mode Method (PMR)1, that has already been included in the Mexican seismic regulation2 and ASCE 7-163.
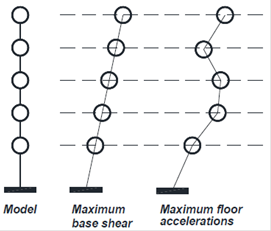
In the Peruvian seismic code, the floor accelerations are obtained from base shear. This shear force is distributed along with height and then divided by the mass floor to obtain acceleration in the slabs. However, this procedure is not correct because the calculation of base shear is oriented to maximize this shear force, but it does not necessarily correspond to the maximum accelerations of the floor at each level (Fig. 1).
It is necessary to point out that one of the great advantages of the presented proposal is its simplicity, since with the use of few parameters it is possible to obtain floor acceleration envelopes that are on the safe side. Likewise, the estimation of maximum floor accelerations is of vital importance for the design of non-structural components, such as partitions, mechanical and sanitary installations, electrical equipment, ceilings, etc.
3. PROPOSED ENVELOPE FOR ACCEL-ERATION FLOORS
The maximum acceleration value at top level using the First Mode Reduced method1 is:
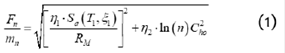
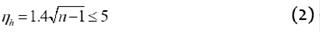
In this expression, Fn/mn represents the acceleration at the upper-level an, mn is the mass at the top level, RM is a reduction factor obtained as the ratio between the overturning base moments in the elastic and inelastic response, Sa(T1,ξ1) is the spectral demand for ξ1 damping, T1 is the fundamental period of the structure, n is number of floors, Cho is the spectral demand for zero period,Ƞ1 and Ƞ2 are the simplified factors taken into account the first and higher modes participations, respectively. Schoettler6 proposed the use of Ƞ1=8/5, and for Ƞ2 the expression:
In this paper, the factor (1-rW) was included in the original FMP method to account for the participation of higher modes (ms) in dual systems (frames / walls).
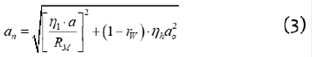
where an is the maximum top-level acceleration, rW is the ratio between the base moments in walls and in the building under analysis, a is the spectral acceleration at the fundamental period of the building, ao is the maximum base acceleration and RM the same as explained before.
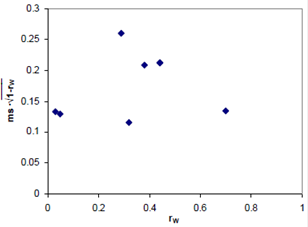
In8, it was proved that  and
and  keep an inversely proportional relation, as it can be shown in Fig. 2. Therefore, the factor (1-rW) can be used to control the contribution of higher modes.
The rW factor was calculated using non-linear inelastic analysis. However, it is subsequently shown that similar results can be obtained in linear elastic analysis.
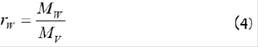
Where MW includes overturning base moment in all walls and MV is the total moment at the base. It is important to mention that overturning base moment was used instead of base shear because it is a more stable parameter. This means that, during a seismic event, the inertial force and its location in height varies without known limits trying to keep the constant capacity base moment.
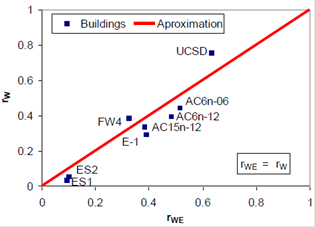
The rW factor was obtained from non-linear inelastic analyses, so it might seem that its use in practical engineering is difficult. However, it was found that this rW factor correlates with rWE factor obtained in elastic analysis. Therefore, the use of both rW or rWE is indistinct (Fig. 3)
Accordingly, based on (3), a proposed expression for calculating the maximum acceleration using parameters of Peruvian seismic code E.030 (anP) is shown as follows:
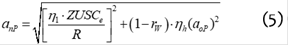
where the acceleration a was replaced by ZUSCe, Ce is the C parameter evaluated in the effective period (Teff), R is the reduction seismic factor and aoP is the maximum acceleration base and equal to ZUS. The Teff period corresponds to a building with cracked sections and can be related to non-cracked section period (Tg) by:

Finally, once the parameters have been obtained, a simple envelope is proposed for the floor accelerations, based only on the maximum values at the top and base levels, but including the participation of walls in the seismic behavior. As1, it is suggested to use a linear variation (Ωi) between the upper (anP) and base acceleration (aoP) values to calculate the acceleration floor ai (Fig. 4)
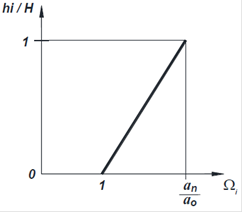

Where Ωi is an amplification factor of the floor acceleration and hi/H is the relative height of the level under consideration.
4. MODELS STUDIED FOR VALIDATION OF PROPOSED ENVELOPE
Five experimental models were tested on a shaking table and three analytical models were used for validation of the envelope. The seismic structural resistant systems in all models were dual with more or less degree of participation of the structural walls in the seismic response. The experimental models were tested in different universities and in various years, while analytical models correspond to buildings designed within the framework of engineering practice.
4.1 ANALYTICAL MODELS
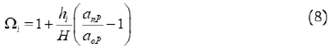
Three buildings were designed, two of them of six and the other of fifteen levels, using design drifts of 0.006 (AC6n-06 / AC6n-12) and 0.012 (AC15n-12). All buildings were considered to be located on soil type II. For the design, the seismic code of the state of Guerrero, Mexico2 and the reinforced concrete code of Mexico City7 were employed. In all cases, a seismic behavior factor, Q, equal to 2 was used for the design. Fig. 5 shows the plan and elevation views of these buildings. Table I presents the dimensions of structural elements (beams, columns, and walls). For more details, see Sanchez8.
TABLE I Beam, column, and wall dimensions in meters
| Structural element | AC6n-06 | AC6n-12 | AC15n-12 |
|---|---|---|---|
| Beams | 0.3 x 0.7 | 0.3 x 0.6 | 0.4 x 1.0 |
| Columns | 0.8 x0.8 | 0.6 x 0.6 | 1.0 x 1.0 |
| Walls in 1 and 5 axes | 0.3 x 5.5 | 0.3 x 4.0 | 0.4 x 7.5 |
| Walls in A and C axes | 0.3 x 5.5 | 0.3 x 4.0 | 0.4 x 4.5 |
A non-linear time history analysis was developed for the three designed buildings. For the analysis, the Ruaumoko software9 was used considering P-delta effects. Critical damping equal to 5% was taking account in all modes. A Takeda hysteresis model was employed for reinforced concrete. To solve equations of motion, the Newmark procedure (β=0.25 and γ=1/2) with a step of 0.0001s guaranteed convergence.
Bi-linear approximations of curvature-moment curve were used for beams based on results of BIAX software and, for columns, interaction diagrams were obtained with the same program. For a better representation of behavior, the average stress-strain relationship of deformed bars produced in Mexico was used10. According to recommendations, the length of plastic hinges for beams and columns was equal to half of depth, while for walls, half of length11.
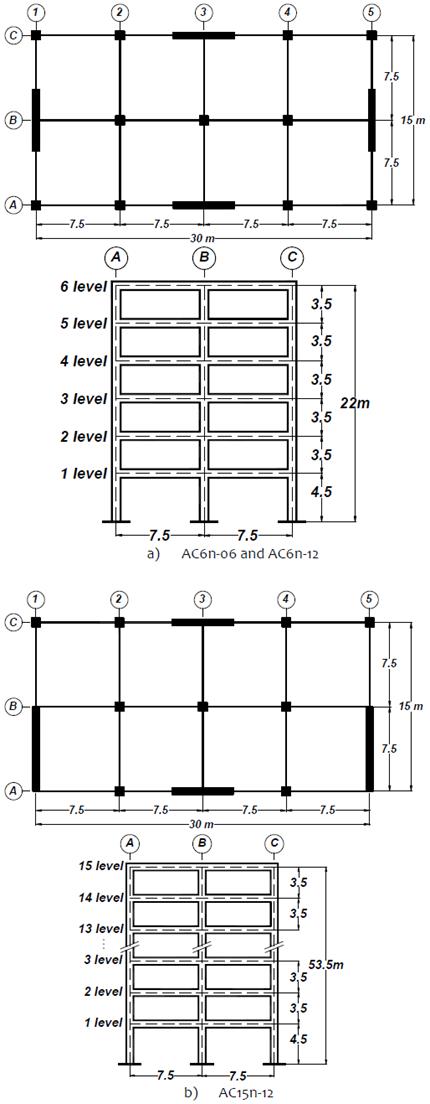
The seismic signal employed was the Llolleo earthquake, Chile (1985), increased 1.5 times to achieve the inelastic behavior in buildings (Fig. 6).
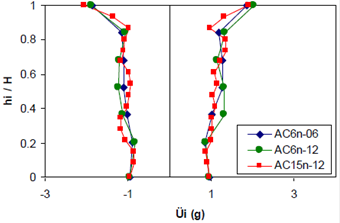
In Fig. 7, from the non-linear time history, the envelopes of maximum floor accelerations on each floor are shown, while in Fig. 8 the overturning moment at the base of the structural system (Dual System) and of walls (Walls) normalized to the maximum overturning base moment (MTH) are displayed. From the last figure, the rW factor is equal to 0.33, 0.39, and 0.44, for the AC15n-12, AC6n-12, and AC6n-06 buildings, respectively. In addition, the RM factor, defined as ratio between the maximum elastic overturning base moment and the maximum inelastic overturning base moment factor, was equal to 2.4, 2.11, and 2.14, in the same order of the buildings described above.

5. EXPERIMENTAL MODELS
5.1 Models tested at University of Illinois (1979-1989)
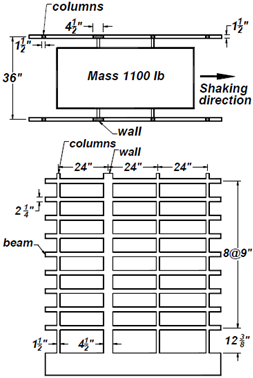
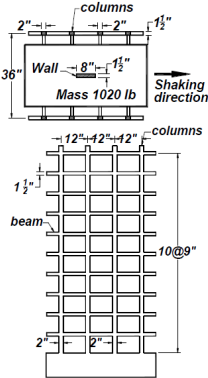
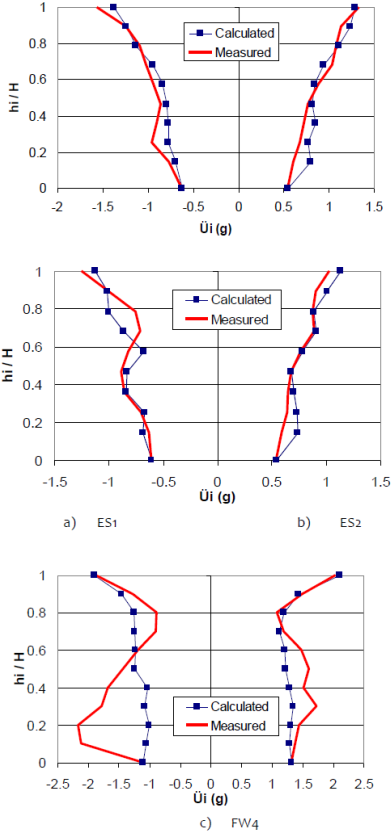
Three models were tested on shaking tables during 1979 and 1989 at the University of Illinois. They were named as ES1 and ES2, both of 9 levels12 and FW4 of 10 levels13, representing dual systems. Schematic plan and elevation views are shown in Fig. 9 and Fig. 10.
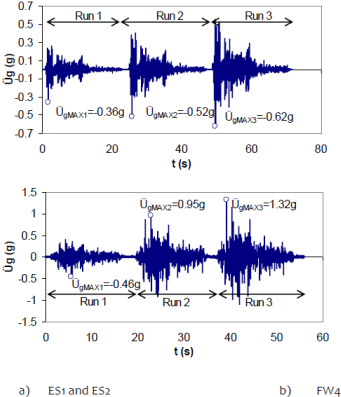
ES1 and ES2 specimens were tested under three consecutive seismograms corresponding to the N-S component of the Imperial Valley earthquake recorded at El Centro station, California in 1940, with acceleration intensity increased by 1, 1.49 and 1.77 12. For FW4 specimen, three consecutive signals were applied corresponding to the N21E component of Tehachapi earthquake, registered at Taft station, California in 1952, with amplified accelerations values at 3, 6, and 8.5 13. In Fig. 11, the three ground motions described for all models are shown.
For calibration of analytical response with the tested response, a non-linear time-history analysis was developed using the Ruaumoko software9. Critical damping equal to 3% was taken into account in all modes. The Takeda-Modified hysteresis model for reinforced concrete was employed. The Newmark procedure (β=0.25 and γ=1/2) with a step of 0.001s was drawn to solve equations of motion.
The envelope of the floor maximum acceleration of both analytical and tested results for these three experimental specimens is shown in Fig. 12. It can be seen that the two curves are similar, so it can be concluded that the calibration was successful. On FW4 specimen, only a discrepancy is displayed on the first floor. The authors reported that some peak frequencies were recorded during testing that distorted the measured response13.
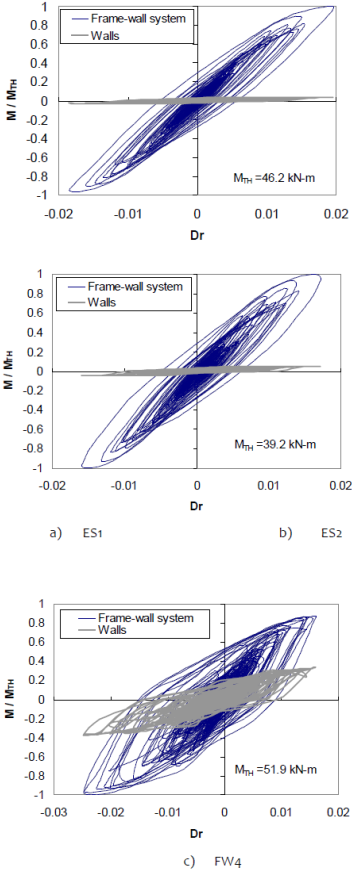
After calibration, from non-linear analysis, the overturning base moment in the dual system (Dual System) and the walls (Walls) are shown (Fig. 13). Both of them were normalized with respect to the maximum base moment (MTH). From these graphs, the rW factor is 0.03, 0.05, and 0.38, corresponding to ES1, ES2, and FW4, respectively. It is important to mention that the lower the rw factor, the behavior is closer to a frame system. From the non-linear analysis, RM were 1.85, 2.2, and 3.8 for ES1, ES2 and FW4.
5.2 Model tested at University of California, San Diego (2006)
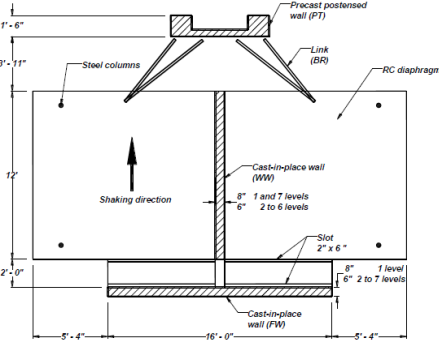
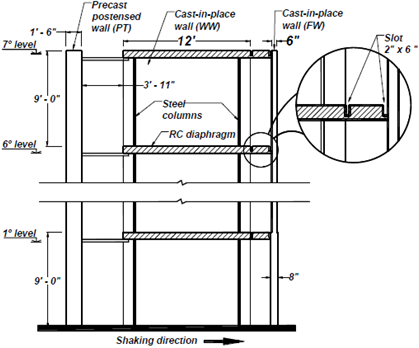
This experiment (UCSD) corresponds to a 7-level full-scale model tested at the University of California in San Diego, as part of the NEES-UCSD agreement14. The model represents a part of a real building and is composed of two cast-in place walls (WW and FW) and another post-tensioned precast wall (PT). The concrete slab is supported by steel columns that are only used for gravitational loads. Schematic plan and elevation views are shown in Fig. 14.
As with previous specimens, four earthquake signals were used in this shaking table test. The first two correspond to the longitudinal and transversal components of the San Fernando earthquake (1971) recorded at the Van Nuys station, and, the last two, associated to the longitudinal component recorded in Oxnard Boulevard station and the 360° component recorded in Sylmar station, both from the Northridge earthquake, California (1994). The four input ground motions for the UCSD specimen are shown in Fig. 15.
Like previous specimens, the Ruamoko software9 was used for calibration. Critical damping ratio of 3% was employed for all modes. The Takeda-Modified hysteresis rule was used for reinforced concrete and Ring-Spring for the post-tensioned wall. The Newmark’s method (β=0.25 and γ=1/2) for integration of equilibrium equation with a stepwise of 0.0001s guarantied convergence.
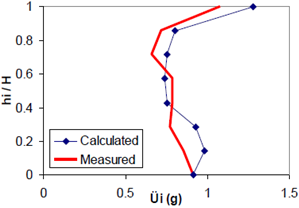
The envelope of the floor maximum acceleration of the tested model and the analytical results are shown in Fig. 16. As it can be seen, there is a close approximation between the calculated and measured envelopes.
In Fig. 17, from non-linear analysis, the overturning base moment in the dual system (Dual System) and the walls (Walls) are shown. Both of them were normalized with respect to the maximum base moment (MTH). From this graph, the rW factor is 0.75. As part of the results, RM was equal to 2.4.

5.2.1 Specimen tested at National Autonomous University of Mexico (2006)
The specimen tested at the National Autonomous University of Mexico, called E-1, corresponds to a miniature building of 5 levels8. Scaling rules or laws of similarity were not used, nor was the time scaled, nor was the magnitude of acceleration increased. Plan and elevation views are shown in Fig. 18. The frame was made of steel and the wall of reinforced concrete and it was tested with the Llolleo earthquake, Chile, 1985. To connect the frame and the wall, a link with hinged ends was added to the specimen. Additionally, steel ingots were placed on each floor to represent the mass in the building. Due to the size of wall, deformed bars of small diameter were imported from New Zealand. The stress-strain relationship was close to the Mexican steel; hence, it could be used in the specimen.
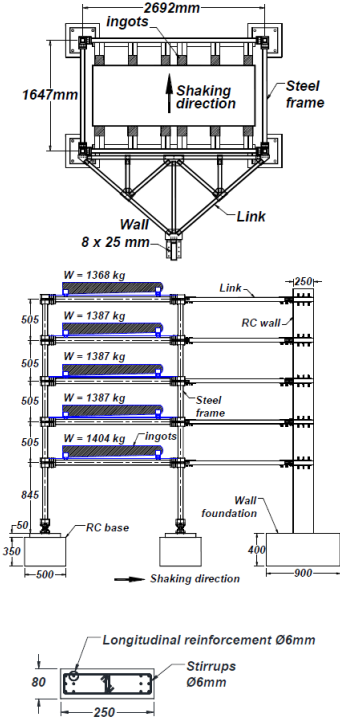
Fig. 18 Top view: plan and elevation views of E-1 model. Bottom view: Section at base wall (dimensions are in mm)
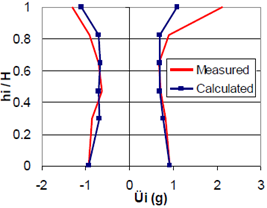
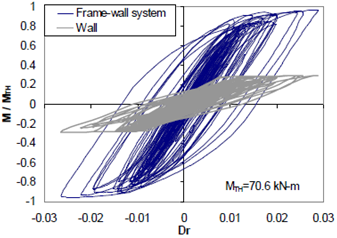
Using the Ruaumoko software9, a non-linear time history analysis was developed. The measured calibration accelerations and the analytical results are shown in Fig 19. As in previous specimens, in Fig. 20, a graph of the overturning base moment in the dual system (Dual System) and the walls (Walls) is shown. Both were normalized with respect to the maximum base moment (MTH). From this graph, rW factor is equal to 0.29. It is necessary to mention that, during the test, a maximum acceleration was registered at the base, so a whiplash was registered in the upper level on the right side. However, from calibration, a close relationship was obtained between experimental and measured results.
6. VALIDATION OF PROPOSED ENVE-LOPE
In Table II, a summary of the values required to calculate the acceleration on the top floor, according to (3), is shown. The order presented corresponds to ascending values of the participation of walls in the seismic response (rW)
TABLE II Values of parameters used for obtaining top floor acceleration (an)
| Model | University | ao(g) | n | a(g) | RM | rW |
|---|---|---|---|---|---|---|
| ES1 | U. Illinois, USA | 0.62 | 9 | 1.6 | 1.85 | 0.03 |
| ES2 | U. Illinois, USA | 0.61 | 9 | 1.6 | 2.2 | 0.05 |
| E-1 | UNAM, Mexico | 0.92 | 5 | 2.5 | 3.5 | 0.29 |
| AC15n-12 | UNAM, Mexico | 0.96 | 15 | 0.8 | 1.3 | 0.33 |
| FW4 | U. Illinois, USA | 1.32 | 10 | 3.2 | 3.8 | 0.38 |
| AC6n-12 | UNAM, Mexico | 0.96 | 6 | 1.3 | 1.6 | 0.39 |
| AC6n-06 | UNAM, Mexico | 0.96 | 6 | 2.0 | 2.4 | 0.44 |
| UCSD | U. California, San Diego, USA | 0.93 | 7 | 1.3 | 2.4 | 0.75 |
In Fig. 21, a comparison of the proposed envelope (EP) and the results of the model (Model) is shown. Furthermore, the FMR method (which does not involve the rW factor) and ASCE 7 3; recommendations were included in the same graphics.
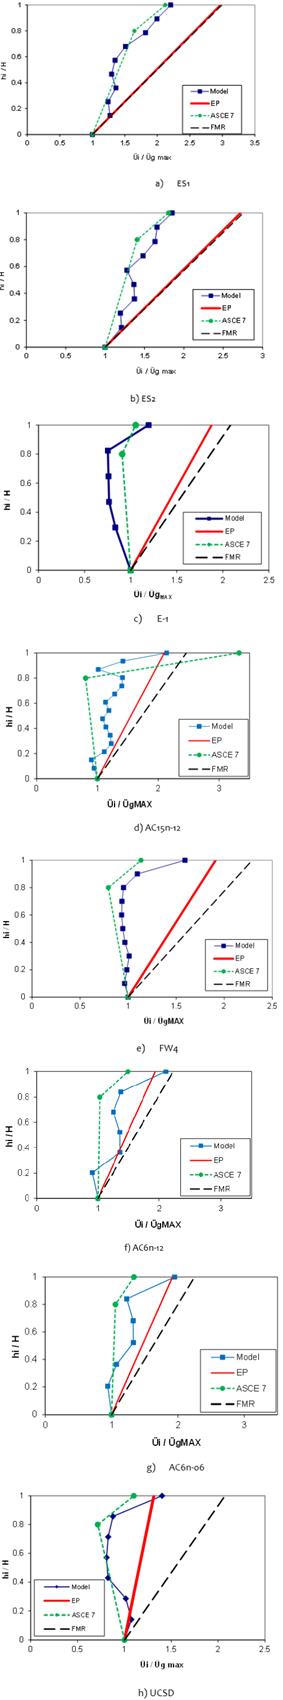
It can be seen that the envelopes obtained using (3), which includes rW factor, show a close approximation to the experimental results always on the safe side. Furthermore, in the proposed envelopes for ES1 and ES2, the acceleration an is greater than the measured response. Then, it must be considered that in these models the behavior is closer to a frame system because the contribution of walls is reduced.
On the other hand, and for the rest of the models, the rW factor is higher, so the predicted maximum top-level acceleration (an) is near to the experimental results. These last specimens are more similar to Peruvian buildings that commonly present a dual-type system due to the high local seismic demand; therefore, their application is justified for the structuring of buildings in Peru.
In models with lower rW (ES1 and ES2), the difference between the proposed envelope and FMR was not relevant. Otherwise, in models with higher rW (AC15n-12, FW4, AC6n-12, AC6n-06, and UCSD), the estimated accelerations (an) are close to the measured response. Even though in some cases the maximum top acceleration was underestimated, the difference was 2% in AC15n-12, 7% in AC6n-12 and 5% in UCSD that, for practical purposes, can be considered reduced and acceptable.
In the case of ASCE 7 3, it is shown that the curve can represent the shape of the experimental acceleration’s envelope. However, in many cases, the predicted acceleration is underestimated. This condition is not acceptable because it would be unsafe.
Finally, from the validation, it was observed that the acceleration envelope proposal is on the safety side, while that of the ASCE-7 underestimates the acceleration in several floors; therefore, the envelope presented can be qualified as adequate.
CONCLUSIONS
This article proposes the use of an acceleration envelope to calculate the seismic demands on each floor using the First Reduced Mode (PMR) procedure1 to which the rW parameter has been added. This parameter takes into account the contribution of the walls to the higher modes of vibration. The Peruvian seismic code, E.030, does not contemplate this aspect yet, since its development is based solely on the determination of the maximum shear force at the base, but not on the maximum acceleration demands on each of the floors.
For the development of the acceleration proposal, the results of three analytical and five experimental models have been used, the latter tested on a shaking table in several laboratories. The study objectives of each of the models used were different, so this diversity makes the development of the presented procedure to be widely used.
Due to the high seismic demand in Peru, most of the buildings are structured based on dual systems: frames and concrete walls, where the participation of the walls in the behavior against lateral loads is important. In this sense, the understanding of the interaction of frames and walls during a seismic event becomes even more relevant in the Peruvian case.
From this investigation, the most important conclusions are:
It was observed that the top-level acceleration obtained using the FMR 1 procedure provides results that are on the safe side; however, they overestimate the response in most of the structures analyzed.
The inclusion of the participation of the walls through the parameter rW in the FMR proposal 1 reduced the prediction of the acceleration at the top-level, approaching to what was measured or calculated mainly in buildings where the participation of the walls is important (AC15n- 12, FW4, AC6n-12, AC6n-06, UCSD).
Although the inclusion of the rW parameter in some cases caused the demand of acceleration at the top-level obtained by the procedure proposed in this paper produce lower results than those calculated ((AC6n-12) or measured (UCSD), the difference is small and can be considered acceptable.
The acceleration envelope proposal is on the safety side; therefore, it can be qualified as adequate.
Finally, the procedure is simple and uses variables that the practicing engineer commonly uses in a seismic design; thus, its use can be implemented without deviating from the traditional design.

