


 Espanhol (pdf)
 Artigo em XML
 Referências do artigo
 Enviar este artigo por email
 Citado por SciELO
  Similares em
SciELO
Similares em
SciELO 
 Permalink
1. INTRODUCTION
Nowadays, the central Peru coast is exposed to a seismic gap, according to studies conducted under the SATREPS Project. These studies concluded that a severe earthquake (Mw8.6~8.9) might occur in Lima City [1].
Considering this scenario, monitoring the continuous operation and assessing the structural damage of important buildings such as hospitals is necessary due to its vital functions immediately after an earthquake. It becomes essential in Lima City because this city concentrates over 32% of the population of Peru.
Methods of structural damage assessment based on Structural Health Monitoring (SHM) have more advantages than traditional methods because they are based on visual observation and numerical analysis with study of material properties and elements conditions. Some researchers had proposed different methods to assess the damage level using information obtained from acceleration sensors, such as how to identify changes in its operational shapes using the Operational Mode shapes (ODS) [2] or observing the global capacity curve in real-time using sensors on all floors [3]. However, monitoring tall buildings with sensors on all floors requires costly and complex implementation. For these buildings, Pan and Kusunoki have proposed a methodology to estimate the global capacity curve using a limited number of sensors and processing the acceleration obtained by sensors through wavelet transform [4]. Wavelet transform allows to decompose a signal in frequency bands and selects only the bands with important information of the building, deleting bands with noise.
In that sense, different initiatives have been taken for the SHM of buildings in Peru. SATREPS project implemented the first network of structural health monitoring with three buildings, one of these was the Edgardo Rebagliati Martins Hospital (HERM), with five sensors located one in its base, two on the 10th floor, and the last two on the 14th floor [5]. Thus, it is necessary to evaluate if these sensors provide sufficient information to assess the structural damage after an earthquake and provide the optimal arrangement of sensors due to just some floors being instrumented.
In this research, various arrangements of sensors in the HERM are discussed to find the optimal configuration to estimate the global capacity curve and the relationship between story - shear and drift, varying the numbers of sensors and their vertical locations. That is according to the information obtained with its SHM and the results of dynamic seismic analysis using synthetics accelerograms for a several hazard level.
2. BACKGROUND
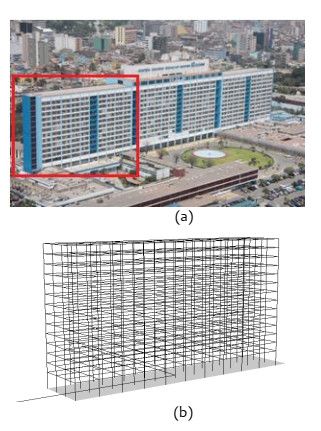
The HERM is the most important complex hospital of the social security of Peru, built in the decades of 1950. Since its construction, it was exposed to earthquakes in Lima in 1960, 1966, 1974, and 1993. In 1997, under the framework of the seismic vulnerability project in Hospitals of Peru, Japan-Peru Center for Earthquake Engineering Research and Disaster Mitigation (CISMID) carried out one study for the damage assessment of the HERM using numerical models and seismic scenarios. The study concluded that the structure would suffer moderated structural damage without compromising collapse, and the masonry would be damaged. In 2014, under the SATREPS project, five accelerometers were installed in the HERM. One accelerometer on the base, two on the 10th floor, and two on the roof, as shown in figure (1. a). The model of sensors installed was Accelerometer ITK - 002, as shown in figure (1. b). However, there was no analysis focused on determining the efficiency of the arrangement of the sensors. In the present study, we analyzed several sensor arrangements for monitoring the structural health of the building in severe seismic scenarios.
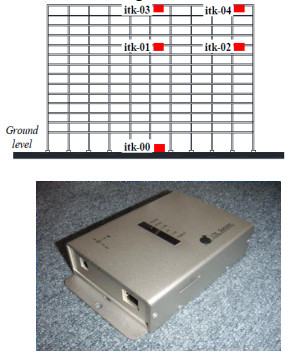
Note: Taken from [5]
Fig. 1. Sensors installed in Block A of the HERM. (a) Location of sensors (b) Model of sensors: Accelerometer ITK - 002.
3. METHODOLOGY
The proposed methodology involves two main methods. First, the wavelet transform method takes the acceleration recorded by the sensors of each instrumented floor and the displacement obtained by integration to separate them into frequency bands. These bands are evaluated to identify which represent the actual structural response. Secondly, the interpolation based on a spline shape function is applied when the frequency bands are identified. The interpolation takes two accelerations recorded in two adjacent instrumented floors to represent the response of the intermediate floors. Finally, the relationships between story - shear and drift for each story are calculated.
3.1 INTERPOLATION METHOD BASED ON A SPLINE SHAPE FUNCTION
When model properties information of existing structure is not available, the interpolation method based on a spline shape function is easy to implement; it allows to obtain seismic records of a determined non-instrumented floor using the acceleration of adjacent floors, preserving their frequency content [6]. As the HERM structure is a 14-story building of reinforced concrete frame we can assume its behavior as a cantilever beam with boundary conditions shown in TABLE I, where x (0, t) is the relative displacement and x’ (0, t) correspond to its first derivative respect to time t and üg represents the ground’s acceleration while ü is the absolute acceleration.
The process of obtaining the coefficients shown in equation (1) is applied in each step of the discrete data of the acceleration records for n intervals.
Where ü(z)is the absolute acceleration of the floor located at the height Z. Furthermore, the coefficients  and
and  represent the components of the equation in every height interval [Zi , Zi+1]. As there are n intervals, 4(n) coefficients are needed to determine the response of the structure.
As the response at the top story of HERM is known, ü‴(H,t)=0 can be replaced by the condition that ü(H,t) = ü(H,t) [6].
3.2 WAVELETS TRANSFORM
The wavelet transform is a mathematical technique that permits decomposing a signal into multiple frequency bands to select bands that contribute to the structure response, eliminating bands that contain noise [7]. The signal  of N points of discrete data is separated in a signal with some frequency bandwidth,
  and another signal
  . The process is repeated n times.
Finally, the equation (3) is obtained, n signals g, which have different frequency bandwidth, are shown.
The quantity n of repetitions is calculated using the equation (4).
4. NUMERICAL ANALYSIS
4.1 DYNAMIC LOADS - SYNTHETIC EARTHQUAKE RECORDS
The structure response generated by the ground motion depends on dynamic soil properties. In that sense, for numerical analysis, it is important to use earthquake accelerograms whose response spectrums are similar to the study site response spectrum as inputs for adjustment to the specific target spectrum.
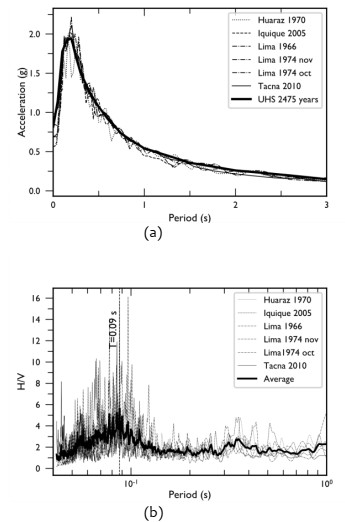
The HERM is located on soil with low periods under elastic conditions. Different ground motions were recorded by the monitoring network since 2014, with accelerations up to 45 cm/s2, which were applied to estimate the relationship between horizontal and vertical components H/V [8]. Figure (2) shows that the soil under elastic conditions presents an average period of 0.12 seconds.

Fig. 2. Relationship between horizontal and vertical components of recorded data. (a) Registers of 2016, (b) Registers of 2019
For the analysis, we compiled seven earthquake records that originated by the subduction of Nazca and South American tectonic plates. TABLE II shows the principal characteristics of these records, which were mainly obtained from stations located in Lima city.
The selected earthquake records were adjusted, matching their response spectrum with the target spectrum. The target spectrum was the uniform hazard spectrum (UHS) for a severe scenario (2475-year return period) provided by SENCICO [9]. This procedure was done using the software SeismoMatch, an application capable of adjusting earthquake accelerograms to a specific target response spectrum, using the wavelets algorithm. Figure (3. a) shows the response spectrum of selected earthquake records matched with the UHS target. In addition, the relationship between horizontal and vertical components of the adjusted record was calculated. Figure (3.b) shows that the average principal period of the synthetic records is approximately 0.09 seconds.
4.2 DYNAMIC ANALYSIS
The dimensions of the analyzed HERM block are 15.9 m wide, 73 m long, and 45.6 m in height, and it was modeled as a 14-story building of RC frame. TABLE III shows the structural characteristics and material properties of the building. Also, it was modeled using the software Stera 3D. The modal analysis showed that the period of the principal longitudinal direction mode is 1.86 s, while the period of the principal transversal direction mode is 1.65 seconds.
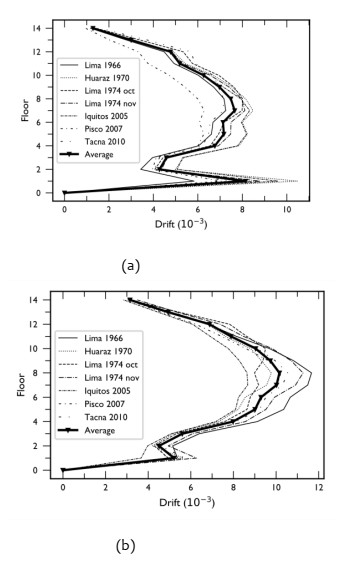
The E-030: Earthquake-resistant design code of Peru established the time history dynamic analysis as the method of structural assessment. This code mentions that the average response is taken when at least seven record earthquakes are used for the analysis. [11]. Figure (5) shows that for longitudinal direction, maximum drifts reach 0.008 on average located at stories one and eight. While for transversal direction, maximum drifts reach 0.010 on average located at story eight.
5. ASSESSMENT OF SENSORS ARRANGEMENT
5.1 WAVELET TRANSFORM ANALYSIS
Predominant frequency bands of the structure depend on the frequency content of the earthquake record. Wavelet transform was applied in all floors, and the roof to select bands contributed to the structure response. Figure (6) shows the signal decomposition in each frequency band for the roof response when adjusted earthquake of Lima 1966 is applied. Every chart in figure 6 shows the relationship between the absolute acceleration and the associated displacement for the bands in the roof. The suitable bands were selected observing which contribute to the floor or roof response according to the Acceleration vs. Displacement graph. It was determined that selecting the 3rd, 4th, 5th, 6th, and 7th frequency bands is the best combination to evaluate the response of all floors and the roof after an earthquake. Although bands are the same for all floors, their contribution can be varied.

The Wavelet transform method was used mainly to identify the bands that contribute to the structure response, avoiding those that contain noise. The response obtained by modeling represents an acceleration without any noise. The acceleration was altered using white noise with amplitudes up to 15 cm/s2, to emulate the actual conditions of recorded signals by the implemented network. Figure (7) shows the altered signal representing the signal with white noise, the original signal representing the response obtained by modeling, and the reconstructed signal-wavelets obtained using the selected bands. It is shown that using selected bands the hysteresis is approximately the same as those from the model response.
5.2 ASSESSMENT OF PROPOSED SENSORS ARRANGEMENTS
The relationship between story - shear and drift of each floor can be estimated with certain accuracy depending on the arrangement of sensors. The accuracy’s assessment of the arrangements was evaluated using a fitness index defined in equation (5). Where  and
and  are the maximum positive displacement, the minimum negative displacement, the maximum acceleration, minimum acceleration and the maximum absolute drift respectively. While and
  represent the maximum positive interpolated displacement, the minimum negative interpolated displacement, the maximum interpolated acceleration, minimum interpolated acceleration and the maximum absolute interpolated drift respectively. The relationship between story - shear and drift is better while the fitness is close to the unit.
Monitored buildings with limited sensors could install its accelerometers in regular intervals for structures with regular stiffness in height [4], [6]. The HERM structure has 13 floors and a roof with a considerable different stiffness in its first floor due to its height, which is 5.3 m unlike the typical floor whose high is 3.1 m. For this reason, it is recommendable to define the first accelerometer in the ground and the second must be in the roof of the first floor. The shown arrangements in TABLE IV were proposed as study arrangements from this condition. It was evaluated arrangements with three, four, five, six and seven sensors. Then the optimal arrangement of a determined quantity of accelerometers were compared. Figure (8) shows the achieved fitness index in each floor for the optimal arrangement. It was shown that from six sensors the fitness index did not improved considerably. For that reason, it was decided to choose the arrangement with seven sensors. Furthermore, in the HERM case the best combination of sensors is not necessarily distributed at regular intervals.
The arrangement of seven sensors, which were located at the ground and the roof of the first, second, fourth, eighth, thirteenth and fourteenth roof, were used in the study. Thanks to wavelets transform and the interpolation, the acceleration and displacement were obtained avoiding noise bands for all floors. It is important to mention that it is better to interpolate from the filtered integrated displacement of the instrumented floors instead of integrating interpolated acceleration because this increases the error in the obtained displacement. Figure (9) shows the interpolated displacement from the known acceleration.
Knowing the acceleration and displacement, the shear force in each story and the drift can be estimated to represent the capacity curve. Figure (10) compares the relation between story - shear and drift calculated by the proposed methodology and the obtained from the model in the software Stera 3D when adjusted earthquake of Lima 1966 is applied. It was shown that from the known acceleration recorded by sensors well distributed, the relationship between story - shear and drift for all floors can be estimated precisely.
Fig. 9 Recorded and interpolated displacement in each floor and roof for adjusted earthquake of Lima 1966
5.3 ARRANGEMENT OF SENSORS TO GET GLOBAL CAPACITY CURVE
Additionally, to the analysis shown in the previous section, this part shows the arrangement to obtain the global capacity curve using a limited quantity of sensors. Unlike the proposal of using seven accelerometers to get a detailed assessment for floors in the building, the global capacity curve can be evaluated in the linear-elastic and nonlinear range using four sensors distributed at regular intervals [4]. The proposed arrangement for this section includes four sensors located at the base and the roof of the floors four, nine and fourteen. The followed procedure also includes applying wavelets transform to get the response of the main mode. The interpolation also is applied to calculate the acceleration of the no instrumented floors. Finally, the equivalent model of one degree of freedom can be calculated [3]. Figure (11) shows the global capacity curve obtained by the analysis for Lima 1966 and Huaraz 1970 earthquake record adjusted for a UHS with 2475-year return period. It can be observed that the regular arrangement of four sensors can represent the response very precisely like the case in which all floors are instrumented.
Fig. 11 Global capacity curve of HERM for adjusted earthquake records. (a) Lima 1966, (b) Huaraz 1970
Figure (12) shows the variation of the period while the spectral displacement increases. Due to the reached displacement, there was a light increment of the period, this variation can be appreciated better for Huaraz 1970 earthquake record.
6. RESULTS
6.1 WAVELET TRANSFORM METHOD ANALYSIS
Wavelet transform method is used to identify main frequency bands because noise bands can be eliminated. However, in the same way the residual displacement is suppressed. Figure (13) shows that there is a little residual component at the end of the displacement, which is suppressed by the wavelet transform. This suppression is more evident when the structure presents higher damages. Although the residual displacement is prevented, wavelets transform provided a suitable reconstruction of the response displacement for evaluated earthquakes in HERM. TABLE V shows the bands that contributed the most for the longitudinal direction response in the analysis with Lima 1966 scenario for each floor. The band columns start with the band which has the major contribution. In HERM, for all floors the band 6 contributed the most. Band 6 includes frequencies since 0.39 to 0.78 Hz. This band contributed the most because the main mode is contained in this band, the main longitudinal mode frequency is 0.60 Hz. It can be also observed that the second band which contributes the most can vary along the structure’s height. As a result, it was determined to use the set of bands 3, 4, 5, 6 and 7 for all floors.
6.2 CAPACITY CURVE WITH A LIMITED NUMBER OF ACCELEROMETERS
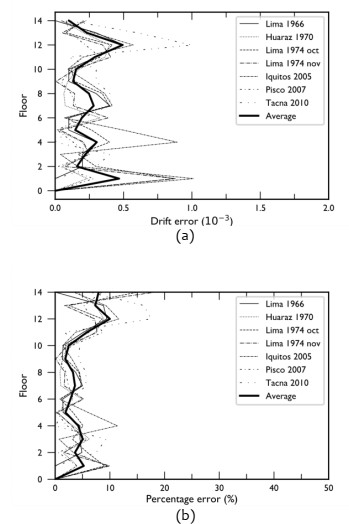
The studied proposal represented the stories response using just the acceleration provided by well distributed sensors. Being able to determine the drift of all floors is important in structural analysis because it is linked to damage level. In countries like Peru, the codes establish maximum drift for designing. Although, when it comes to HERM, a designed structure in 1950, observing just story drift is not enough but is important because the capacity curve depends on the drift and maximum force. The analysis showed that the proposal can estimate the drift with an average error of 10% for studied earthquake records. Figure (14) shows the percentage and drift error. Figure (14.a) shows that the maximum average error is located at the higher stories. The average drift error is 0.0005, representing a bigger percentage because the drift of the higher stories is minor.
CONCLUSIONS
The contribution of a determined frequency band to the reconstruction of the signal will vary with the features of the earthquake record (amplitude and frequency). For studied earthquake records, the combination of bands does not change due to these records having similar site conditions. However, if the earthquake record features change, frequency band combinations could differ. For this reason, it is important to identify the sensibility of each band in the structural response.
Seismic records studied had their principal periods between 0.09 s and 0.12 s, similar to the HERM soil conditions. In contrast, the structure has high periods, in the first period has 1.64 s, and in the second period 1.68 s.
Maximum story drifts for the seismic records matched to UHS with a 2475-years return period were 0.0117 and 0.0105 for transversal and longitudinal direction, respectively, which occurred on the eighth story.
For the evaluated building, HERM, it was determined that the predominant wavelets bands to obtain the structural response avoiding noise are: 3 (3.13 - 6.25 Hz), 4 (1.56 - 3.13 Hz), 5 (0.78 - 1.56 Hz), 6 (0.39 - 0.78 Hz), and 7 (0.20 - 0.39 Hz). The residual displacement cannot be evaluated because the Wavelet transform process suppresses it.
For HERM, the optimal arrangement to estimate the relationship between story - shear and drift for each floor was using 7 sensors, one in the base and the others located in the 1st, 2nd, 4th, 8th, 13th story roof and one on the top roof, and 4 sensors were sufficient to estimate the global capacity curve from the HERM block of 14-story, according to its fitness factor.

