


 Inglês (pdf)
 Artigo em XML
 Referências do artigo
 Enviar este artigo por email
 Citado por SciELO
  Similares em
SciELO
Similares em
SciELO 
 Permalink
1. INTRODUCTION
Seismic response analysis is one of the most common problems in earthquake geotechnical engineering and it is especially important for sites with high seismic activity, such as countries located in the so-called Pacific Fire Ring, as is the case of Peru. In general, site response analyses are performed considering a propagation of a predefined input motion from the engineering bedrock through the overlying soil, in order to obtain a surface intensity index. This procedure allows the prediction of ground surface motions characteristics for a predefined level of seismic hazard expected in the site of study.
Typically, the required input motion is obtained from processing a set of selected accelerograms to match the Uniform Hazard Spectrum (UHS) defined from a seismic hazard analysis performed for the site under study. This method, hereinafter referred to as time-series, requires to have a minimum number of records to achieve a statistically strong estimation. Unfortunately, CISMID seismic network (REDACIS), as well as others deployed in Lima city, have so far generated scarce seismic information related to events with considerable values of moment magnitude.
In this context, the Random Vibration Theory (RVT) arises as an alternative method for seismic response analyses that can be performed by only requiring the UHS from Probabilistic Seismic Hazard Analysis (PSHA) and a strong motion duration.
RVT was originally applied in seismology by Hanks and McGuire#091;1#093; to predict peak ground motion parameters based on the earthquake magnitude and site-to-source distance, and further developed by Boore#091;2#093; and Boore & Joyner#091;3#093;. Schneider et al.#091;4#093; applied RVT to site response analysis to simulate site-specific acceleration response spectra by defining the input motion based on a seismological source theory to be later convolved. Thus, Fourier amplitude (FAS) and response spectra could be estimated by means of RVT. Later studies, e.g. Silva et al.#091;5#093; and Rathje & Ozbey#091;6#093;, validated RVT procedure for seismic response analysis, although it requires seismological parameters to be carefully chosen in order to be consistent with the site-specific seismic hazard at rock level.
To overcome the need of adjusting multiple seismological parameters, Rathje & Ozbey#091;6#093; developed the Inverse Random Vibration Theory (IRVT) to convert an acceleration response spectrum into a frequency domain FAS, which is a simpler form to define the input motion for the seismic analysis using RVT. The application of RVT has dramatically increased in time. For example, the nuclear industry has been switching to the RVT-based approach to perform the seismic response analysis as an alternative to the time-series method over the last years.
The first approach to RVT application in earthquake engineering in Peru was carried out by Chavez#091;7#093;. in which the response spectra from a batch of recorded seismic events were obtained. In addition, theoretical response spectra, based on the RVT and the omega square (ω2) seismological model#091;8#093;#091;9#093;, were computed. Chavez#091;7#093; also performed a sensitivity analysis of the seismological parameters from the single corner frequency model to maximize the fit between the recorded and the theoretical response minimizing the standard deviation obtained through the Bayesian linear regression.
In this context, the objective of this research is to perform site response analysis using the RVT methodology, incorporated in the software Strata#091;10#093;, on three representative and well differentiated soil profiles in Lima. Reliability of RVT is performed by the comparison of the spectral shape of the results with the pseudo-acceleration spectra from signals recorded in stations nearby the studied sites, for moderate to strong seismic events, and those from previous site response studies. Furthermore, sensitivity analyses, with respect to the duration of the seismic record and the shear-wave velocity (Vs) of the engineering bedrock, are also evaluated.
2. METHODOLOGY
2.1 Probabilistic seismic hazard analysis
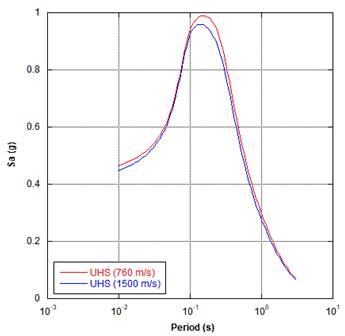
Uniform Hazard Spectrum (UHS) and seismic disaggregation were obtained from the study of seismogenic regions, recurrence laws, attenuation laws and their ponderation proposed by Roncal#091;11#093;. Seismic response analysis included a sensitivity evaluation to consider the influence when varying the stiffness of the engineering bedrock for two cases: soil type A (Vs>1500 m/s) and type B (Vs>760 m/s), according to ASCE 7-16#091;12#093;. Consequently, PSHA and seismic disaggregation were performed for each of these cases for a 10% probability of exceedance of a seismic event of 500 years return period. In Figure 1, UHS obtained from the PSHA are presented. As expected, the acceleration spectrum was slightly higher for the type B soil in a narrow period range so it can be considered that there was no significant difference in the seismic scenario identified as critical from the seismic disaggregation.
The urban area of Lima city is mainly composed of one to five story buildings that are typically characterized by fundamental periods that range from 0.05 s to 0.50 s. For this range of interest, the seismic scenario with the highest contribution to the seismic hazard is represented by an interface scenario of 50 km closest rupture distance (Rrup), 90 km hypocentral distance (Rhypo) and 7.9 seismic moment magnitude (Mw).
2.2 Ground motion duration
Ground motion duration is an important input for the RVT-based seismic response analysis. For this research a sensitivity analysis was performed considering two approaches. First, duration was defined based on the ground motion model given by Campbell#091;13#093;, which includes source and path duration. On the other hand, a second procedure was considered, based on the attenuation law developed by Boroschek et al.#091;14#093;.
2.2.1 Ground motion duration model
Ground motion duration includes two terms: source (T0) and path (Tr) durations, as

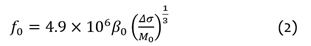
Source duration (T0) is the inverse of the corner frequency (f 0). If the seismic source is assumed to come from a point source, the Brune model#091;8#093; can be used to calculate the corner frequency as follows
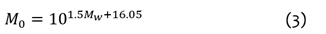
where β0 is the shear wave velocity of the crust in km/s, ∆σ is the stress drop in bars and M0 is the seismic moment in dinas.cm. Chavez#091;7#093;, based on a sensitivity analysis and comparison of recorded and calculated response spectra, concluded that the seismological parameters that best fit the Peruvian seismic environment are β0 = 3.9 km/s and Δσ= 185 bars.
The seismic moment correlates with the seismic moment magnitude (Mw) under equation (3). As stated by Rathje et al. #091;19#093;, the single corner frequency model has produced accurate results.
Path duration depends on the hypocentral distance (R hypo ) and can be estimated from
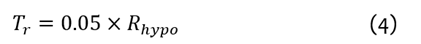
where R hypo is defined in km.
The duration for the seismic scenario that provides the highest contribution to the seismic hazard in the range of periods of interest (Mw=7.9 and Rhypo= 90 km) is 15 s.
2.2.2 Ground motion duration attenuation law
Boroschek et al.#091;14#093; developed an attenuation law for strong ground motion duration based on a dataset of seismic records in Chile. This duration is defined as the time lapse in which energy, within the range of 5% and 95% based on the Arias intensity, is released. The formal function depends on the seismic scenario pair (closest rupture distance and moment magnitude), as presented as follows
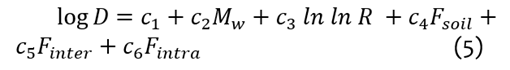
Where F soil , F inter and F intra are binary variables that are defined based on the site conditions and seismic scenario. The coefficients are summarized in Table I.
For the study site, the evaluation was performed for the engineering bedrock and the seismic scenario pair (Mw and Rhypo) of the interface event that provides the highest contribution to seismic hazard level. Based on this approach, the duration for the strong motion resulted as 24 s.
2.3 Random vibration theory
RVT uses the Parseval theorem and Extreme Values Statistics (EVS) to predict the maximum acceleration in the time domain from the Fourier Amplitude Spectrum (FAS) and duration of the considered motion. The following is a summarized discussion about RVT. Further details can be found in #091;15#093; and #091;16#093;.
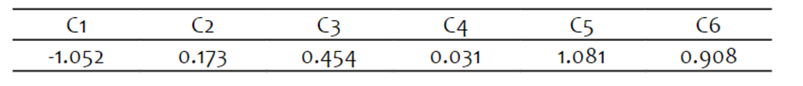
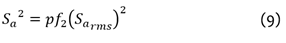
Parseval's theorem states that the power of a seismic signal is conserved in frequency and time domain. Hence, total power can be computed in either domain. The root mean square acceleration (
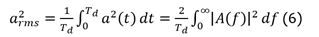
RVT defines the peak factor (pf) as the ratio between

2.4 Inverse random vibration theory (IRVT)
IRVT converts an acceleration spectrum to a Fourier Amplitude Spectrum (FAS) in the frequency domain. This process is not as straightforward as RVT. In order to achieve this inverse process, there are two limitations: the spectral accelerations are influenced by a range of frequencies and the peak factor cannot be calculated from the very beginning since it requires a Fourier Amplitude Spectrum.
In RVT, the peak spectral acceleration (
To determine the
where |H fn (f)| is the transfer function of a SDOF oscillator with natural frequency (f n ) and critical damping ratio ξ.
A first limitation is observed in (9). Spectral acceleration is affected by a range of frequencies in the FAS; thus, the estimation is not straightforward. However, some properties of the SDOF transfer function can be used to overcome this limitation. Typical transfer function of a SDOF has a narrow band for lightly damped systems and goes near to a value of 1 for low frequencies. In addition, large amplification exists near the natural frequency and tends to zero for higher frequencies. Using these properties, an approximation to the integral in (9) can be presented
The transfer function integral is constant for a given natural frequency and damping ratio, allowing to simplify (10) as follows
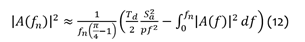
The second limitation is solved by assuming the peak factor to estimate the initial Fourier Amplitude Spectrum. Typically, the iterative process is initiated by assuming a pf of 2.5. Further discussion regarding the methodology is included in #091;16#093; and #091;19#093;.
RVT and IRVT procedures are included in the Strata software, developed by Rathje and Kottke#091;10#093;, and were utilized in this study.
2.5 Seismic response analysis
One-dimensional wave propagation can be computed in the frequency domain using transfer functions for multi-layered soil deposits or in the time domain using multiple-degree-of-freedom (MDOF) dynamic response analysis. Due to the nature of the RVT-based analysis, convolution must be performed in the frequency domain, as no phase content is defined through this method. For the convolution, the equivalent linear analysis (EQL) is performed to account for the nonlinear behavior of the soil. This formulation is extensively discussed in #091;20#093;.
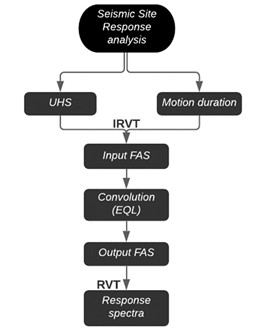
Seismic response analysis is performed specifying an input motion at the base of the soil deposit defined as the calculated FAS of the acceleration spectrum for the engineering bedrock using the IRVT. Then, the input motion is propagated through the soil profile using the EQL formulation as implemented, for example, in Deepsoil#091;21#093; software. Finally, FAS at surface obtained from the EQL analysis is converted into acceleration spectrum using RVT. The aforementioned is presented in the workflow in Figure 2.
3. Site characterization
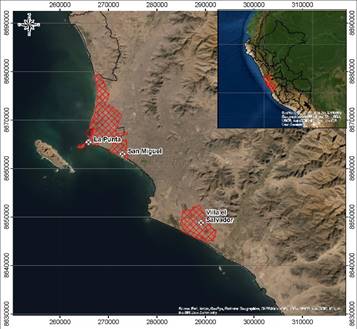
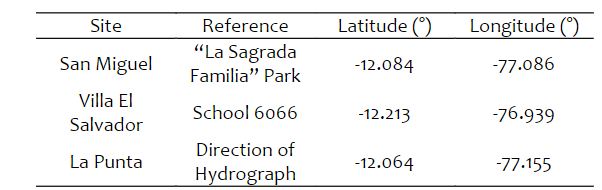
Location of the evaluated sites is summarized in Table II and Figure 3.
The characterization of each profile was based on available information and complementary field surveys performed as part of this research.
3.1 Collected data
Collected data comprises previous studies, explorations (direct and indirect tests) and laboratory tests. In-situ explorations gathered data such as soil pits, boreholes and geophysical tests (active and passive source).
La Punta profile was adapted from the characterization of the DHN profile developed by Soto#091;22#093; which was based on two drill holes located near the study site#091;23#093; and the dynamic small strain properties from MASW tests#091;22#093; for the surficial layers and a microtremor array#091;24#093; for the deeper part.
Similarly, Villa El Salvador profile was also adapted from the characterization of the profile developed by Soto#091;22#093;. The profile was geotechnically interpreted mainly from a drillhole#091;25#093; and a microtremor array#091;24#093;. To complete the dispersion curve obtained in Calderon#091;24#093;, complementary microtremor array measurements were conducted within the framework of this study which are further discussed in the field survey section.
San Miguel profile was characterized based on two boreholes located near the study site and a test pit#091;23#093;, and the small-strain dynamic properties were inferred from a MASW#091;23#093; for surficial layers. The small-strain dynamic properties for the deeper part were interpreted from microtremor arrays carried out as part of this research and of Sencico project#091;26#093;. This survey is also further discussed in the following section.
3.2 Field surveys
Field surveys included microtremors array tests performed in San Miguel and Villa El Salvador. Two types of sensors were used: the moving-coil velocimeter CR 4.5-1A and the servo velocimeter CV-374 AV2, manufactured by Anet Co., Ltd. and Tokyo Sokushin Co., Ltd., respectively. Microtremor arrays in San Miguel included linear and circular shapes which allowed us to interpret the dispersion curve of surface waves up to a period of 0.50 s. Larger microtremor arrays#091;26#093; were performed to complete the dispersion curve up to a period value of 0.70 s.
Circular microtremor arrays in Villa El Salvador adequately completed the dispersion curve obtained by Calderon et al.#091;24#093; within the range of 0.50 and 1.0 s. Good overlapping was observed between the measured and the reference dispersion curve assuring the reliability in the estimated shear-wave velocity values for deeper layers. Information regarding size and sampling frequencies for the conducted arrays are summarized in Table III. Figure 4 presents the sensor distribution for San Miguel and the location of a vertex sensor for Villa El Salvador.
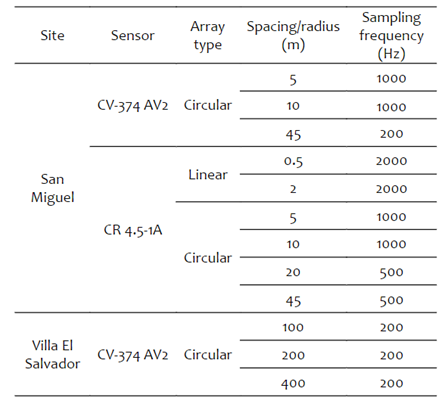
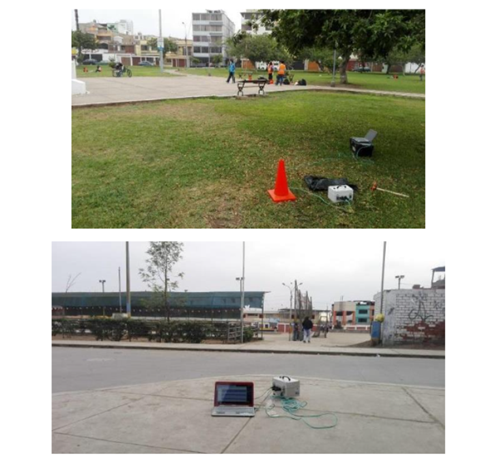
Fig. 4 Field survey photographs. a) San Miguel 20 m array configuration. b) Villa El Salvador vertex sensor for the 200 m-array
3.3 Sites profiles
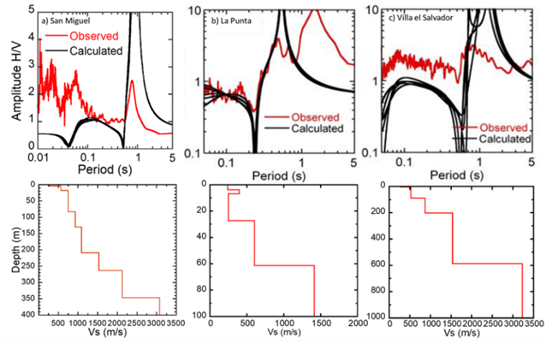
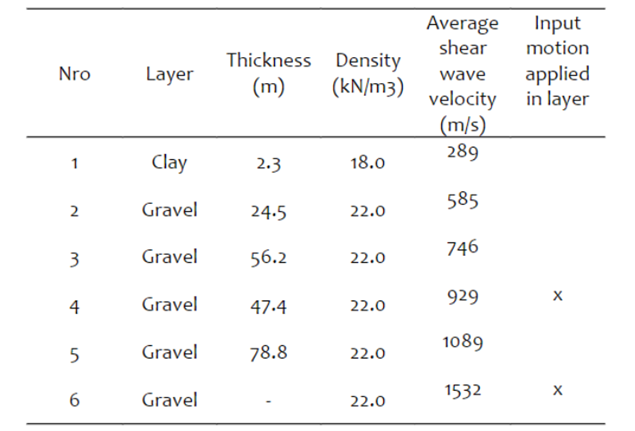
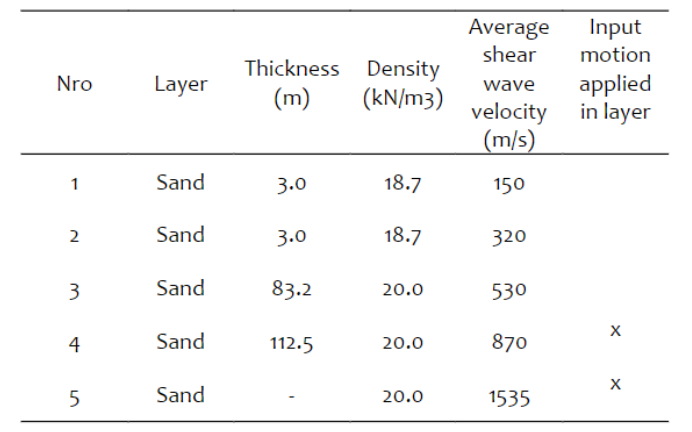
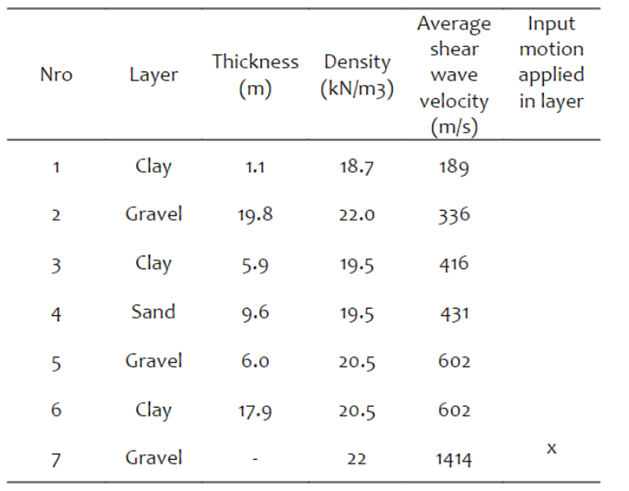
Information about the estimated profiles in San Miguel, Villa El Salvador and La Punta is summarized in Table IV, Table V and Table VI, respectively. Figure 5 shows the shear wave velocity profiles and the horizontal-to-vertical spectral ratio from microtremors (mHVSR) for each site. It is important to highlight that the peaks in the long period range are evident for each profile, as these are representative of the dynamic behavior of the deep soil profiles that are potentially not captured by the soil classification system based on the Vs30 only.
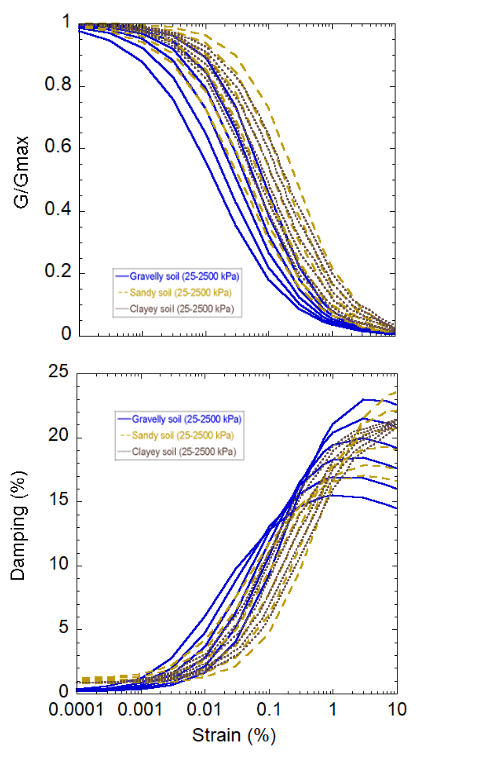
Seismic analyses were carried out considering the dynamic properties degradation curves proposed by Menq#091;27#093; for gravelly and sandy soils, whereas Zhang model#091;28#093; was used for clayey soils. Based on laboratory tests and technical literature available, index properties were selected for sandy (Cu = 2.2, D50=0.17 mm#091;25#093;), gravelly (Cu=10#091;22#093;#091;29#093;, D50 = 30mm#091;22#093;#091;29#093; #091;30#093;) and clayey soils (PI = 10#091;22#093;#091;25#093;). Figure 6 presents the shear modulus degradation and damping curves defined for analyses.
4. RESULTS
For each site, acceleration spectra from the RVT-based seismic response analysis were compared with the design spectra from the Peruvian seismic design standard#091;31#093;. In the case of Villa El Salvador and La Punta, additional comparison was made considering the acceleration spectra from a previously developed study based on time series analysis#091;22#093;. It is noted that the UHS used in this research has larger amplitudes than the considered in Soto#091;22#093;; thus, the comparison is mainly focused on the spectral shape, as the amplifications in this research are expected to be higher. Furthermore, seismic events with distinct epicentral distances and recorded in stations located nearby the evaluated sites were also used for comparing shapes of the RVT-based normalized spectra. The decision was made since the analyzed earthquakes produced responses significantly lower than an event for 500 years return period with 10% probability of exceedance.
TABLE VII Seismic records evaluated for the comparison and validation of RVT-based seismic response analysis
Table VII summarizes the profile classification of each site according to the Peruvian standard#091;31#093;, details regarding the stations near the evaluated sites and the recorded seismic events.
San Miguel RVT-based spectrum performed for engineering bedrock type B fits adequately under the design spectrum. Conversely, the spectrum for type A shows a slight difference around 0.80 s (Figure 7a.). This difference might be due to the influence of the deeper soil substructure in the amplification around the fundamental period, which is not taken into account when considering type B bedrock. However, this difference correlates well with the behavior found in seismic records for intermediate- and far-field earthquakes, such as the Ml 5.8 Mala (22/06/21) and Mw 8.0 Lagunas (26/05/2019) events (Figure 7b.). The maximum strain values are observed in the range of depths between 60 m and 80 m (Figure 7c.), where the first noticeable impedance ratio, from 746 m/s to 929 m/s, is found in the San Miguel profile (Figure 5).
In the case of Villa El Salvador, the RVT-based response spectra fits adequately under the design spectrum and shows good agreement with the results from the time-series analysis#091;22#093;, though some discrepancy is found for the intermediate period range from 0.50 s and 1.0 s when considering an engineering bedrock type A (Figure 8.a).
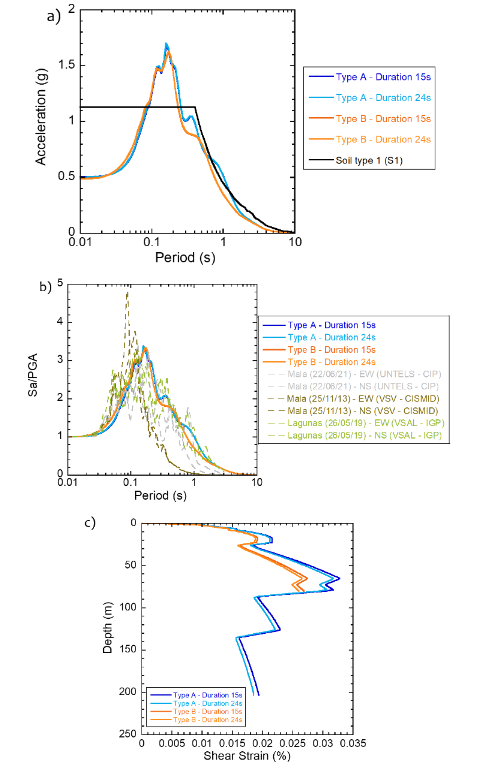
Fig. 7 RVT-based seismic response analysis for San Miguel. a) Response spectra compared with design spectrum. b) Normalized response spectra compared with those from seismic records. c) Maximum shear strain distribution
The normalized spectrum for the RVT-based analysis shows better agreement with the spectra of the Ml 5.8 Mala (25/11/13) earthquake in the range of periods above 0.15 s, when compared with the results from Mw 8.0 Lagunas (26/06/19) and Ml 5.1 Callao (25/08/21) events. This appears to be reasonable as the hypocentral distance of the event is close to the scenario evaluated from the seismic disaggregation for this study, although the magnitude is significantly smaller. Conversely, spectra for the three events show high amplification values in the low period range which seems to be independent of the epicentral distance and magnitude. Therefore, it is suspected that these apparent high amplifications are due to the normalization of the noise with respect to the low acceleration level recorded in the seismic stations (Figure 8.b). The maximum values of strain are evidenced in the upper 10 m of the profile. Good agreement is observed between the shear strain profile of the RVT-based analysis and the time-series analysis developed in #091;22#093; (Figure 8.c). The differences observed between 70 m and 90 m were due the modification of the soil profile to better adjust the Vs profile from Calderon#091;24#093;.
Finally, La Punta RVT-based analysis performed for the engineering bedrock type B also shows good agreement with the results obtained by Soto#091;22#093;. On the other hand, it is observed that amplification factors for the computed spectra exceed those from the design spectra in a period range from 0.60 s to 0.80 s, i.e. around the corner period defined in the Peruvian seismic code (Figure 9.a).
The normalized spectrum for the RVT-based analysis shows better agreement with those for seismic events in the period range between 0.10 s and 0.80 s (Figure 9.b). A sharp peak is observed around 0.25 s for the Ml 5.8 Mala event (22/06/2021) recorded in D855 (CIP) and DSMI (CISMID) stations located about 1.2 km from the study site. This agrees well with the shape of the normalized spectrum from the RVT-based analysis. Even though a high variability in the soil profile of the study area is observed, our response spectra based in RVT can be considered as an envelope of the overall behavior. On the other hand, records for the Mw 8.0 Lagunas earthquake show amplification around 1.40 s, which might be related to the low frequency content caused by this far-field event. On the other hand, all seismic events show high amplification for periods shorter than 0.10 s. This characteristic seems to be independent of the hypocentral distance and magnitude and can be also associated, as in the previous cases, with the normalization of the noise with respect to the low acceleration level recorded. Finally, the maximum strains are evidenced in the upper 20 m of the profile. Lower strain values were obtained when compared with those from a time-series analysis#091;22#093;, which might be associated with the implementation of different types of dynamic curves for each study.
As previously observed from the analyses, the influence of the deeper soil substructure is not captured by the design spectra from the Peruvian seismic design standard. Thus, it might be adequate for the soil classification criteria to include additional indexes, such as the fundamental period of vibration. Currently, some efforts have been made on this matter, as can be consulted in Verdugo & Peters#091;32#093; and Ruz & Liam#091;33#093;.
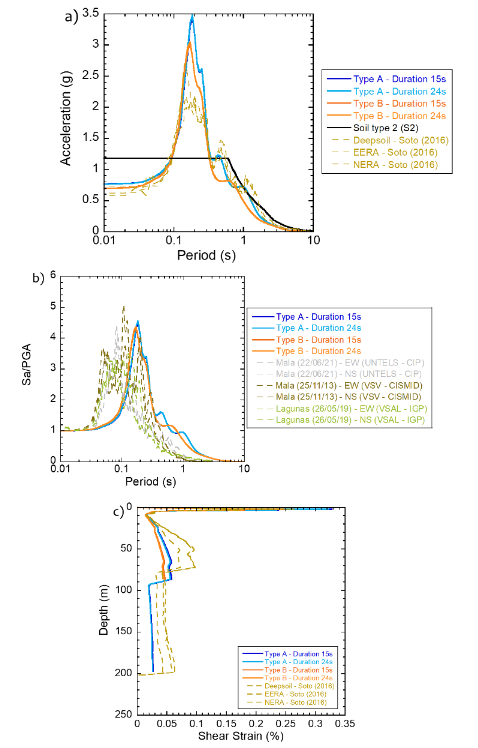
Fig. 8 RVT-based seismic response analysis for Villa El Salvador. a) Response spectra compared with design spectrum and time-history analysis#091;22#093;. b) Comparison of normalized response spectra and those from seismic records. c) Maximum shear strain distribution
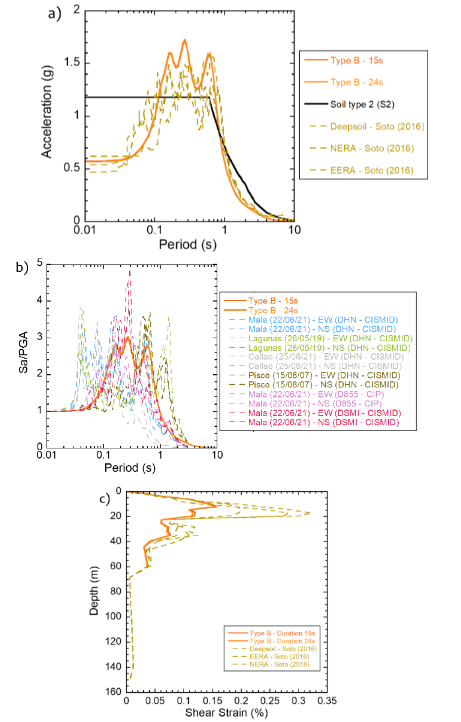
Fig. 9 RVT-based seismic response analysis for La Punta. a) Response spectra compared with design spectrum and time-history analysis#091;22#093;. b) Comparison of normalized response spectra and those from seismic records. c) Maximum shear strain distribution
CONCLUSIONS
Random Vibration Theory (RVT)- and time series-based analyses show good agreement in terms of response spectra and maximum shear strain profile shapes. In addition, RVT-based response spectral shapes show consistency with the response spectra from seismic records, despite the differences in the short (below 0.10 s) and long (above 0.80 s) period range that could be related to urban noise and far-field effects, respectively. In general, RVT-based seismic response analysis using the Inverse Random Vibration Theory (IRVT) to define the input motion do not show significant sensitivity of the seismic response spectrum with respect to the duration of the motion for the evaluated sites.
Villa El Salvador and La Punta had available records from nearby stations. In the case of Villa El Salvador, good agreement between results from accelerograms recorded in two different stations was observed, indicating a consistently homogeneous soil deposit. Conversely, seismic records in La Punta displayed different peaks in the acceleration spectra from the stations that recorded the same event, which indicates a variable soil deposit. San Miguel had available records from a station located 3.3 km away from the study site. The evaluated records showed good agreement with the analysis response spectrum, indicating a homogeneous soil deposit. From the obtained results, it is recommended to consider additional parameters to take into consideration the influence of the deeper part of soil profiles in seismic characterization, since indexes, such as vs30, captures the impact of the surficial profile only.
Finally, within the framework of this research, RVT showed to be a viable alternative to perform seismic response analysis as it only requires the implementation of Probabilistic Seismic Hazard Analysis. Results are promising for the evaluated profiles and complementary estimations for profiles with distinct geomorphological characteristics are expected to be evaluated in the future.

