


 Inglés (pdf)
 Articulo en XML
 Referencias del artículo
 Enviar articulo por email
 Citado por SciELO
  Similares en
SciELO
Similares en
SciELO 
 Permalink
INTRODUCTION
Earthquakes are a significant threat to our society and as a response many innovative technologies have been developed for seismic hazard mitigation.
Seismic isolation has proven to be a reliable design and retrofit strategy to improve the seismic performance. This design strategy has been widely adopted in South America since the 2010s. Several types of seismic isolators have been used in a range of bridge infrastructure projects with the aim of providing the lateral flexibility that lengthen the fundamental period of the structure to reduce the seismic demands drastically. In addition, these devices are capable of dissipating energy and providing lateral resistance to service loads.
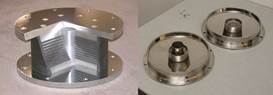
Currently, the most widely used isolators in South American bridge infrastructure are the elastomeric and sliding bearings. Among these types of isolators, Lead-Rubber Bearing (LRB) and Friction Pendulum Bearing (FPB) are the most widely adopted. Despite having the same goal, the unique working mechanism is different in each case. LRBs lengthen the period of the structure by means of its rubber layers and dissipate energy by the melted state of its lead core. In contrast, FPBs dissipate energy through friction and shift the period due to the pendulum movement induced by its concave surfaces [1].
Previous works have been carried out to compare the different seismic performance levels induced by LRB and FPB isolation systems [2], [3]. However, these trends in the induced seismic responses have not been validated in the specific case of comparing Triple Friction Pendulum Bearings (TFPBs) with LRBs in isolated bridges.
With the aim of complementing the mainstream design practice of isolated bridges, two seismic isolation retrofitting solutions using LRBs and TFPBs were compared comprehensively. In this study, a comparative seismic performance assessment of an isolated three-span bridge was carried out using a deterministic approach. In the design of the isolators, a common design criteria, established by Eröz and DesRoches [2], were followed to compare the unique effects of each isolation system. In the numerical model of the isolated bridge, a simple bilinear hysteretic model was used to model the LRBs and an assemblage of single friction pendulum bearings (SFPBs) for the TFPB modelling. A series of nonlinear time history analyses were performed considering seven ground motion records. From the results, the maximum isolator displacements (MID), the maximum isolator forces (MIF), the maximum distortions in the columns (MDC), the maximum accelerations in the deck (MAD), the maximum residual isolator displacements (MIR) and the maximum abutment-pier shear force ratio (MRF) were compared.
2. HYSTERETIC MODELING OF ISOLATORS
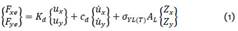
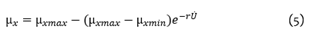
The hysteretic model developed by Bouc-Wen [4] is the basis to describe the hysteretic behavior of elastomeric and sliding isolators. In the case of LRBs, the hysteresis [5] is described through the following equation:
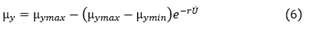
On other hand, the hysteretic behavior of SFPBs [6] is represented as follows:
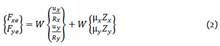
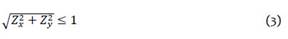
Both hystereses depends on two dimensionless hysteretic variables, Z x and Z y , as proposed by Park et al. [7] for coupled bidirectional systems. These dimensionless variables are restricted to have a range and obeys a set of equations described by (3) and (4).
From equation (4), constants A, β and γ, called evolution constants, control the shape of the hysteretic loops.
To gain insight in the modelling of LRBs, the upper and lower bound approach adopted for the LRB case, that uses a simple bilinear hysteretic model [8], was compared with the results obtained with the model developed by Kalpakidis et al. [5]. This last model is able to capture the cycle-by-cycle strength reduction due to lead core heating effects. To perform this comparison, the hysteretic model which simulates the strength degradation [5] was implemented in MATLAB and the simple bilinear hysteresis was simulated using SAP2000 [8]. In this last hysteresis model, the upper and lower bound values of the LRB mechanical properties are considered through modification factors.

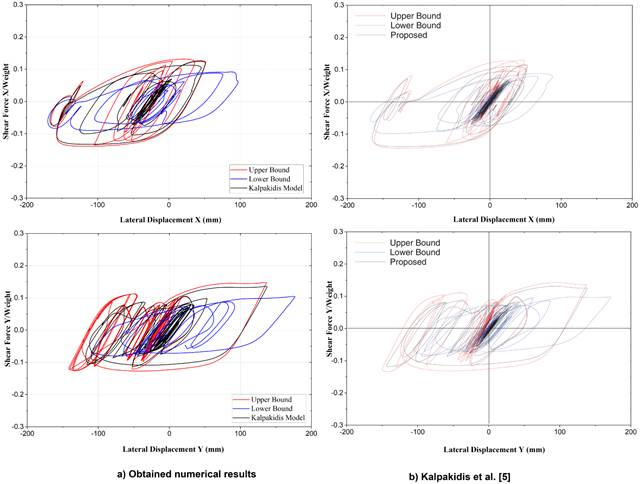
Previously, the implementation in MATLAB was validated [9] with the experimental and numerical results presented by Kalpakidis et al. [5]. The numerical results obtained for the Duzce earthquake seismic record (Turkey, 1978) are shown in Fig. 2. The derived results present a good agreement with the results obtained by Kalpakidis et al. [5], despite of using seismic records from different stations as it was not possible to obtain the same records of the authors. Therefore, the simple bilinear approach can be adopted to simulate the LRB behavior in the subsequent analyses with enough accuracy and less computational effort.
For friction pendulum isolators, the friction coefficient varies between a fast-sliding coefficient,
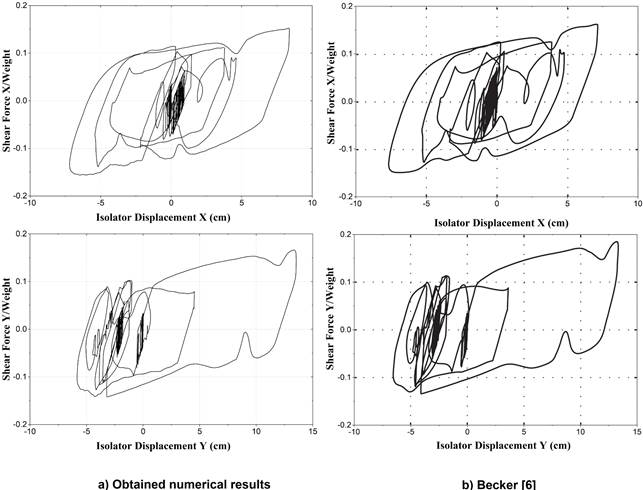
To model the hysteretic behavior of TFPBs, an assembly of SFPBs should be performed. One approach uses SFPBs in parallel and the other in series. In this work, the series model implemented in SAP2000 was used.
In the process of gaining insight in the modeling of TFPBs, the validated numerical results from an experimental campaign performed by Becker [6] were adopted as benchmark results. Here, the results obtained for the Northridge seismic records are shown in Fig. 3 (USA, 1994). The obtained results have a good match with the verified numerical results.
3. DESIGN CRITERIA
A right three-span continuous composite highway bridge [11] was retrofitted adopting a seismic isolation solution to achieve continued functionality after a severe earthquake. Two retrofit strategies were studied, one using LRBs and the other using TFPBs. To perform a deep comparative assessment of the unique effects of each isolator, the design criteria set by Eröz and DesRoches [2] were followed. These criteria states that:
The periods of both isolated bridges should be similar.
The yield force and post-yield stiffness of each isolator should be almost similar.
Uniform bearing sizes should be used in each isolation layout.
In this design, an isolated period of approximately 3 s was set. A displacement-based approach using a unimodal analysis method was adopted during the seismic isolation design [8]. In this case, it was considered that the supported deck of each isolated bridge is resting under two isolators in each support (piers and abutments). The resulting dimensions of the isolators are summarized in Table I and II.
TABLE I Isolator properties LRB
| Pier | Abutment | |
| Isolator diameter (m) | 0.80 | 0.80 |
| Lead core diameter (m) | 0.14 | 0.14 |
| Total thickness rubber (m) | 0.30 | 0.30 |
| Lead effective yield stress (MPa) | 10 | 10 |
| Shear modulus of rubber (MPa) | 0.414 | 0.414 |
4. NUMERICAL MODEL OF THE ISOLATED BRIDGE
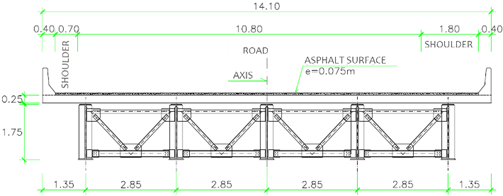
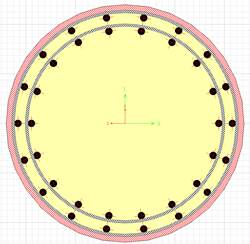
The superstructure of the bridge is continuous and is made up of a steel-concrete composite deck as shown in Fig. 4. This deck consists of two side spans of 35 m and a central span of 50 m. The bridge substructure consists of two typical seat-type abutments and two intermediate piers made up of two circular columns (Fig. 5), which are 120 𝑐𝑚 in diameter and 6.10 𝑚 in height, connected at the top with a 1.50 m deep cap beam. The total weight of the superstructure and substructure is 16760 kN and 1093 kN, respectively.
In order to study the unique seismic response of the two seismic isolation retrofitting solutions for the bridge, two models of the structure were developed, called Model 1, for the LRB case, and Model 2, for the TFPB case.
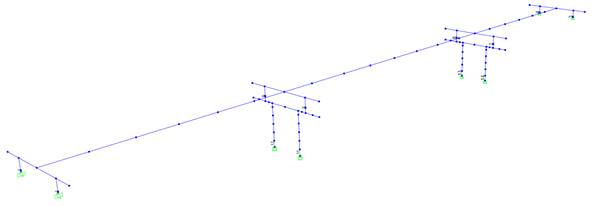
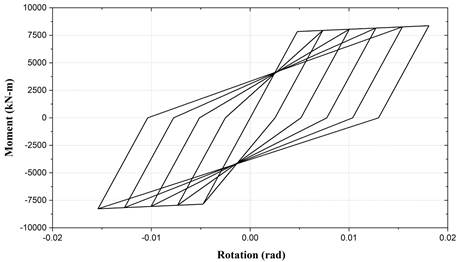
Only beam-column and link elements were considered in the development of the numerical model (Fig. 6), labeled as stick model by Aviram et al. [12]. The superstructure (deck) was model with linear beam-column elements, as it remains in the linear elastic range. In the case of the substructure, the abutments were considered as rigids whereas the piers were assumed as flexible. The cap beams of the piers were modeled using linear beam-column elements whereas the columns were considered to enter into nonlinear range, so that beam-column elements with plastic hinges at its ends were adopted. A lumped plasticity model was considered for the hinges using the Clough’s bilinear hysteretic model [13] shown in Fig. 7.
The seismic isolators were modeled using link elements where the inelastic behavior is concentrated in a zero-length element which is connected to the bottom of the superstructure and the top of the substructure by means of rigid arms.
To obtain the moment-rotation curve of the plastic hinges in the columns, a moment-curvature analysis of the column cross section was performed. This curve depends on the geometric characteristics, the arrangement of the longitudinal and transverse reinforcing steel, the properties of the component materials and the axial load exerted on the section. The model of Mander et al. [14] was used to set the strain-stress curves for confined and unconfined concrete. For the longitudinal reinforcement, the model developed by Dodd and Restrepo [15] was adopted.
In order to estimate the right periods of the structure, the effective flexural stiffness of the columns was assessed using the results obtained from moment-curvature analysis. This effective stiffness is 57% of the gross section stiffness.
A set of nonlinear time-history analyses was performed according to the guidelines set by ASCE/SEI 7-16 [16]. These guidelines state that the Maximum Considered Earthquake (MCE) must be considered in the design. This earthquake has a 2% probability of being exceeded in a 50-year period, which means a recurrence period of approximately 2500 years. In this analysis, the design response spectrum established by the Peruvian Department of Transportation [17] was adopted as the target spectrum. This design spectrum represents a seismic hazard level of 7% probability of exceedance in 75 years. Seven pairs of near-fault seismic records (Table III) were selected for the dynamic analysis as they content large long-period pulses that induce considerable velocity and displacement demands into the structure [18]. In order to attain the seismic-hazard level required, the design spectrum was scaled by a factor of 1.55 [9]. This factor was assessed using the mapped uniform hazard spectra provided in the SENCICO website [19]. After setting the target spectra, the seismic records were scaled to match it over a period range of interest (Fig. 8).
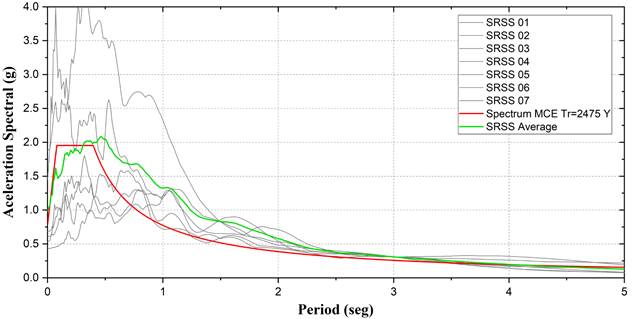
Fig. 8 SRSS elastic response spectrum of the 7 pairs seismic records and the MCE acceleration spectrum.
TABLE III Seven pairs of ground motions used in the seismic analysis
| Code PEER # | Name of the accelerogram | Station | MW | Rrup (km) |
| RSN126 | 1976 Gazli USRR | Karakyr | 6.8 | 5.46 |
| RSN779 | 1989 Loma Prieta | LGPC | 6.93 | 3.88 |
| RSN803 | 1989 Loma Prieta | Saratoga, W. Valley Coll. | 6.93 | 9.31 |
| RSN982 | 1994 Northridge | Jensen Filter Plant | 6.69 | 5.43 |
| RSN1085 | 1994 Northridge | Sylmar, Coverter Sta. East | 6.69 | 5.19 |
| RSN1119 | 1995 Kobe Japan | Takarazuka | 6.90 | 3.00 |
| RSN1602 | 1999 Duzce Turkey | Bolu | 7.14 | 12.4 |
The nonlinear analyses were performed using the Fast Nonlinear Analysis (FNA) method implemented and adopting a Rayleigh damping which overrides the isolated modes. This type of analysis is convenient due to the nature of the structure that concentrates the inelastic deformations only in the isolators, which allows obtaining computational accuracy and speed in comparison with other non-linear time-history methods [20].
5. NUMERICAL RESULTS
For the time-history analyses, the upper and lower bound properties were considered by means of modification factors. Through this way, the maximum absolute values in terms of displacement and shear forces were obtained. Table IV shows the lambda factors adopted in this analysis [21].
TABLE IV Property modification factors for both isolators
| Lead Rubber | Friction Pendulum | |||
| G |
|
|
|
|
|
|
1.83 | 1.84 | 2.12 | 2.12 |
|
|
0.76 | 0.76 | 0.6 | 0.6 |
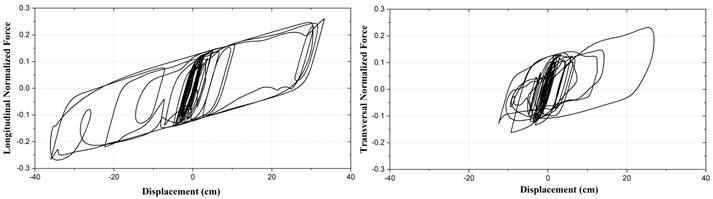
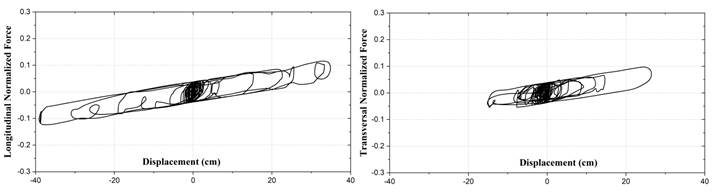
The isolators experienced the same seismic demands along the same transverse axis and symmetrically along the longitudinal axis. Therefore, the results are presented for one of the isolators located on one of the piers and one of the abutments. The isolator hysteresis from one of the nonlinear time history analyses is shown in Fig.9 and Fig.10.
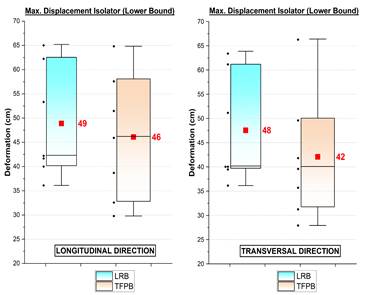
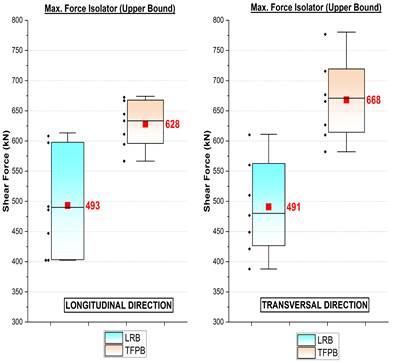
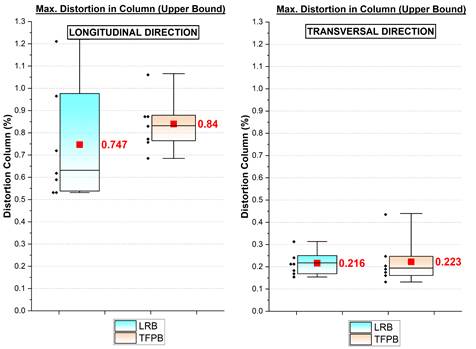
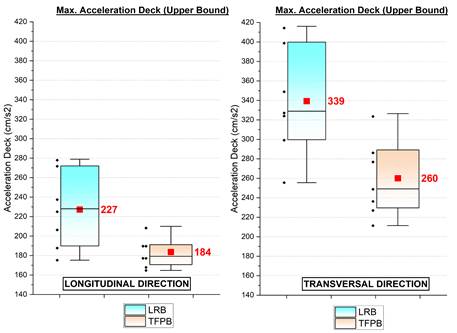
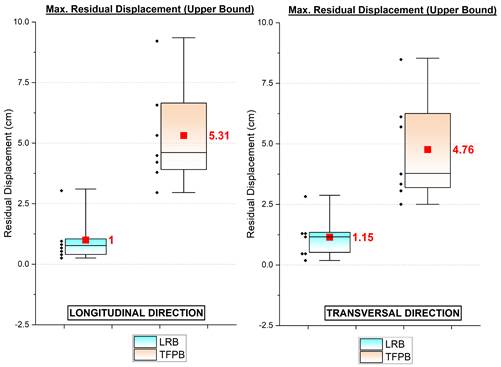
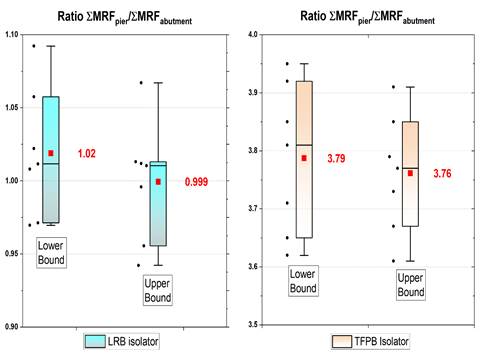
The maximum absolute values of the seismic demands experienced in the isolators, deck and columns are: (1) the maximum isolator displacements (MID), (2) the maximum isolator forces (MIF), (3) the maximum distortions in the columns (MDC), (4) the maximum accelerations in the deck (MAD) or peak deck accelerations and (5) the maximum residual isolator displacements (MIR), which assess the self-centering capacity of the system. These maximum absolute values are shown in Fig. 11, Fig. 12, Fig. 13, Fig.14 and Fig.15. In addition, the maximum abutment-pier shear force ratio (MRF) was assessed to compare the shared shear force between the elements of the substructure (Fig.16). In these figures the mean values, and different cumulative percentiles of the seismic demands are plotted.
The MDC results show that the columns had not incursions into the inelastic range, as expected. In the LRB case, higher seismic demands were induced in the abutments, isolators, and bridge deck. In contrast, the TFPBs induced higher demands in the columns and self-centering capacity of the isolators. It should be pointed out that both isolator systems did not experienced damage as the LRBs did not exceed the deformation limit of 200% of their rubber height (82 cm) [22] and the TFPBs did not undergo beyond their fourth regimen of movement (81.5 cm) [23]. Also, it can be observed that the distribution of shear forces in the substructure was almost equal for the LRB case, which was not the case for the TFPBs.
CONCLUSIONS
From the analysis of the obtained results for both isolation systems, it is concluded that there are significant differences in the distribution of the different seismic demands in the superstructure and substructure components, despite of sharing common features both systems.
The main difference in both isolation systems is the distribution of the shear forces along the substructure components. The results indicate that the LRBs induce a uniform distribution of the forces in comparison to the TFPB case. The non-uniform distribution in TFPBs is due to dependence of the frictional forces on the axial load supported in each isolator.
From the results, it can be inferred that one isolation system performs better than the other depending on the engineering demand parameter (column drift, peak deck acceleration, self-centering capacity, induced shear forces) chosen in the seismic performance assessment.
From previous comparative assessments in isolated bridges, it can be noticed that the overall trend in the induced seismic effects is mostly the same. However, further assessments are still required.
The obtained results show that there is low variability in the maximum responses obtained with the seismic records used in this work. It can be concluded that the results obtained show a low dispersion and therefore their mean values represent reliable values.

