


 Inglês (pdf)
 Artigo em XML
 Referências do artigo
 Enviar este artigo por email
 Citado por SciELO
  Similares em
SciELO
Similares em
SciELO 
 Permalink
1. INTRODUCTION
Most of the bridges in Peru had been designed and built under codes of more than forty years ago, which do not meet the current requirements; for instance, the loads considered in the design are much lower than the current ones due to the increase in vehicular traffic. Likewise, being located in a highly seismic zone, they present greater seismic vulnerability. All these factors show not only the vulnerability to damage of the structure exposed to the action of earthquakes but also the collateral damages that affect the population: such as problems with the transportation network, development of economies, difficulty for civil protection personnel, or any other institution to reach places where it is necessary to attend to the losses caused by an earthquake.
This article develops a methodology based on a nonlinear analysis to determine the degree of seismic vulnerability of a bridge, taking into account the probable occurrence of earthquakes throughout the bridge's lifetime. As a case study, the evaluation of the Moche Bridge is presented, which is located in the department of La Libertad (Peruvian coast). The probability of damage is obtained, considering the probable occurrence of earthquakes on the Peruvian coast.
2. METHODOLOGY
2.1 DEFINITION OF THE GLOBAL DAMAGE STATES (GDS)
The Global Damage States (GDS) represent a limit condition established according to the possible damages, threat on the security of the occupants and the functionality of the building after an earthquake. [1]
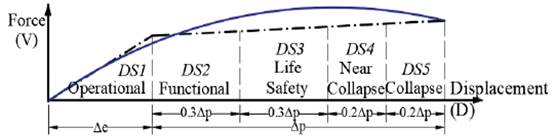
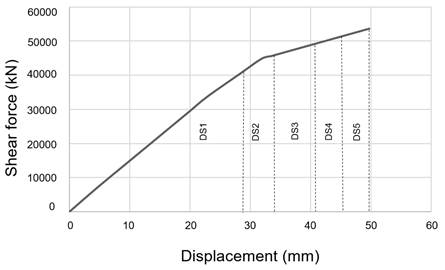
The GDS correspond to defined sectors of the structure's capacity curve, that is obtained through a non-linear static analysis. The effective yield displacement (Δe) corresponds to the instant in which a maximum of 50% of the inelastic incursions forming the failure mechanism have occurred, without the deformation in any section exceeding 150% of its yield deformation. The inelastic displacement capacity (Δp) corresponds to the lateral displacement of the structure from the effective yield point to the collapse. The inelastic section of the capacity curve is divided into four sectors defined by fractions of the inelastic displacement (Δp), as is shown in TABLE I. [1]
As shown in Fig. 1, the defined GDS are: Operational (DS1), Functional (DS2), Life Safety (DS3), Near Collapse (DS4) and Collapse (DS5).
TABLE I Damage State (DS) of the structure.
| Damage State (DS) | Displacement of the capacity curve | ||
| Operational | DS1 |
|
|
| Functional | DS2 |
|
|
| Life Safety | DS3 |
|
|
| Near Collapse | DS4 |
|
|
| Collapse | DS5 |
|
|
Note: Definition of the DS based on the displacement of the capacity curve. [1].
2.2 DETERMINATION OF THE INITIAL DAMAGE STAGE OF THE STRUCTURE
To determine the initial damage state of a reinforced-concrete bridge, a non-destructive compression test is realized, known as the sclerometer test NTP 339.181 [2], with which the in-situ concrete strength is estimated. For this purpose, ten readings are taken in two test areas to verify the actual compressive strength in the concrete, which may vary from what was considered in the design stage.
If the result of the sclerometer test on existing structures does not vary significantly concerning the design strength, the bridge is considered to have an initial operational state (GDS1).
Taking into account the initial state of the structure, a mathematical model is generated. Then, a non-linear static analysis (Pushover analysis) is performed to obtain the capacity curve of the bridge.
2.3 ELABORATION OF SEISMIC FRAGILITY CURVES FOR EACH GDS WITH THE CAPACITY SPECTRUM ASSESSMENT METHOD USING THE SOFTWARE FRACAS
The capacity spectrum evaluation methodology, first developed by Rossetto & Elnashai [3], allows the generation of fragility curves directly using seismic records from which the elastic and inelastic demand spectra are calculated in order to find the performance point.
The proposed approach is highly efficient and allows the fragility curves to be derived from the analysis of a structure subjected to a series of seismic records with different characteristics. In this way, the method can explain the effect of variability in seismic demand and structural characteristics on the damage statistics simulated for the type of structure, and evaluate the associated uncertainty in predicting fragility. [5]
Rossetto et al [4] developed the software FRACAS (FRAgility through CApacity Spectrum assessment) based on the described methodology, which allows sophisticated capacity curve idealizations, the use of several hysteric models for systems with a single degree of freedom in the inelastic calculation of demand and the construction of fragility functions by using several statistical model fitting techniques.
2.3.1 Performance Point
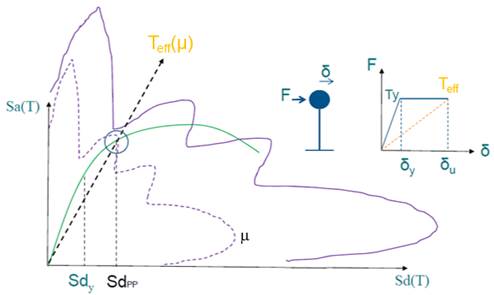
The inelastic demand spectrum is associated with a ductility μ, such that it intercepts the capacity spectrum at a point with displacement SdPP such that the capacity ductility is: SdPP/SdY= μ, whereby the point of intercept is the performance point, as shown in Fig. 2.
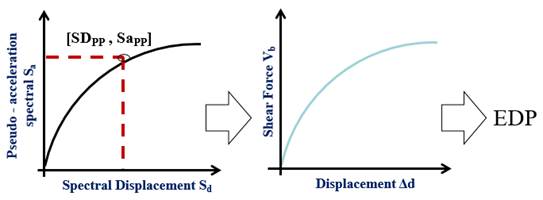
The coordinate of the performance point (PP) obtained in the spectral system is converted to the coordinate associated with the capacity curve to determine the associate response parameters (EDP). Likewise, the intensity (IM) associated with the acceleration used in the evaluation is calculated, as shown in Fig. 3.
2.3.2 Fragility curves
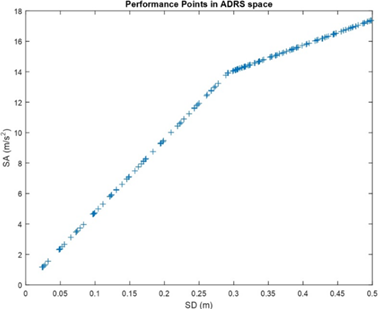
To obtain the fragility curves, it is necessary to calculate the nonlinear response of the structure subjected to various levels of seismic intensity, getting performance points with associated intensities (IM) and demand parameters (EDP), as shown in Fig. 4.
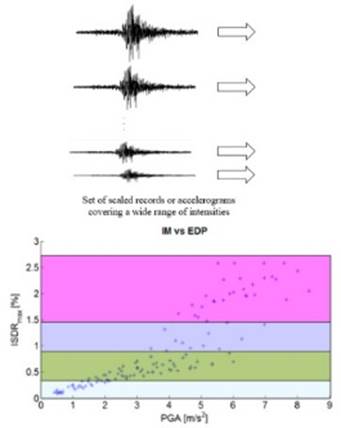
Fragility curves are constructed from the set of intensity (IM) and demand parameter pairs (EDP) through an appropriate statistical curve-fitting approach. The fragility curve is defined as the probability of exceedance of a damage state, given a level of seismic intensity (IM). It is also common to assume that damage has a log-normal distribution. Therefore, the fragility curves are calculated with the expression (1).
where μ is the mean (expected value) and σ is the standard deviation.
3. DESCRIPTION OF THE STRUCTURE
The Moche bridge is located in the Peruvian city of Trujillo; It is a one-way, Gerber-type bridge that has a carriageway divided into two lanes of one-way traffic. The superstructure of the Moche bridge is made of reinforced concrete slab and beams. The thickness of the slab and the height of the beam is variable depending on the span. The deck of the Moche bridge is composed of T-type beams; at the same time, it has a box section with variable depth in thickness. It consists of a platform with a total width of 9.50 meters, a unidirectional road 8 meters wide composed of 2 lanes with traffic in the same direction with 4 meters wide with flexible pavement type 5 centimeters high of asphalt, sidewalks of 0.70 meters wide on each side of the bridge, and a railing made of reinforced concrete with 0.80 meters high. The infrastructure of the Moche bridge consists of two abutments and four pillars: the abutments have a height of 10.72 meters and its foundation is of the Caisson type.
The modeled geometry of the bridge was based on the scanned plans of the Moche bridge acquired through the Citizen Information platform of the Ministry of Transport and Communications (MTC) [6]. The material properties, shown in TABLE II, were obtained from the data exposed in the acquired drawings of the Moche bridge and from the sclerometric test performed. In this way, the analytical model of the structure was elaborated using the CSI Bridge software [7] as shown in Fig. 5.
For the analysis, the abutments were represented with frame elements and the superstructure with shell elements; considering the fixed and movable supports for each abutment and abutments according to the plans. Regarding the loads considered, the Bridge Manual of the Ministry of Transport and Communications [6] was taken as a reference for a combination of loads of Extreme Events I; which in its combination of loads includes the action of the probable earthquake. Thus, the intervention of permanent loads (own weight, dead load), variable loads (vehicular live load, increase of dynamic live load, vehicular braking force, pedestrian load, frictional forces) and seismic action were considered.
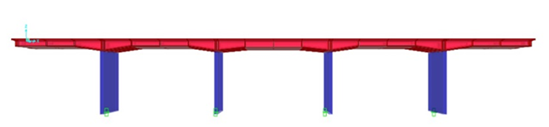
TABLE II Mechanical properties of the materials.
Note: Mechanical properties of the materials (concrete and steel) of the bridge.
4. APPLICATION OF THE METHODOLOGY
4.1 INITIAL DAMAGE STATE OF THE BRIDGE
As indicated in item 2.2, a non-destructive compression test is realized, as is shown in Fig. 6. Likewise, TABLE III has presented the results of the resistance according to the sclerometer index.
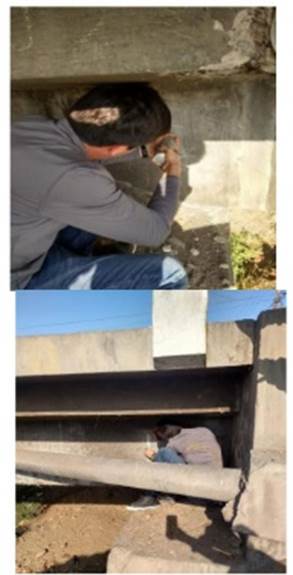
Fig. 6 Non-destructive in-situ sclerometer compression test of Points 1 and 2 of the main girder of the Moche bridge.
As is shown in Fig. 7, the sclerometer test was performed at both ends of the main girder of the bridge. Based on the results of the sclerometer test shown above performed on the Moche bridge, which leads, on average, to a concrete compressive strength of 25 MPa. It is observed that this result does not vary significantly concerning the design strength; then, the initial damage state of the Moche bridge is considered Operational (DS1).
4.2 CAPACITY CURVE OF THE BRIDGE
Based on the results obtained in item 4.1, the bridge is modeled considering that the properties of the materials and elements are the same as those considered in the design stage. Then, according to item 2.1, a nonlinear static analysis is performed, obtaining the following capacity curve of the bridge (see Fig. 8). Finally, the GDS's are obtained based on the displacement shown in TABLE IV.
4.3 PERFORMANCE POINTS
For the analysis and as seismic demand, it is used Peruvian and Chilean seismic records occurred in the last 60 years on the coast, as shown in TABLE V. These records, compatible spectrum mode, are scaled 33 times to obtain performance points considering the entire capacity curve.
TABLE V Peruvian and Chilean seismic records.
In Fig. 9 is shown the performance point obtained for a spectrum, as can be seen, the inelastic demand spectrum intercepts the capacity spectrum. This is related with the ductility μ as explained in item 2.3.1. Similarly, this process is repeated for the 264 demand spectrums obtaining 264 performance points as is shown in Fig. 10.

4.4 FRAGILITY CURVES
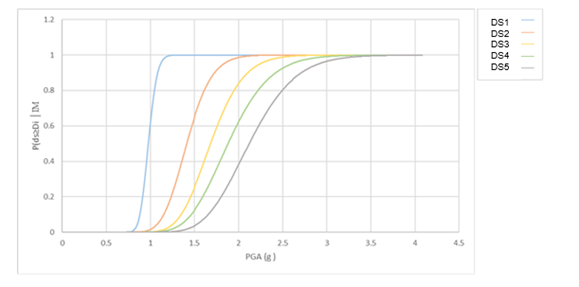
With the performance points in format (Top Drift (EDP), PGA (IM)), the fragility curves are obtained following the probabilistic method described in item 2.3.2. The fragility curves are shown in Fig. 11.
CONCLUSIONS
A simplified method is developed based on the methodology proposed by Rossetto & Elnashai [3], which aims at determining the seismic vulnerability considering the damage due to the occurrence of probable earthquakes during the lifetime of a bridge. The Moche bridge, located on the Peruvian coast, which presents a state of initial operational damage, is analyzed as a case study.
From the results obtained, for earthquakes with accelerations of less than 1g, the bridge presents a state of operational damage (DS1), i.e., the bridge does not show significant structural damage.
It is evident that up to accelerations of 1.75g, the bridge presents a state of Functional damage (DS3), with an exceedance probability of 49%.
Therefore, it is concluded that despite its age, the bridge presents a good seismic performance against rare earthquakes and satisfactorily complies with the design philosophy of the Peruvian code.
With the proposed methodology and the data obtained, it is recommended to continue calculating the reliability, taking into account the accumulated damages in the elements for each GDS.

