


 Inglés (pdf)
 Articulo en XML
 Referencias del artículo
 Enviar articulo por email
 Citado por SciELO
  Similares en
SciELO
Similares en
SciELO 
 Permalink
INTRODUCTION
Concrete is a material in great demand for civil works, so it is essential to be able to know and accurately describe its behavior through a stress-strain curve capable of understanding various factors, as well as the quality, physical characteristics and constitutive laws that govern the behavior of the material.
There are several investigations on the behavior of concrete in the literature proposed by various researchers, such as the model of Hognestad et al. [1], in which the explanation of the behavior of concrete subjected to compression is proposed by means of a parabolic equation; the model of Todeschini et al. [2], where he describes the behavior of concrete under compression with a parabola; the first stress-strain model of Park [3], which considers the increase of deformation capacity in the behavior of concrete due to the contribution of confining steel; the proposal of the concept of equivalent uniaxial deformation by Darwin and Pecknold [4], where it is explained that the decoupling of the two-dimensional response of concrete is possible through the separation of the Poisson effect, as well as a tensile strength on the part of this material; the stress-strain model proposed by R. Reyna et al. [5] and [6], taken as a basis for the present investigation, in which experimental studies were performed to know the behavior of plain concrete, as well as to know the effect of confinement with carbon fibers in concrete.
The objective of this research is to understand the behavior of plain and fiber-reinforced concrete, as well as the strength and deformation capacity, taking into consideration the section shape factor, slenderness ratio, strength quality and fiber type for concrete reinforcement, based on experimental test results of 90 samples subjected to monotonic loading to calibrate the proposed numerical model.
BACKGROUND
The first studies carried out by Park considered the increase in the ductility in concrete due to the confinement steel, without considering the increase in the compressive strength of the concrete. However, in subsequent studies by Park et al. [7], his proposed model was modified taking into account the confining effect on compressive strength; thus, proposing his modified model in 1982, where he shows that the strength of confined concrete is multiplied by a factor dependent on the type of confinement that the concrete will have.
In the contribution given by Sinha et al. [8], the stress-strain response that concrete has under cyclic loads was described qualitatively and quantitatively. In their research work, they subjected concrete cylinders to a cyclic axial compression load to determine the dependence of the cyclical response of the concrete. Experimentally, it was observed that the assumption that the recharge curves approached straight lines were not true; thus, it could be considered as a straight line from the zero-stress level to the common point of the intersection between the discharge and the recharge curves. From this common point, the slope of the recharge curves changes significantly.
In the research by Karsan and Jirsa [9], it was shown that the recharge and discharge depend on the previous load history. They developed experimental tests, which consisted in the application of cyclic axial loads in short rectangular columns of simple concrete, to interpret in more detail the findings of Sinha. They concluded that the response to a monotonic load described an enveloping curve, with which they proposed an empirical formula that correlated the residual plastic stress with a point on the enveloping curve from which the download. The recharge starts from a level of zero stress until reaching the envelope curve, from the level of zero stress to the common point between the recharge curve and the discharge curve, it can be represented as a straight line (Sinha et al. [8]) and a second order parabola from the common point to the envelope curve (Karsan and Jirsa).
Mansour and Hsu [10] developed a stress-strain model subjected to cyclic shear loads. This work included a cyclic uniaxial constitutive relationship for concrete that takes into account a reduction in compressive strength caused by being subjected to tensile loads. constant, the discharge and recharge curves of your model were made up of a set of compound linear curves. After this model, special attention has been paid to the description of the resistance and the degradation of the stiffness produced by the load cycle in tension and compression, the shape of the discharge and recharge curves and the transition between opening and closing. from the cracks.
The response of concrete under cyclic tension load has been studied in detail by Reinhardt [11], who performed tests on simple concrete under cyclic tension and developed numerical expressions for the reduction of resistance, deriving the discharge and recharge curves. It was observed that the recharge curve does not return to the envelope curve in the previous maximum discharge deformation and that a greater effort is necessary to return to the envelope curve. Furthermore, the energy dissipated in a traction cycle can be neglected when compared with the energy dissipated in a complete compression cycle.
Over the years, the models were improved, varying the study methods and rules that govern them, and the type of reinforcement and confinement. Some of these new proposals for reinforcement include the addition of fibers into the concrete mix, making it more resistant to fatigue. In addition to its main function is to be a link between the cracks developed in concrete when it is loaded or when it is subjected to extreme environmental changes, granting toughness to the element after having incurred its maximum resistance load, and avoiding imminent collapse in the case of residual resistance (Bentur and Mindess [12]).
Their uses are innumerable, characterized in some cases by significantly increasing the deformation capacity. In addition it is possible to reduce the thickness of sections of the resistant elements, effectively controlling cracking, which results in lighter structures. This makes them useful and can be applied to roads, bridges, buildings and tracks (Wang et al. [13]).
The present investigation takes as its starting point the study carried out by R. Reyna et al. in 2017 [6], where the performance of low ductility walls reinforced with carbon fiber under cyclic loading was studied. As part of the development of this research, a series of experimental studies were carried out. In 2013, three specimens of low ductility walls were built, which were subjected to a controlled cyclic lateral load test. In order to improve the behavior of low ductility walls, a method of reinforcing walls using carbon fiber was proposed, where two of the walls were reinforced and their effectiveness verified. In 2014, three similar specimens of low ductility walls were built, which were subjected to a controlled cyclic lateral load test. Two of the three walls were reinforced with a variant of the previously proposed reinforcement method. As a result, the performance of the low ductility walls was improved compared to the unreinforced wall. The failure mode observed during the tests of low ductility walls was the crushing of the concrete in the base-corners of the wall and buckling of the reinforcing steel as a result of the bending-compression load acting. Additionally, it was observed that the concrete was restrained in reinforced walls due to the confinement effect of the carbon fiber. Therefore, in 2015, experimental tests were carried out to study the confinement effect of carbon fiber of plain concrete under monotonic and cyclic loads. (R. Reyna et al. [14])
There are various models based on theoretical studies and experimental tests where the applied loads were monotonic or cyclic. The present research focused on the experimental study of the behavior of concrete under monotonic loads and different characteristic aspects, such as the type of reinforcement, geometry (section form factor), slenderness of the specimen and quality of the mix concrete; thus, being able to perform a comparative evaluation between the different results of the stress-strain curves of the concrete, which will provide a better understanding of its behavior.
METODOLOGY
In order to study the mechanical properties of the plain and fiber-reinforced concrete, 90 specimens (36 plain concrete specimens and 54 reinforced concrete specimens) were fabricated taking into account the following factors:
Section shape - Circular sections with 15cm of diameter (C) and square sections with 15cm of side (S).
Slenderness ratio - Diameter/height or side/height ratios of 1:1, 1:2 and 1:3 were used.
Concrete quality - Design compressive strength for concrete pattern and reinforced concrete (different qualities of strength).
Type of reinforcement fiber - Steel fiber (used for concrete reinforcement), thick synthetic fibers (used for concrete reinforcement and mortar) and fine synthetic fiber (used for concrete reinforcement and mortar) were employed.
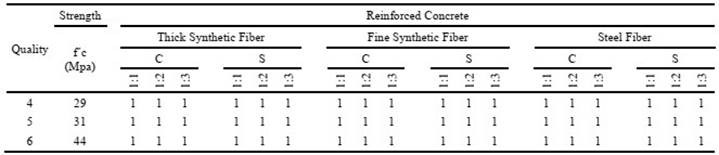
These specimens have been fabricated based on plain concrete and reinforced concrete, which were tested in compression under monotonic loadings. Table 1 shows the relation of specimens to be tested, specifying their geometric characteristics, design quality and type of reinforcement for their fabrication.
An identification code of the form XYM - WRZ was assigned to each specimen, which describes the influential characteristics for its behavior in the proposed model. The meaning of each letter of the codification is explained below.
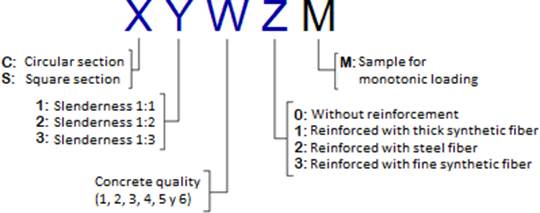
For the preparation of the concrete mix, the aggregates were characterized in compliance with the requirements of the Peruvian technical standard 400.37, obtaining the granulometry of the fine and thick aggregates together with their respective houses and properties. Six different qualities of mixes were done without reinforcement (Table 1) and three of them were prepared using reinforcement (Table 2 and Fig. 2). It is important to emphasize that their respective characteristic strength was obtained from the tests of standard specimens: Circular transversal sections with slenderness 1:2 without reinforcement (Table 1).
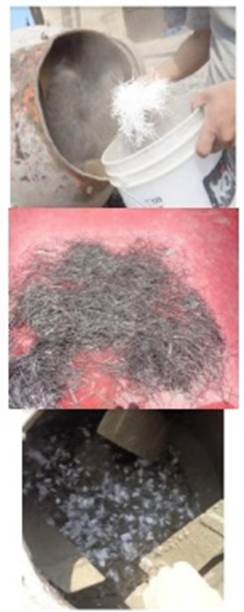
Fig. 2 Types of Reinforcements used in the study. a) Thick synthetic fiber. b) Steel fiber. c) Fine synthetic fiber.
The 90 specimens prepared were subjected to an incremental monotonic loading according with the Peruvian technical standard 339.034 until reaching the specimen failure, whose deformation is given in the direction of the applied load, which will be measured by 3 LVDT (linear variation differential transformer) displacement transducers located around it, as shown in Fig. 3, and registered by a high-speed data acquisition system. Fig. 4 shows a circular and square section specimen after the monotonic test.
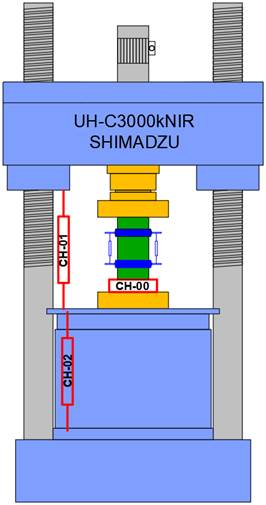
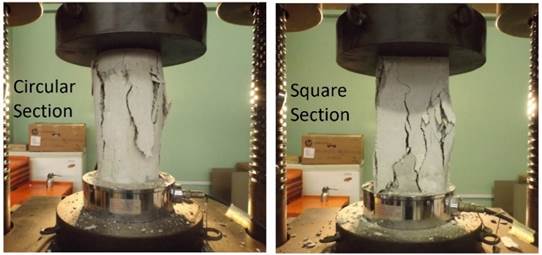
Table 1 List of specimens without reinforcement.
| Quality | Strength | Pattern Concrete | |||||||
| f´c (Mpa) | Plain Concrete | ||||||||
| C | S | ||||||||
| 1:1 | 1:2 | 1:3 | 1:1 | 1:2 | 1:3 | ||||
| 1 | 24 | 1 | 1 | 1 | 1 | 1 | 1 | ||
| 2 | 22 | 1 | 1 | 1 | 1 | 1 | 1 | ||
| 3 | 28 | 1 | 1 | 1 | 1 | 1 | 1 | ||
| 4 | 29 | 1 | 1 | 1 | 1 | 1 | 1 | ||
| 5 | 31 | 1 | 1 | 1 | 1 | 1 | 1 | ||
| 6 | 44 | 1 | 1 | 1 | 1 | 1 | 1 | ||
4. RESULT ANALYSIS
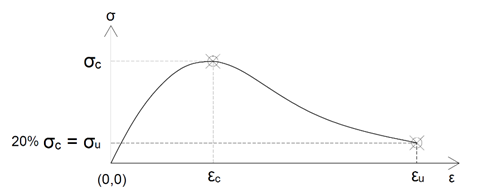
From the constitutive laws experimentally obtained of each specimen, the following parameters were extracted (Fig. 5):
- Characteristic compressive stress (σc).
- Strain corresponding to peak strength (Ԑc).
- Ultimate stress corresponding to 20% of peak strength (σu).
- Strain corresponding to the ultimate stress considered (Ԑu).
- Deformation capacity to 20% of peak strength (Ԑu / Ԑc).
Taking into account the stress-strain behavior curve of the tested specimens, it was proceeded to group them according to the variable parameter of interest, which were the slenderness and the reinforcement type, while for each group the other parameters were remained constant, which included the type of section and the quality of the concrete. Some of the curves for the comparison of stress-strain behavior due to slenderness effects are presented below.
From Fig. 6 and Figure 7, due to the slenderness values, it is observed that the specimens with aspect ratio 1:1 has a significantly larger deformation capacity than specimens with aspect ratio 1:2 and 1:3. As an example, Fig. 6 shows specimens with quality of the concrete type 6 without reinforcement of circular and square shape sections; and Figure 7 shows specimens with quality of the concrete type 6 and reinforcement type 1 of circular and square sections.
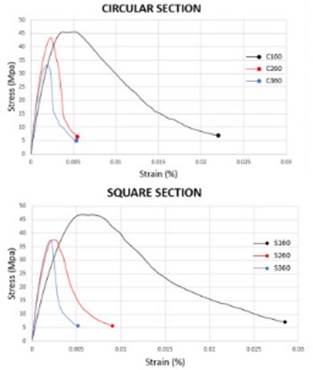
Fig. 6 Comparison of stress-strain behavior for slenderness effects with quality of the concrete type 6 without reinforcement in circular and square sections.
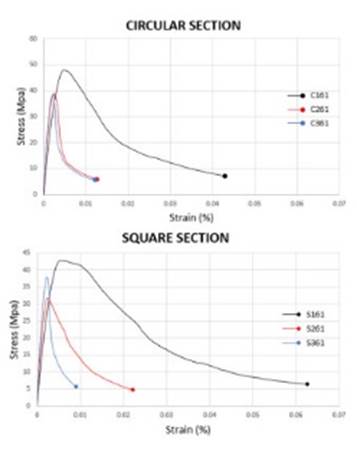
Figure 7 Comparison of stress-strain behavior for slenderness effects with quality of the concrete type 6 with reinforcement type 1 in circular and square sections.
According to the type of the fiber reinforcement shown in Figure 8 and Figure 9, specimens with fiber reinforcement type 1 and 2 has a significant larger deformation capacity than specimens with fiber reinforcement type 3 and plain concrete. Figure 8 shows specimens with quality of the concrete type 4 and slenderness 1:2 of circular and square sections.
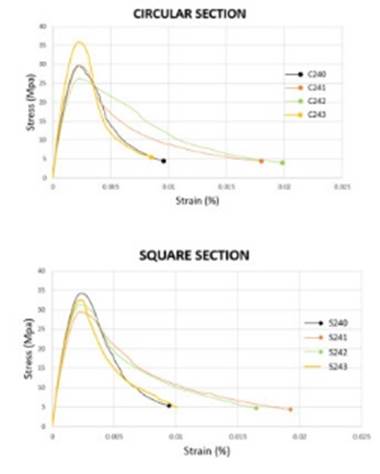
Figure 8 Comparison of stress-strain behavior for slenderness effects of the type of reinforcement with quality of the concrete type 4 and slenderness 2 in circular and square sections.
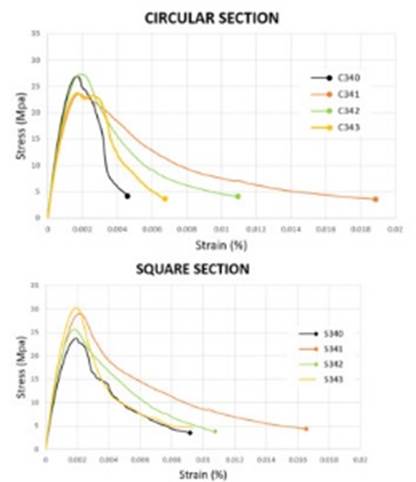
Figure 9 Comparison of stress-strain behavior for effects of the type of reinforcement with quality of the concrete type 4 and slenderness 3 in circular and square sections.
On the other hand, Fig. 10 shows the results of comparing the normalized resistance and normalized deformation capacity of specimens with different types of fiber reinforcement. The normalization was carried out with respect to the specimens with the same characteristics (mix quality, slenderness and shape section) but without reinforcement. For instance, the characteristic compressive resistance of the specimen C141M is normalized by dividing with respect to the characteristic compressive resistance of the specimen C140M. As it can be observed in Fig. 10 of normalized resistance, there is no significative contribution of resistance, the means of the bars are 0.98, 1.00, 1.07, corresponding to the reinforcement types 1, 2 and 3 respectively. According to the other graphic, about normalized deformation capacity, as may be seen, there is a contribution on the deformation capacity when adding reinforcement to the concrete mix. The means of the bars are 2.25, 1.76 and 0.96 associated to the reinforcement types 1, 2 and 3, respectively; therefore, it can be argued that reinforcements 1 and 2 contribute to give deformation capacity to the concrete mix.
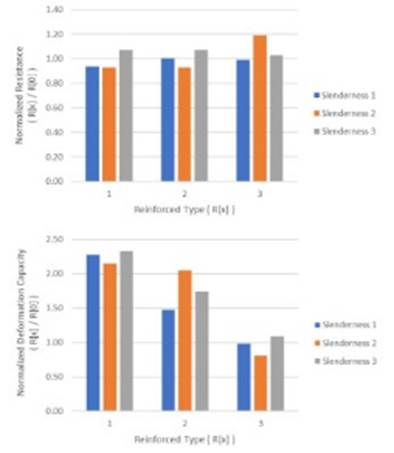
Figure 10 Comparative results between specimens with different types of fiber reinforcement. The comparative parameters are: Normalized resistance on the left, and normalized deformation capacity on the right.
Fig. 11 shows the results of comparing the normalized resistance and normalized deformation capacity of a specimen with slenderness of 1:1 and 1:3. The normalization was carried out with respect to standard slenderness 1:2 of the plain concrete with the same characteristics (mix quality and shape section). For instance, the characteristic compressive resistance of the specimen C110M is normalized by dividing with respect of the characteristic compressive resistance of the specimen C120M. As it can be observed in Fig. 11 of normalized resistance, the normalized resistance of the specimen with slenderness of 1:1 is higher than the standard slenderness (value more than 1), and the specimen with slenderness 1:3 is lower, being the average values 1.14 and 0.97, respectively. According to the normalized deformation capacity, the specimens with slenderness 1:1 have higher deformation capacity than the specimens with slenderness 1:3, both of them normalized with respect to the standard slenderness 1:2, being the average values 1.77 and 0.77, respectively.
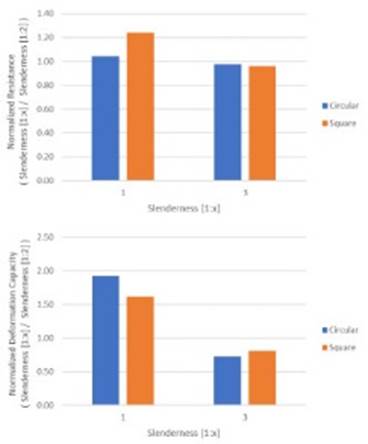
Figure 11 Comparative results between specimens with different types of slenderness (1:1 and 1:3. The comparative parameters are: Normalized resistance on the left, and normalized deformation capacity on the right.
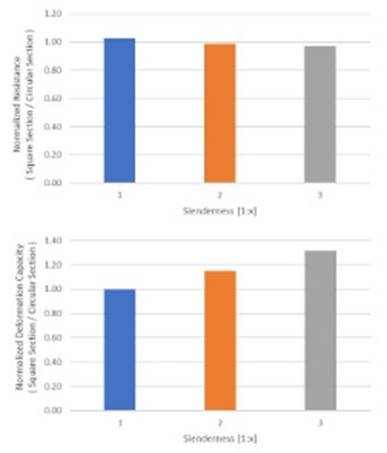
In terms of shape section, Figure 12 shows the results of the normalized resistance and normalized deformation capacity against the slenderness ratio of the specimens. The normalization was carried out by dividing the corresponding parameter of square shape section over the standard circular shape section of the plain concrete with the same characteristic (mix quality and slenderness). For instance, the characteristic compressive resistance of the specimen C110M is normalized by dividing with respect of the characteristic compressive resistance of the specimen S110M. From Figure 12, similar values of maximum normalized resistance between square shape sections and circular shape sections are observed for all types of slenderness ratio. Regarding the normalized deformation capacity of the specimens, higher slenderness ratio results in higher deformation capacity of square shape sections with respect to the circular shape section specimens.
CONCLUSIONS
The steel fibers reinforcement and thick synthetic fibers reinforcement are oriented to increase the deformation capacity of the concrete in comparison with the fine synthetic fiber reinforcement. However, the resistance does not improve significantly.
The peak strength obtained from the specimens testing with slenderness ratio 1:1 is higher than the strengths obtained from the specimens with slenderness ratios 1:2 and 1:3, while the difference in the maximum compressive strength results of specimens with slenderness ratios 1:2 and 1:3 do not differ significantly.
The square section specimens have higher ultimate deformation compared to the circular section specimens for a slenderness ratio 1:1, while for slenderness ratio 1:2 and 1:3 this difference is not very significant.
The square section specimens show higher deformation capacity for slenderness ratios 1:2 and 1:3 than with specimens with circular sections.
In terms of the slenderness ratio of the specimens, it is observed that the specimens with aspect ratio 1:1 have a significantly larger deformation capacity than specimens with aspect ratio 1:2 and 1:3.
From the test results, it was observed that the use of fiber reinforcement enhance the deformation capacity of the concrete. However, it is recommended to conduct further research varying the quantity of the fiber reinforcement, in order to determine optimum design quantities taking into account the parameters of strength and deformation capacity of the concrete.
In order to obtain a better understanding of the performance of the fiber reinforced concrete into a structure, it is recommended to conduct experimental researches of structural elements subjected to different types of loads (bending and shear), for instance, beams or columns.

