SciELO - Scientific Electronic Library Online

 
vol.32 número2Monitoreo de la salud estructural de un edificio residencial de muros de corte de concreto armado en Lima, Perú, utilizando un sensor 4D de frambuesaAnálisis sísmico de estructuras subterráneas: influencia del tipo de suelo, la rigidez relativa y la intensidad sísmica índice de autoresíndice de assuntospesquisa de artigos
Home Pagelista alfabética de periódicos  

Serviços Personalizados

Journal

Artigo

Indicadores

  • Não possue artigos citadosCitado por SciELO

Links relacionados

  • Não possue artigos similaresSimilares em SciELO

Compartilhar


Tecnia

versão impressa ISSN 0375-7765versão On-line ISSN 2309-0413

Tecnia vol.32 no.2 Lima jul./dez. 2022  Epub 08-Ago-2022

http://dx.doi.org/10.21754/tecnia.v32i2.1421 

Artículos originales

Site dominant frequencies in Lima, Peru, by H/V spectral ratio of seismic records

Frecuencias dominantes de sitio en Lima, Perú, según la relación espectral H/V de registros sísmicos

Angel Ccahua1  * 

Carlos Gonzales2 

Luis Moya2  3 

Fernando Lazares2 

Fumio Yamazaki4 

1 Faculty of Civil Engineering, National University of Engineering, Lima, Peru

2 Japan-Peru Center for Earthquake Engineering Research and Disaster Mitigation, Lima, Peru

3 International Research Institute of Disaster Science, Tohoku University, Sendai, Japan

4 National Research Institute for Earth Science and Disaster Resilience, Tsukuba, Japan

ABSTRACT

Strong motion records are important for improving seismic design, damage assessment and analysis of earthquake effects. Despite the relevance of having strong motion networks, their implementation in Peru has been performed in the very recent years. For instance, only five strong motion stations in Lima recorded the 2007 Mw 7.9 Pisco earthquake, whereas 55 stations recorded the 2021 Mw 6.0 Mala earthquake. The current number of instrumentations in Lima city provides an opportunity to improve soil characterization. This study aims to determine the dominant frequency (fd) of the seismic stations located in Metropolitan Lima. The procedure we adopted, first considered collecting, for an arbitrary station, all the available events recorded from 2011-2021, including the 2007 Mw 7.9 Pisco earthquake. Then, the pseudo spectral acceleration, using 5% damping, for each component were computed, and the horizontal-to-vertical (H/V) spectral ratios were calculated. Finally, the average H/V spectral ratio was used to adequately characterize the values of fd. In total, we evaluated 51 stations throughout Lima city. Values of fd lower than 1 Hz were observed for the coastal areas in which the underlying soil consist of clayey/sandy deposits and regions with an important impedance contrast in the deeper part of the substructure. These values increment towards the center of the city coinciding with surficial gravel deposits.

Keywords: Soil dominant frequency; Horizontal-to-vertical spectral ratio; Ground motion; REDACIS network; pseudo spectral acceleration

RESUMEN

Los registros sísmicos son importantes para mejorar el diseño sísmico, la evaluación de daños y el análisis de los efectos de los terremotos. A pesar de la relevancia de contar con redes acelerográficas, su implementación en el Perú se ha realizado recién en los últimos años. Por ejemplo, solo cinco estaciones acelerográficas en Lima registraron el terremoto de Pisco de 7,9 Mw de 2007, mientras que 55 estaciones registraron el terremoto de Mala de 6,0 Mw de 2021. El número actual de instrumentación en la ciudad de Lima brinda una oportunidad para mejorar la caracterización de suelos. Este estudio tiene como objetivo determinar la frecuencia dominante (fd) de las estaciones sísmicas ubicadas en Lima Metropolitana. El procedimiento adoptado primero consideró recopilar, para una estación arbitraria, todos los eventos disponibles registrados entre 2011 y 2021, incluyendo el terremoto de Pisco de 7,9 Mw de 2007. Luego, se calculó la aceleración pseudoespectral, usando un 5% de amortiguamiento, para cada componente, y se estimaron las relaciones espectrales horizontal a vertical (H/V). Finalmente, se utilizó la relación espectral H/V promedio para caracterizar adecuadamente los valores de fd. En total, evaluamos 51 estaciones a lo largo de la ciudad de Lima. Se observaron valores de fd inferiores a 1 Hz para las zonas costeras en las que el suelo subyacente consiste en depósitos arcillosos/arenosos y regiones con un importante contraste de impedancia en la parte más profunda de la subestructura. Estos valores se incrementan hacia el centro de la ciudad coincidiendo con depósitos de gravas superficiales.

Palabras clave: frecuencia dominante del suelo; relación espectral horizontal a vertical; movimiento del suelo; red REDACIS; aceleración pseudoespectral

1. INTRODUCTION

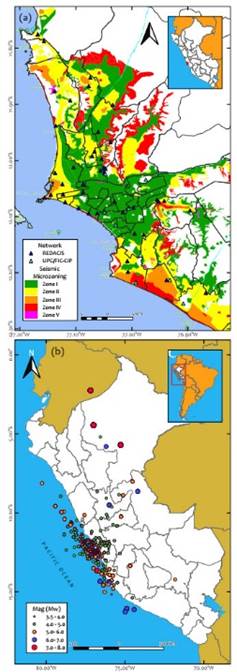
Lima, the capital of Peru is a coastal city in western South America with a population of about 10 million [1]. The city lies in the Pacific Ring of Fire, which is considered as one of the most seismically active zones in the world. The most destructive earthquakes in Peruvian history are a consequence of the interaction of two tectonic plates, the Nazca plate that subducts at a velocity of roughly 70 mm/year beneath the South American Plate, according to GPS measurements ( [2], [3]). This interaction has determined the geology and geomorphology of this region. Most parts of Metropolitan Lima lie in alluvial deposits that were originated by the Chillon, Rimac and Lurin rivers, commonly known as Lima conglomerate. This type of material is a heterogeneous mixture of cobbles and gravels in a silty-sandy matrix with intercalations of silty-clayey or sandy lenses. Rocky outcrops of either intrusive, volcanic, or sedimentary nature can also be observed in the outskirts of the city [4].

Several earthquakes have occurred along the Peruvian margin, of which the largest took place in 1746 with an estimated moment magnitude (Mw) between 8.5 and 9.0 [5]. Other historical seismic events are those that occurred in 1966, 1970 and 1974, which drastically damaged Lima and the Andean regions. However, very few records are available for these events due to scarce strong motion instrumentation at that time. To overcome this situation, continuous seismic implementation in the city of Lima has been performed in the very recent years. In that sense, only five strong motion stations in Lima recorded the 2007 Mw 7.9 Pisco earthquake, whereas 55 stations recorded the 2021 Mw 6.0 Mala earthquake, in a similar situation to the 2019 Mw 8.0 Lagunas event.

The current number of seismic instrumentations in Lima city provides an adequate opportunity to improve soil characterization. The objective of this study is to determine the site dominant frequency (fd) of strong motion stations throughout Metropolitan Lima using the horizontal-to-vertical (H/V) response spectral ratios of two of the three networks currently in operation, which are the REDACIS and UPG-CIP networks.

2. BACKGROUND

Soil amplification is an important factor in determining the level of damage caused by earthquakes. Usually, the time-averaged shear-wave velocity in the first 30 m (VS30) is the parameter used for explaining site effects conditions. Despite the inherent limitations, it has been widely used as a basis for soil characterization in building codes worldwide, such as the ASCE/SEI 7-16 [6], the EUROCODE-8 [7], the E030-2018 [8]. To overcome this matter, in recent decades, fd has also been included as a complementary parameter for a better representation of the dynamic characteristics of soil deposits ( [9], [10], [11]).

The fd parameter is usually estimated from H/V spectral ratio analysis. It is a common practice to identify the peak frequency by using the Fourier spectra of either ambient noise or strong motion records, as it is noted in [12], [13] and [14]. Some drawbacks of using Fourier spectra are, for instance, that at very high frequencies (short periods), sharp peaks in each component might produce a large variability in the spectral ratio. On the other hand, and due to the crucial importance of smoothing in the calculation of Fourier spectra, the amount of effort and time would be extremely large to process several records, since the parameters chosen for one station might not be necessarily applicable for the others. In addition, the smoothing effect could be unintentionally misused [9]. An alternative method considers the response spectral amplitudes of the recorded earthquake signals (e.g. the 5% damped pseudo spectral acceleration [PSA]), since it has been reported that the single degree of freedom damped oscillator acts as a narrow-band filter. Therefore, H/V response spectral ratios are much smoother functions of frequency [15].

 fd can be easily obtained from the H/V methodology and has the advantage of offering site information for strong motion stations without the need for additional surveys. In general, the H/V technique provides a stable site dominant frequency. Yamazaki and Ansary [16] showed that for records from intermediate to far field earthquakes, H/V results are almost independent of magnitude, source-to-site distance and depth using Fourier spectral ratios. In a similar approach, Zhao et al. [9] proved that ratios obtained from 5% damped response spectra are not strongly affected by magnitude, hypocentral distance or focal depth. Thus, in this study we decided to use the PSA to calculate the H/V response spectral ratios.

In the last decade, the Japan-Peru Center for Earthquake Engineering Research and Disaster Mitigation (CISMID) has been developing a microzoning map for the Lima city which considered geotechnical and dynamic soil information obtained from various types of tests, such as soil pits, boreholes, multichannel analysis of surface waves (MASW) and single-point and microtremor array measurements. Despite the limitations in terms of the maximum exploration depth and the number of tests available, it is the most comprehensive study available, and it is continuously being updated with new information. According to this microzoning study, Lima city has been divided into five zones (Fig. 1a) [17]. Most areas of Lima lie in Zone I which are characterized by dense to very dense gravels or sands, hard silts or clays and rocky formations, with dominant periods shorter than 0.30 s (i.e., fd > 3.33 Hz). Areas with moderate geological hazards and medium compacted sands are considered as Zone II, with dominant period values shorter than 0.40 s (i.e., fd > 2.50 Hz). Zone III comprises loose to dense sands, soft to firm clayey and silty soils, with low dominant frequencies (fd ≤ 2.50 Hz). Finally, Zones IV and V include marine and aeolian deposits, swampy soils, debris and waste materials. Since these types of soils are considered to have inappropriate response under the effect of earthquakes, they are not recommended for urban expansion plans. In this sense, the analysis and results of the present study provide complementary information to those from seismic microzonation studies, since they allow the understanding of the vibrational characteristics of soil deposits where seismic signals have been recorded. In addition, seismic response analyses could be implemented in future studies considering typical soil profiles for each zone in the proposed microzonation.

Fig. 1 Location of (a) recording stations (triangles) within the current seismic microzoning map of Metropolitan Lima and (b) earthquake epicenters (circles) considered in this study. 

3. METHODOLOGY

3.1 NETWORK AND DATABASE

Currently, there are three strong motion networks in Lima city, which are operated by the Geophysical Institute of Peru (IGP), by the Japan-Peru Center for Earthquake Engineering Research and Disaster Mitigation (henceforth REDACIS) and by the Graduate School of the Faculty of Civil Engineering in agreement with the Peruvian Society of Engineers (UPG-CIP). For this study, we have only considered the latter two. The REDACIS network comprises seismic stations installed in schools, hospitals, municipalities, and universities throughout Metropolitan Lima. The instruments have been renewed from analog to digital equipment since 2001. In 2011, and within the framework of the Science and Technology Research Partnership for Sustainable Development (SATREPS) project [18] CV-374A2 Tokyo Sokushin sensors were installed. Since 2017, 130-SMA REFTEK sensors were also deployed and currently represent the largest number of the operating equipment. On the other hand, the UPG-CIP network, which started its implementation in 2013, operates sensors installed nationwide, mainly in universities and local offices of the Peruvian Society of Engineers. The implemented equipment is either 130- SMA or 130-SMHR REFTEK sensors.

It is important to mention that both networks, in agreement with the National Training Service for the Construction Industry (SENCICO), also operate one Basalt Kinemetrics and two Sigma-TS4G-ACC Gaiacode sensors. Finally, the sampling frequency of all the three-component accelerometers is set to 200 Hz.

We compiled all available events recorded on REDACIS and UPG-CIP networks from 2011 to 2021. Fig. 1 shows the geographic distribution of the strong motion stations and the epicenters of earthquakes used in this study, whereas coordinates of the stations are given in TABLE I. We identified a total of 51 stations, from which we processed and analyzed 2075 records from 292 earthquakes in total. We used records having a moment magnitude (Mw) greater than 3.5. The number of events for each station varies from 1 to 134. Fig. 2 shows the magnitude-depth, magnitude-epicentral distance (Depi), and peak ground acceleration (PGA)-magnitude distribution of the database, in addition to the histogram of the number of records at the stations. Most of the observed data are records of small-to-moderate earthquake magnitudes (3.5≤Mw≤8.0) at regional distances (3 km ≤ Depi ≤ 1000 km). The largest magnitude considered in this group is the 2019 Mw 8.0 Lagunas earthquake, a far-field event with a Depi value of about 727 km. However, the maximum PGA (230 gal) was recorded for the 2021 Mw 6.0 Mala earthquake, with a focal depth of 32 km and located 85 km from the center Lima city. It is important to mention that, due to its historical importance, records from the 2007 Mw 7.9 Pisco earthquake are also included. Finally, a summary of the data used in this study is given in TABLE II.

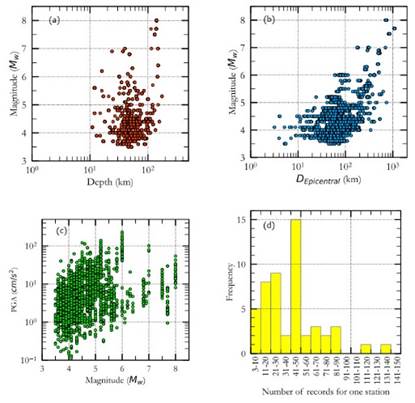
Fig. 2 Distribution of (a) magnitude-depth, (b) magnitude-epicentral distance, and (c) peak ground acceleration-magnitude relationships for the considered records. (d) Histogram of the number of records per station. 

TABLE I. Coordinates and number of events of the strong motion stations 

Station code Station Name Latitude (S) Longitude (E) Zone* No. of records available
Mw ≥ 3.5 Mw ≥ 5.0 Depi ≥ 100km PGA ≥ 5 gal PGA ≥ 10 gal
CAL001R DHN -12.0657 -77.1557 III 47 13 15 27 14
CAL002 R NISTA -12.0597 -77.1230 II 84 25 31 18 7
CAL003 R DSMI -12.0608 -77.1449 III 19 9 8 5 3
CAL004 R RAMON -12.0416 -77.1235 II 24 9 8 8 4
CAL005 R ACAPU -12.0221 -77.1368 II 29 11 10 8 6
CAL006 R VHAYA -11.9383 -77.1360 II 27 10 10 10 7
CAL007 R ESTAL -12.0118 -77.1042 I 16 4 4 7 2
CAL008 R AMORE -11.8933 -77.1103 I 24 9 9 21 14
CAL010 R BONDY -12.0423 -77.0869 I 20 8 7 5 2
CAL011 R PRADO -12.0744 -77.1190 II 13 5 3 9 4
CAL012 R DEFEN -11.8763 -77.1381 IV 21 7 8 14 7
LIM001 R JALVA -12.0133 -77.0502 I 115 30 46 66 39
LIM002 R FIC -12.0223 -77.0490 I 136 27 52 44 17
LIM004 R PIQUE -12.0890 -76.8960 I 4 3 2 4 4
LIM005 R RESER -12.0730 -77.0310 I 68 16 25 18 8
LIM006 R PIEDRA -11.8520 -77.0740 II 74 12 36 21 11
LIM007 R VES -12.2130 -76.9380 III 89 11 32 44 24
LIM008 R SMP -12.0180 -77.0560 I 77 14 32 24 9
LIM009S BORJA -12.0856 -77.0064 I 48 15 15 14 6
LIM010 R MARTI -12.0719 -76.9415 II 54 15 17 50 32
LIM011 U, R CIPCN -12.1152 -77.0291 I 81 15 25 15 9
LIM012 R UNFV -12.0943 -77.0767 II 45 12 14 11 6
LIM013 R SANM -12.0560 -77.0872 III 12 5 3 3 1
LIM014 R CENEP -12.0916 -77.0160 I 63 13 18 17 6
LIM015 R INICT -12.0839 -76.9968 I 49 12 16 38 22
LIM016 R IMCA -12.0695 -76.9548 I 48 9 12 20 6
LIM017 R URP -12.1316 -76.9791 III 45 12 13 23 10
LIM018 R OLIVO -11.9918 -77.0706 II 49 13 14 36 22
LIM019 R COMAS -11.9485 -77.0598 I 42 12 12 20 9
LIM020 R SROSA -11.7872 -77.1570 II 40 9 17 35 23
LIM021 R CARAB -11.9011 -77.0343 II 41 10 11 37 24
LIM022 R MDPP -11.8669 -77.0768 II 40 13 16 26 14
LIM023 R ANCON -11.7745 -77.1681 II 49 12 22 32 22
LIM024 R INDEP -11.9968 -77.0544 I 36 13 13 25 16
LIM025 R CEPRE -12.0935 -77.0616 I 14 8 8 4 3
LIM026 R SERVI -12.1302 -76.9951 I 3 2 0 3 1
LIM027 R UPCVI -12.1979 -77.0072 II 15 6 5 13 5
LIM028 R USILM -12.0728 -76.9518 II 37 10 9 26 18
LIM029 R UPCSM -12.0854 -77.0952 II 18 7 5 14 10
LIM030 R USILP -12.2357 -76.8675 II 27 8 7 17 11
LIM031 R OLAYA -11.9668 -77.0383 II 23 6 7 23 16
LIM032 S SCOLIVO -11.9836 -77.0668 II 7 5 1 6 6
LIM033 S SCHORR -12.1793 -77.0084 II 5 4 1 5 3
LIM-SLP R LIM-SLP -12.0150 -77.0470 - 46 7 22 6 4
D91A U UNI -12.0240 -77.0470 II 27 2 9 9 2
D95E U BRCHO -12.2170 -76.9930 III 15 1 7 3 2
D855 U PUNTA -12.0710 -77.1640 III 61 13 20 10 5
D914 U UNTELS -12.2130 -76.9320 III 53 8 21 25 13
D925 U ATARJEA -12.0340 -76.9750 - 49 6 14 8 3
9E7E U CIPLIM -12.0920 -77.0490 I 40 10 12 11 5
D958 U LURIN -12.2550 -76.9080 - 6 2 3 0 0
Total 2075 518 727 938 517

Note: The superscripts R and U denote stations belonging to the REDACIS and UPG-CIP networks, respectively. Stations operated in agreement with SENCICO are represented by subscript S

* Corresponding zone according to the current microzoning map.

TABLE II Summary of the networks and databases used in this study 

Network
REDACIS UPG-CIP
No. of events 219 132
No. of records 1695 380
No. of recording stations 42 9
Date recorded January 2011 - November 2021 November 2016 - November 2021
Sensors 130-SMA REFTEK, ETNA Kinemetrics, CV-374A2 Tokyo Sokushin, Basalt Kinemetrics* , Sigma-TS4G-ACC Gaiacode* 130-SMA REFTEK, 130-SMHR REFTEK, Basalt Kinemetrics*, Sigma-TS4G-ACC Gaiacode*
Sampling frequency (Hz) 200 200
Recording institution Japan-Peru Center of Earthquake Engineering Research and Disaster Mitigation Graduate School of the Faculty of Civil Engineering - Peruvian Society of Engineers
Magnitude range (Mw) 3.5 - 8.0 3.5 - 8.0
Epicentral distance range, Respect to Lima City (km) 3 - 1093 4-1087
Depth range (km) 11-175 12 - 141

* in agreement with SENCICO

3.2 IDENTIFICATION OF THE SITE DOMINANT FREQUENCY (fd)

We followed the same methodology introduced in Hassani & Atkinson [19]. In brief, to calculate H/V, first we computed the pseudo-response spectral acceleration (PSA, 5% damped) of each acceleration component using Newmark’s direct integration method over 501 structural frequencies in a bandwidth ranging from 0.2 Hz to 20 Hz. Thus, we calculated the mean of the two horizontal components (in log10 units). Then, H/V is obtained by dividing the geometric mean of the horizontal spectra by the amplitude spectrum of the vertical component, as follows.

log10H/Vij=0.5[log10H1ij+log10H2ij]log10Vij (1)

where (H1)ij  and (H2)ij  are the pseudo-response spectral acceleration (PSA, 5% damped) of the east-west and north-south components, respectively, and Vij is the PSA of the corresponding vertical component, recorded at station j from event i. Note we used base-10 log units and only stations that recorded at least three events were considered for the following steps. The H/V spectrum at each station is then calculated as the mean of the log H/V values, evaluated at frequencies in the range from 0.2 to 20 Hz on the log scale, since most of civil structures fall within this range.

log10H/V¯j,f=i=1nj,flog10H/Vijnj,f (2)

in which H/V¯j,fis the frequency average H/V response spectrum and nj,f is the number of the recorded events at station j at frequency f. After defining H/V¯j,f, we compute a bandwidth average, which is the average of the values of (2) as

log10H/V¯j=f1f2log10H/V¯j,fnj (3)

In equation 3, f1 and f2 are the limits of the usable frequency bandwidth, which are 0.2Hz and 20Hz respectively, and nj is the number of frequency points within this range. Then, a threshold is defined as the maximum value between 0.3 log units (which represents a minimum amplification of two in arithmetic units) and the bandwidth average plus 0.18 log units, as shown in (4). Only local maxima points over the threshold are fitted to a gaussian function along a neighborhood, and the value at which the gaussian function peaks is reported as the dominant peak, fd. Fitting a gaussian curve provides an objective and stable determination of fd considering both the amplitude and frequency values of the neighborhood. Further details of the methodology can be found in [18].

Threshold=max0.3 log unitsH/V¯j+0.18  (4)

To evaluate the sensitivity of fdvalues, the analyses were performed not only for the whole dataset, but also for four smaller datasets. We grouped seismic records according to different selection criteria, such as Mw, Depi and PGA, as presented in TABLE III. The number of events per criterion and per station are shown in TABLE I.

TABLE III Records grouping criteria used in this study 

GROUP Label No. events No. records
Magnitude greater than 3.5 Mw3.5 292 2075
Magnitude greater than 5.0 Mw5.0 55 518
Epicentral distance greater than 100km Depi100km 137 727
One horizontal PGA greater than 5 cm/s2  PGA5gal 153 938
One horizontal PGA greater than 10 cm/s2  PGA10gal 100 517

4. RESULTS

Despite the different values of dominant frequencies and their respective amplitudes, H/V response spectral ratios can be grouped based on their overall shape. For the subset that considered all available events (Mw3.5) about 43 % of the stations showed a single clear local maximum which is associated with fd(e.g., CAL005, Fig. 3-a). The rest of the H/V ratios can be divided into clusters having two peaks (10 % of the stations, Fig. 3-b), more than two unidentifiable peaks (jagged shape, Fig. 3-c) or no significant peaks (flatten shape, Fig. 3-d). For stations with two significant peaks, their respective fd is that with the highest amplification value.

For the ease of visualization, results of the spatial distribution of fd values are presented by dividing Lima city into three regions, as well as their respective seismic microzoning zones. H/V spectral ratios for important near- (2021 Mw 6.0 Mala, 2021 Mw 5.2 Callao), intermediate-(2007 Mw 7.9 Pisco) and far-field (2019 Mw 8.0 Lagunas, 2021 Mw 7.5 Barranca) earthquakes are also shown. It is important to mention that values of dominant frequencies are presented in Fig. 4, 5 and 6 only if they surpassed the threshold defined in (4). In addition, values in parenthesis represent the second peak, if encountered.

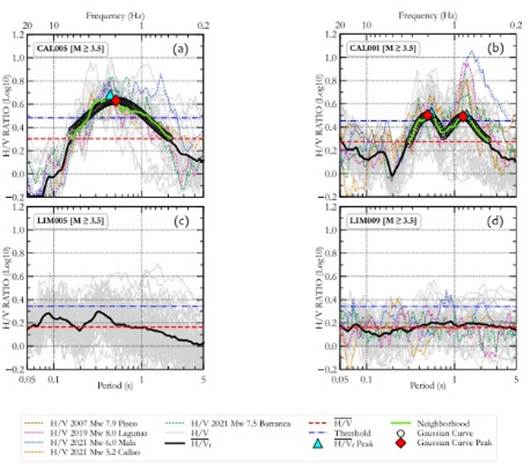
Fig. 3 Typical shapes of horizontal-to-vertical (𝐻/𝑉) response spectral ratios for records from seismic events with 𝑀𝑤 ≥ 3.5 (gray lines). Average (𝐻 ̅̅̅/̅̅𝑉̅𝑓) is represented by solid black lines. H/V response spectra for major earthquakes are presented in thin dashed colored lines. Thick dashed red lines show the bandwidth station average (𝐻 ̅̅̅/̅̅𝑉̅), as specified in (3), over the usable frequency range, whereas thick dashed-dotted blue lines show thresholds defined in (4). Cyan triangles represent local maxima points. Fitted Gaussian functions (circles) over considered neighborhoods (green line), as well as the selected dominant frequencies (red diamond), are also presented. 

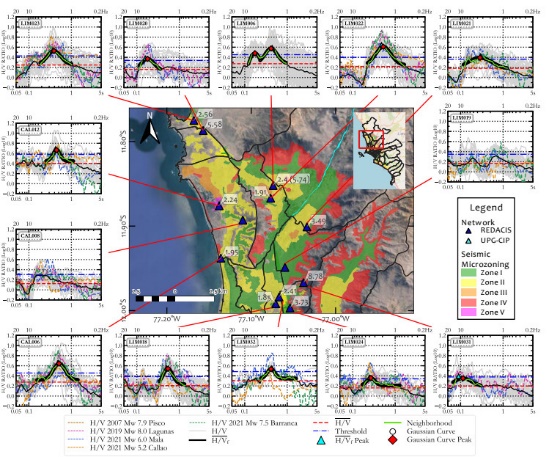
Fig. 4 H/V response spectral ratios of the northern part of Lima city. Values in parentheses are the second fd values sorted according to their amplification. 

Fig. 4 shows the northern part of Metropolitan Lima where, for example, LIM020 station shows a clear peak at 5.6 Hz, a value that agrees with reports that indicate that the area nearby is formed by eolian sands overlying alluvial gravel deposits very close to an andesitic volcanic formation ( [20], [21]). On the other hand, stations such as LIM022, LIM023, CAL012 and CAL006 show lower dominant frequencies, in the vicinity of 2 Hz, that correspond to thicker eolian formations or clayey deposits (LIM022, LIM023) and the effect of softer materials close to the coast (CAL006) or swampy soils nearby (CAL012).

Two dominant frequencies were identified in most of the stations located in the south-western area of Callao province (Fig. 5) where it is known that soil deposits consist of thick layers of soft clay and Vs30 values of about 300 m/s [17]. Hence, the observed two peaks represent both the influence of surficial soft soils (higher fd) and the impedance contrast in the deeper part of the substructure (lower fd). Towards the center of Metropolitan Lima, fdvalues tend to increase or to be unidentifiable due to either flat or jagged H/V spectral shapes. These areas are characterized by surficial gravel deposits (conglomerate) whose dominant peaks are expected at frequencies above 3 Hz ( [22], [23]).

Central and south-eastern areas of Lima city are shown in Fig. 6. Considerable variation of the values of fdare observed in the districts of Chorrillos and La Molina due to the transition from stiff to soft deposits within each district. Thick deposits of eolian sands are found in Villa El Salvador, coinciding with one of the lowest values of fd (e.g. LIM007 and D914 stations). It is important to highlight that, among the 51 stations analyzed, LIM009 station (Fig. 3-d) might be considered as a reference station due to the flat shape along the bandwidth considered for this study, in addition to the high value of Vs30 estimated (> 750 m/s) as part of the site characterization studies performed by SENCICO [24].

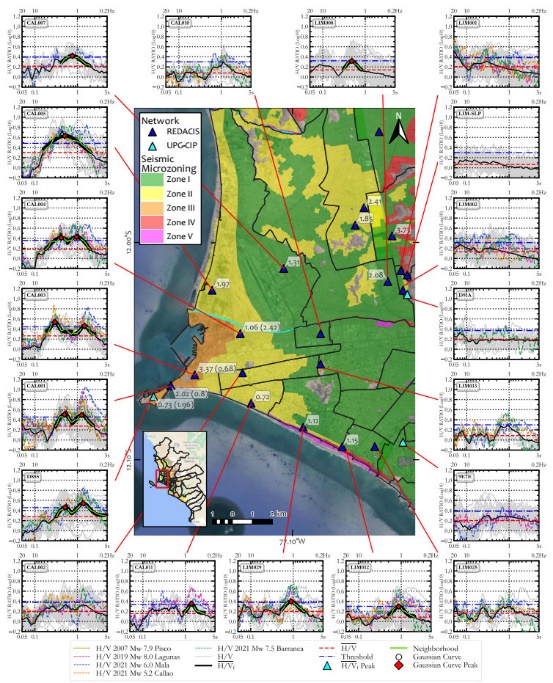
Fig. 5 H/V response spectral ratios of Callao province and central Lima city. Values in parentheses are the second fd values sorted according to their amplification. 

A comparison between the calculated values of fd and the frequency ranges assigned to the zones in the microzonation studies (see Table III) show that there is a good agreement in 47% of the cases, whereas 43% of the frequency values appear to correspond to the next unfavorable zone. In addition, in 10 % of the locations, the predominant peaks did not surpass the defined threshold. Also, flat spectral shapes were adopted as zone I, since small values of amplification are expected within the range of analysis. In this regard, the presented results might be considered as complementary information for future updates of microzonation studies in regions such as Callao Province, where the largest number of discrepancies is observed, or others that require more exploration points of ambient vibration.

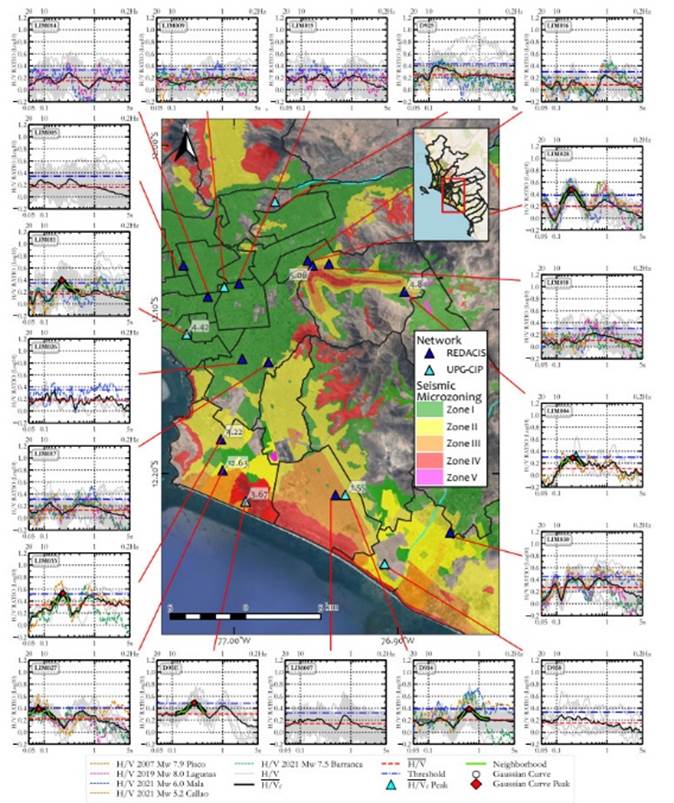
Fig. 6 H/V response spectral ratios of south-eastern Lima. Values in parentheses are the second fd values sorted according to their amplification. 

Fig. 7 shows the H/V response spectral ratios for CAL001 station grouped according to the criteria described in Table III. While H/V ratios have peaks with reasonably similar fd values for all cases, the amplitudes may vary, interchanging the order of significance of the low and high dominant frequencies. Thus, when considering all events (M≥3.5), the higher dominant frequency (shorter period) is chosen as fd due to its larger H/V amplitude. In all other cases, the lowest dominant frequency increases its importance. Far-field earthquakes, and those with considerable magnitude, such as the 2019 Mw 8.0 Lagunas event, caused high H/V amplification factors in the low frequency range, because of the energy content that arrived at the bottom of the soil profile and excited the deeper part of the substructure.

In most cases, variability of
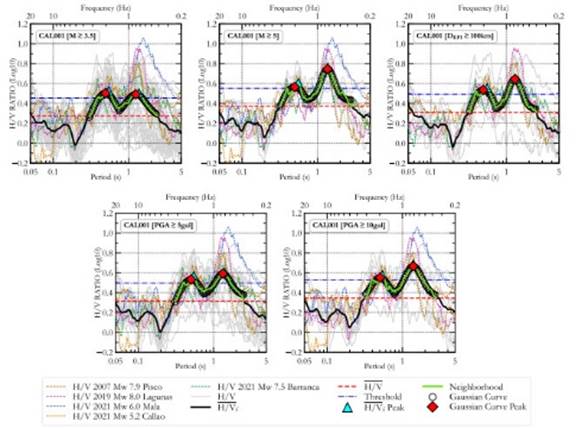
 fd values with respect to magnitude, epicentral distance and minimum PGA is not considerable, although changes between the values of fd and secondary peak frequencies are observed at certain stations when considering the group of far-field events (Depi100 km, e.g., stations CAL001, CAL011 and LIM028). Fig. 8 and TABLE IV shows results for all stations and the data subsets specified in TABLE III. The identification of fd was not possible in several cases since the average spectra showed peaks whose amplification does not exceed the established thresholds. Criterion of selecting events whose magnitude is greater than 5.0 presents higher effectiveness since it was possible to identify fd values in more cases (36 out of 51 stations). Finally, it is important to note that for larger deformation levels, fd could considerably change due to nonlinear effects. However, and since most PGA values in our database are lower than 200 gal, we could not expect the influence of nonlinear behavior to be important in our estimations [25].

Fig. 7 Results for H/V response spectral ratio of CAL001 station for all criteria in TABLE III. 

Fig. 8  fd distribution for all criterion selection and stations. For each station, the largest symbol size is for the first dominant frequency. 

TABLE IV Summary of the fd values for each criterion and station 

No Station code ALIAS Site dominant frequency fd (Hz)
Mw ≥ 3.5 Mw ≥ 5.0 Depi ≥ 100 km PGA ≥ 5 gal PGA ≥ 10 gal
1 CAL001R DHN 2.02 (0.8) 0.73 (2) 0.77 (2.02) 0.75 (1.98) 0.72 (1.98)
2 CAL002 R NISTA - 0.62 0.7 0.6 -
3 CAL003 R DSMI 3.37 (0.68) 3.41 (0.62) 3.5 (0.67) 3.36 (0.62) 3.29 (0.61)
4 CAL004 R RAMON 1.06 (2.42) 2.41 (1.03) 1.09 (2.31) 2.44 (0.95) 1.47
5 CAL005 R ACAPU 1.97 1.73 1.83 1.56 1.54
6 CAL006 R VHAYA 1.95 1.91 1.82 1.94 1.96
7 CAL007 R ESTAL 1.31 1.41 1.45 3.11 (1.26) -
8 CAL008 R AMORE - 4.93 4.42 4.73 -
9 CAL010 R BONDY - 0.86 0.89 - -
10 CAL011 R PRADO 0.72 0.64 0.69 (1.61) - 0.71 (2.87)
11 CAL012 R DEFEN 2.24 2.21 2.31 2.21 2.18
12 LIM001 R JALVA - - - - -
13 LIM002 R FIC - - - - -
14 LIM004 R PIQUE 4.84 4.27 - 4.84 4.84
15 LIM005 R RESER - - - - -
16 LIM006 R PIEDRA 2.4 (5.74) 2.2 2.25 2.17 2.14
17 LIM007 R VES - 1.2 1.25 - -
18 LIM008 R SMP 2.08 1.91 2.07 1.91 -
19 LIM009S BORJA - - - - -
20 LIM010 R MARTI - - - - -
21 LIM011 U, R CIPCN 4.42 4.62 4.52 4.39 4.08
22 LIM012 R UNFV 1.15 1.04 1.09 1.16 0.96
23 LIM013 R SANM - 1.03 1.15 0.94 -
24 LIM014 R CENEP - 3.18 - - 3.52
25 LIM015 R INICT - - - - -
26 LIM016 R IMCA - 0.98 0.96 - 0.8
27 LIM017 R URP - - - - -
28 LIM018 R OLIVO 1.85 1.84 1.76 1.83 1.84
29 LIM019 R COMAS - - 1.46 - -
30 LIM020 R SROSA 5.58 5.47 5.59 5.6 5.52
31 LIM021 R CARAB 3.49 3.73 3.21 3.44 3.71
32 LIM022 R MDPP 1.91 1.84 1.82 1.87 1.87
33 LIM023 R ANCON 2.56 2.56 2.6 2.54 2.52
34 LIM024 R INDEP 3.73 3.85 4.02 3.7 3.47
35 LIM025 R CEPRE - - 1.19 0.98 -
36 LIM026 R SERVI - - - - -
37 LIM027 R UPCVI 12.63 13.29 (1.72) 13.66 (1.87) 12.87 13.08
38 LIM028 R USILM 5.06 5.12 5.19 (1.09) 5.1 5.02
39 LIM029 R UPCSM 1.12 1.09 1.06 1.17 -
40 LIM030 R USILP - 1.23 4.46 (1.27) - -
41 LIM031 R OLAYA 8.78 10.43 9.83 8.78 8.63
42 LIM032 S SCOLIVO 2.41 2.39 - 2.41 2.41
43 LIM033 S SCHORR 4.22 4.38 - 4.22 -
44 LIM-SLP R LIM-SLP - - - - -
45 D91A U UNI - - - - -
46 D95E U BRCHO 3.67 - 0.96 (3.89) 3.31 -
47 D855 U PUNTA 0.73 (1.96) 0.71 (2.02) 0.7 (2.05) 0.65 0.67 (1.9)
48 D914 U UNTELS 1.55 1.48 1.54 1.49 1.46
49 D925 U ATARJEA - 6.39 6.85 - 6.24
50 9E7E U CIPLIM - - - - -
51 D958 U LURIN - - - - -

Note: The superscripts R and U denote stations belonging to the REDACIS and UPG-CIP networks, respectively. Stations operated in agreement with SENCICO are represented by subscript S. The values in parentheses are a second fd sorted according to their amplification.

CONCLUSIONS

Site dominant frequencies (fd) were calculated by means of the H/V response spectral ratios for 2075 seismic records at 51 stations in Lima city. The applied methodology provides a good estimate of fd values due to the smoothing effect inherently present when using a 5 % damped formulation. We were able to clearly determine peak frequencies for 76.5% of the strong motion stations (39 of 51 sites). It was not possible to identify fd at stations that had particular shapes in their respective H/V response spectral ratio (e.g. jagged or flattened) or when at least three seismic records were not available.

Two-peaked spectral shapes, with one of the dominant frequencies in the vicinity of 1 Hz, were observed for the coastal areas of Callao province, where the underlying soil consist of clayey/sandy deposits and regions with an important impedance contrast in the deeper part of the substructure. These values increment towards the center of the city coinciding with surficial gravel deposits (Lima conglomerate). The fdvalues identified are predominantly, in most cases, in agreement with the frequencies expected from the current seismic microzonation map.

Record selection criteria were adopted including minimum values of epicentral distance, moment magnitude and PGA. The average H/V response spectral ratios do not change significantly. However, amplitudes vary, changing the order of importance of the low and high dominant frequencies for some stations. This is mainly observed in far-field records (Depi>100km) and Mw>5.0 events.

Finally, results obtained in this study can be used for future updates of the microzoning map of Metropolitan Lima and for the estimation of reliable shear-wave velocity profiles by means of joint inversion procedures. Further analyses will consider the comparison of the estimated H/V response spectral ratio with those obtained from ambient vibration records and the compilation of information from the IGP seismic network.

ACKNOWLEDGMENT

This work was supported by the CONCYTEC-World Bank research program “Improvement and Extension of the services of the National System of Science, Technology and Technological Innovation” 8682-PE through its executing unit PROCIENCIA [Contract 038-2019].

REFERENCES

1 [] INEI, Statistical Compendium of the Province of Lima 2019, Lima: National Institute of Statistics and Informatics, 2019. [ Links ]

2 [] J. Villegas , M. Chlieh, O. Cavalié, H. Tavera, P. Baby, J. Chire and J. Nocquet, "Active tectonics of Peru: Heterogeneous interseismic coupling along the Nazca megathrust, rigid motion of the Peruvian Sliver, and Subandean shortening accommodation," Journal of Geophysical research: Solid Earth, vol. 121, no. 10, pp. 7371-7394, October 2016. [ Links ]

3 [] D. Argus, R. Gordon and C. DeMets, "Geologically current motion of 56 plates relative to the no‐net‐rotation reference frame," Geochemistry Geophysics Geosystems, vol. 12, no. 11, November 2011. [ Links ]

4 [] S. Villacorta, S. Núñez, L. Tatard, W. Pari and F. Lionel, "Geological hazards in the area of Metropolitan Lima and the Callao region.," INGEMMET, Lima, 2015. [ Links ]

5 [] E. Silgado, "Historia de los sismos más notables ocurridos en el Perú (1513 -1974)," Geodinámica e Ingeniería Geológica, no. 3, p. 130, 1978. [ Links ]

6 [] ASCE, Minimum Design Loads and Associated Criteria for Buildings and Other Structures, American Society of Civil Engineers, 2017. [ Links ]

7 [] British Standards Institution, Eurocode 8: Design provisions for earthquake resistance of structures. London, London: British Standards Institution, 1996. [ Links ]

8 [] Ministry of Housing, Construction and Sanitation., Technical Standard Of Building E.030-2018 Earthquake-Resistant Design, Lima: Ministry of Housing, Construction and Sanitation., 2018. [ Links ]

9 [] J. Zhao, K. Irikura, J. Zhang, Y. Fukushima, P. Somerville, A. Asano, Y. Ohno, T. Oouchi, T. Takahashi and H. Ogawa, "An Empirical Site-Classification Method for Strong-Motion Stations in Japan Using H/V Response Spectral Ratio," Bulletin of the Seismological Society of America, vol. 96, no. 3, p. 914-925, June 2006. [ Links ]

10 [] B. Idini, F. Rojas, S. Ruiz and C. Pasten, "Ground motion prediction equations for the Chilean subduction zone," Bulletin of Earthquake Engineering , vol. 15, pp. 1853-1880, 2017. [ Links ]

11 [] Standards New Zealand, NZS 4203:1992 General structural design and design loadings for buildings Part 4: Earthquake Provisions, Wellington: Standards New Zealand, 2004. [ Links ]

12 [] J. Lermo and F. Chávez-García, "Site effect evaluation using spectral ratios with only one station," Bulletin of the Seismological Society of America, vol. 83, no. 5, p. 1574-1594, 1993. [ Links ]

13 [] H. Kawase, F. Sánchez-Sesma and S. Matsushima, "The Optimal Use of Horizontal-to-Vertical Spectral Ratios of Earthquake Motions for Velocity Inversions Based on Diffuse-Field Theory for Plane Waves," Bulletin of the Seismological Society of America, vol. 101, no. 5, p. 2001-2014, October 2011. [ Links ]

14 [] H. Ghofrani and G. Atkinson, "Site condition evaluation using horizontal-to-vertical response spectral ratios of earthquakes in the NGA-West 2 and Japanese databases," Soil Dynamics and Earthquake Engineering, vol. 67, pp. 30-43, 2014. [ Links ]

15 [] E. Şafak, "Local site effects and dynamic soil behavior," Soil Dynamics and Earthquake Engineering, vol. 21, no. 5, pp. 453-458, July 2001. [ Links ]

16 [] F. Yamazaki and M. Ansary, "Horizontal-To-Vertical Spectrum Ratio Of Earthquake Ground Motion For Site Characterization," EARTHQUAKE ENGINEERING AND STRUCTURAL DYNAMICS, vol. 26, pp. 671-689, 1997. [ Links ]

17 [] D. Calderon, Z. Aguilar, F. Lazares, S. Alarcon and S. Quispe, "Development of a Seismic Microzoning Map for Lima City and Callao, Peru," Journal of Disaster Research, vol. 9, no. 6, 2014. [ Links ]

18 [] F. Yamazaki, C. Zavala, S. Nakai, S. Koshimura, T. Saito, S. Midorikawa, Z. Aguilar, M. Estrada and A. Bisbal, "Summary report of the SATREPS project on earthquake and tsunami disaster mitigation technology in Peru," Journal of Disaster Research, vol. 9, no. 6, pp. 916-924, December 2014. [ Links ]

19 [] B. Hassani and G. Atkinson, "Applicability of the Site Fundamental Frequency as a VS30 Proxy for Central and Eastern North America," Bulletin of the Seismological Society of America, vol. 106, no. 2, p. 653-664, April 2016. [ Links ]

20 [] CISMID, "Study of the Vulnerability and Seismic Risk in 42 districts of Lima and Callao," Japan - Peru Center for Earthquake Engineering Reseearch and Disaster Mitigation, National University of Engineering, Lima, 2005. [ Links ]

21 [] J. le Roux, C. Tavares and F. Alayza, "Sedimentology of the Rímac-Chillón alluvial fan at Lima, Peru, as related to Plio-Pleistocene sea-level changes, glacial cycles and tectonics," Journal of South American Earth Sciences, vol. 13, no. 6, pp. 499-510, November 2000. [ Links ]

22 [] S. Quispe, K. Chimoto, H. Yamanaka, H. Tavera, F. Lazares and Z. Aguilar, "Estimation of S-Wave Velocity Profiles at Lima City, Peru Using Microtremor Arrays," Journal of Disaster Research, vol. 6, no. 9, pp. 931-937, 2014. [ Links ]

[23] S. Quispe, H. Yamanaka, K. Chimoto, H. Tavera, Z. Aguilar and F. Lazares, "Evaluation of Local Site Amplification in Lima, Perú From Ground Motion Data," in 16th World Conference on Earthquake 16WCEE 2017, Santiago Chile, 2017. [ Links ]

[24] SENCICO, "Servicio de Consultoría Para Ejecución del Estudio Caracterización Geotecnica y Geofísica de Estaciones Acelerometricas del SENCICO," Terrasolutions Perú Consultores en Ingeniería, Lima, 2018. [ Links ]

[25] H. Kawase, "Site Effects Derived from Spectral Inversion Method for K-NET, KiK-net, and JMA Strong-Motion Network with Special Reference to Soil Nonlinearity in High PGA Records," Bull. Earthq. Res. Inst. Univ. Tokyo, vol. 81, pp. 309-315, 2006. [ Links ]

Received: December 13, 2021; Accepted: August 08, 2022

* Corresponding author: Angel Leandro Ccahua Laqui accahua@uni.pe

Creative Commons License This is an open-access article distributed under the terms of the Creative Commons Attribution License