


 Inglês (pdf)
 Artigo em XML
 Referências do artigo
 Enviar este artigo por email
 Citado por SciELO
  Similares em
SciELO
Similares em
SciELO 
 Permalink
1. INTRODUCTION
Underground structures serve as means of carrying out essential activities in a modern society. However, many of these structures have been built or will be built in areas of high seismic activity, and if they were to fail in an earthquake, it would generate a great negative impact. Therefore, it is necessary to know the seismic response of underground structures, since this allows to provide seismic resistant designs of future underground structures and to verify the need of reinforcement of the existing ones.
Seismic analysis of underground structures has been little addressed by researchers, which is due by the fact that such structures have experienced less damage in past earthquakes than that observed in aboveground structures [1][2][3]. However, there are reports of different levels of damage on underground structures in recent strong earthquakes such as the 1952 Kern County earthquake [4][5], the 1995 Kobe earthquake [6][7], the 1999 Chi-Chi earthquake [8], the 2004 Mid Niigata Prefecture earthquake [9][10] and the 2008 Wenchuan earthquake [11]. Therefore, seismic effects could be important in underground structures placed relatively close to the surface and surrounded by heterogeneous flexible soils.
2. PROBLEM STATEMENT
Underground structures are often considered lifeline structures (important and critical), such as subway tunnels or subway stations in metropolitan areas; so, they must remain operative immediately after a severe earthquake [12]. Consequently, the authors worked under the hypothesis that underground structures behave in the elastic range. Although an academic approach was considered for analysis in this work, the results provide a better understanding of the relative magnitude and distribution of the seismic demand over the structure. In this way, appropriate flexural strength and ductility shall be provided in an actual design case or rehabilitation.
The construction sequence for cut and cover tunnels can result in hinged joint connection between slabs and sidewalls; otherwise, when the structure performs beyond yielding point with inelastic behavior, plastic hinges appear at sidewall corners [6]. Taking this into account, it is proposed the analysis of both, a continuous structure and a hinged structure; thereby, these cases can be representative of the complex seismic behavior of underground structures. This paper is based on the undergraduate thesis “Seismic Analysis of Underground Structures” (in Spanish) by Jhonatan Garcia, with Hugo Scaletti as advisor [13].
3. STUDIED CASES
By means of numerical analysis the seismic response of the underground structure was obtained in terms of deformations and bending moments. This was done in order to evaluate the influence on the seismic response of factors such as wall thickness, soil type and earthquake intensity. Non-linear and inelastic behavior of the soil and its interaction with the structure were taken into account. Three structure geometries were evaluated, as shown in Figure 1, and each one was analyzed considering three wall thicknesses (0.80 m, 1.0 m and 1.2 m). The soil profile was varied between uniform granular, uniform cohesive and stratified soil with characteristic properties of Lima city. Most analyses were done for the continuous simple box-shaped structure.
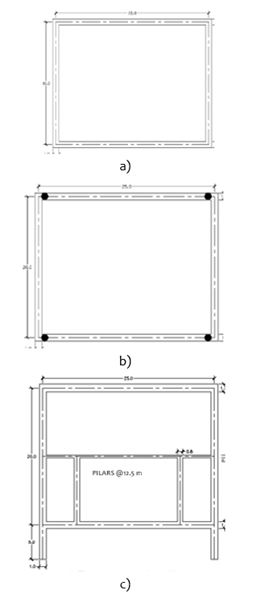
Fig. 1 Evaluated geometries for underground structures. (a) Continuous structure I, (b) Hinged structure, (c) Continuous structure II. [13].
4. NUMERICAL MODEL
This section briefly presents the considerations for the numerical modeling of the soil system and the structure, with plane strain conditions, using the FLAC computer program [14]. FLAC is a powerful and appropriate software for modeling soil-structure interaction problems. Some of its limitations are the need for very regular quadrilateral soil elements and that complex nonlinear models are not implemented for the structural elements.
4.1 STRUCTURE MODEL
The structure was modeled with linear and elastic frame elements. The elastic properties correspond to a concrete with nominal compressive strength of 28 MPa. Also, for simplicity, no-slip condition along the soil-structure interface was assumed.
4.2 SOIL PROPERTIES
The soil properties for the three soil profiles are presented in Table 1. The stratified soil properties are based on the work of Quispe et al. [15] which show the variation of shear wave velocity with depth at several points in Lima. The nonlinear and inelastic behavior of the soil subjected to cyclic loading was modeled using the sig3 hysteretic damping model of FLAC [14], which defines the backbone curve using three parameters and employs the Masing rules [16] to develop the hysteresis loops. The sig3 model was fitted to the upper limit of the shear modulus reduction and damping increase with shear strain curves of Seed and Idriss [17] for granular soils; and for cohesive soil it was fitted to the data of Vucetic and Dobry [18] with plastic index of 30. The fits are shown in Fig. 2 and Fig. 3, respectively.
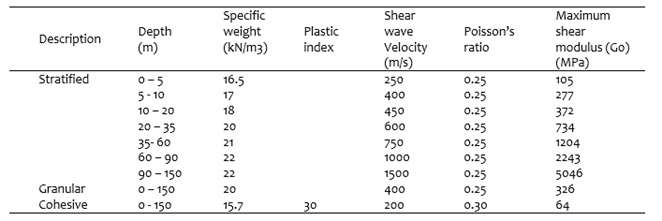
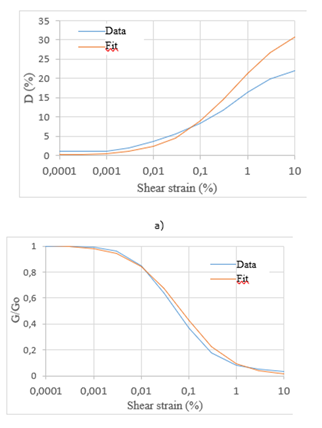
Fig. 2. Fit to Seed & Idriss [17] data. Sig3 model with a=1.008, b=-0.516 and x0=-1.157. (a) Increase in damping, (b) Shear modulus reduction.
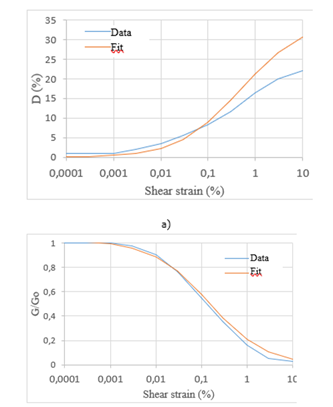
Fig. 3. Fit to Vucetic and Dobry [18] data with PI=30. Sig3 model with a=l.02, b=-0.612 and x0=-0.835. (a) Increase in damping, (b) Shear modulus reduction.
3.3 MESH AND BOUNDARY CONDITIONS
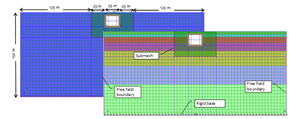
The maximum size of the soil elements was defined as one tenth of the wavelength for a maximum frequency of 10 Hz (4 m). In addition, in the region close to the structure, a submesh was attached with elements of maximum size equal to one eighth of the length of the bending elements (1.25 m). The displacements at the submesh boundary are made compatible by means of the “attach” elements of the software.
The boundary conditions consisted of a rigid base, where the earthquake acceleration was applied, and at both sides the free-field type boundary condition [14] was used; which consists of adding soil columns attached to the model by means of Lysmer & Kuhlemeyer’s viscous dampers [19]. The models used in the analysis are shown in Fig. 4.
3.4 EARTHQUAKE RECORDS
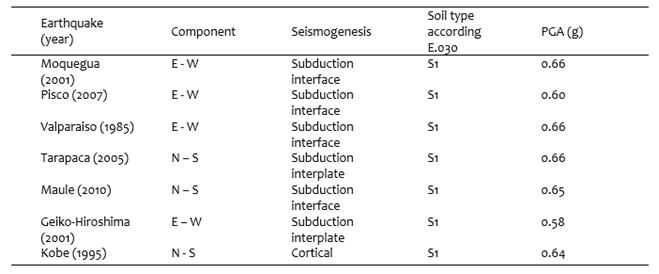
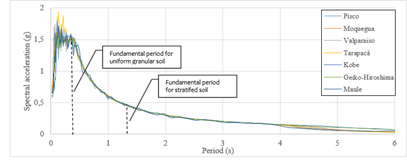
In this work the earthquake records provided by CISMID [20] were adjusted to the spectrum of the Peruvian seismic design code R.N.E. E.030 [21] for a soil type S1, which is equivalent to Site Class B according to the ASCE classification [22]. Since those records were obtained for a 475-year mean return period, for the purposes of this study they were scaled with factors 1.3 and 1.5, to represent events with 1000-year and 2475-year mean return periods, respectively. This simplified approach was based on the approximate correlation between seismic demands associated with mean return periods of 475-year, 1000-year and 2475-year used by several seismic design codes such as ASCE 7-16 [22] and the Peruvian design code [21]. The characteristics of the earthquake records used are shown in Table 2 and the corresponding acceleration spectra are shown in Fig. 5.
The fundamental period of vibration is also shown in Fig. 5. This was calculated for each soil profile using the software Deepsoil [23].
5. RESULTS DISCUSSION
Several time history dynamic analyses were performed considering scenarios of the structure placed in uniform granular soil and in stratified soil. Thus, with exception of section 5.2, the granular uniform soil scenario is referred to simply as uniform soil. In FLAC the analyses for gravitational and earthquake loads are carried out in sequence, so the forces and displacements corresponding to static equilibrium were subtracted to focus on the dynamic effects only. For each model node or element, a record of displacement or forces was obtained; these were externally processed to capture maximum earthquake effects along the time history. Therefore, the following results correspond to the maximum effects for each earthquake applied; envelopes for all the earthquakes were also obtained.
Due to the structure symmetry, the cyclic nature of loading and for simplicity, the underground structure seismic response is presented in terms of deformations and bending moments in one of the structure walls. The forces and deformations for the remaining portions of the structure are easily extrapolated from equilibrium and compatibility conditions.
The results were also interpreted in terms of serviceability, which is generally related to damage to structural elements and time required for repair. It was done by comparison with the observed damage to cut and cover tunnels in 1995 Kobe earthquake. So, the damage analysis for cut and cover tunnels presented by Nishiyama et al. [7] can be interpreted in terms of drifts in order to relate the results of this work to a corresponding damage level. In this way, observed drifts between 0.003 and 0.007 corresponded to yield of walls, with almost no damage. Observed drifts between 0.007 and 0.01 corresponded to repairable damage. Finally, observed drifts between 0.018 and 0.022 corresponded to structural elements reaching their ultimate limit state. The damage levels presented herein are for cases where shear failure did not occur, thus they had sufficient shear strength to develop its bending strength.
5.1 WALL THICKNESS INFLUENCE
Analyses were performed for the simple box shape structure varying the wall thickness to 0.8 m, 1.0 m and 1.2 m; for uniform and stratified soil cases. The resulting displacements were compared with those for the soil in the free field condition, which is referred as "ff' (in reference to free field).
5.1.1 Uniform Soil Case
Results shown are for the Moquegua earthquake. The maximum displacements and relative displacements in the structure are shown in Fig. 6 and corresponding bending moments are shown in Fig.7.
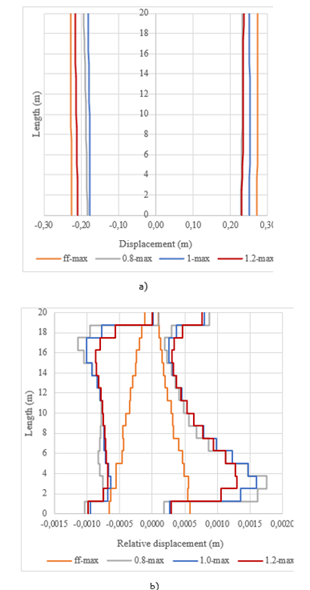
Fig. 6 Deformations for several thicknesses and free-field condition. (a) Maximum displacement (m), (b) Maximum relative displacement (m).
For the uniform soil case, there were small differences in maximum displacements. The influence of wall thickness is evident when looking at the relative displacements; these increased between 10% and 25% as the thickness decreases. The maximum drifts for this structure indicate that it remains in the elastic range. Similarly, the bending moments increased between 5 and 20% as the thickness increases. It was also observed, as a general pattern, that the bending moments are greater at the bottom corners than at the upper corners. This is due to the larger rotational restriction exerted by the soil around the corners at greater depths due to the higher confining pressure. As well as it is related to the minor shear strain at the bottom corners, which may differ for some stratified soils.
5.1.2 Stratified Soil Case
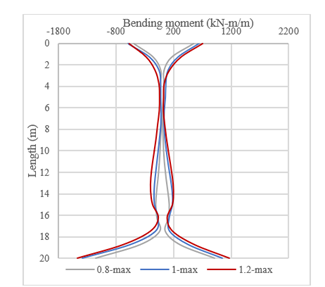
In this case the structure was analyzed with Moquegua, Valparaiso, Tarapacá, Geiko-Hiroshima and Kobe earthquakes for each wall thickness. Fig. 8 shows the maximum deformations obtained for each wall thickness and Fig. 9 shows both the average (solid lines) and maximum (dashed lines) values of the bending moments over the set of earthquakes and for each wall thickness.
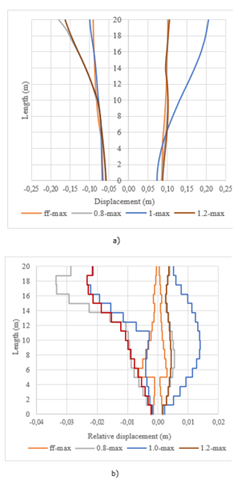
Fig. 8 Deformations for several thicknesses and free-field condition. (a) Maximum displacement (m), (b) Maximum relative displacement (m).
The presence of the underground structure has the effect of increasing the displacements when compared to those in the free field. The greatest differences occur in the less rigid strata, which in this case are the most superficial, where the structure displaces up to twice as much as that of the soil in the free field. From the middle of the structure downwards, where the strata are stiffer, the maximum displacements are gradually reduced until they are similar to those in free field. The relative maximum displacements (Fig. 8b) best represent the deformations along the wall. It is observed that these are similar to those corresponding to the free field in the lower part of the structure. However, for the rest of the structure, where the soil is less rigid, the relative displacements are different and greater than those in the free field. Because significant permanent deformations occur, the structure deforms more at one side than the other; thus, in the upper half, the relative displacements become more than ten times those corresponding to the soil in the free field.
The maximum relative displacements increase appreciably when the thickness is reduced from 1.2 m to 1 m, but when it is further reduced to 0.80 m, they increase by 40%. The deformations observed for the case of a 0.80 m wall thickness result in maximum drifts between 0.01 and 0.025; which, according to the underground structures performance observed in 1995 Kobe earthquake [7], may indicate significant damage or inoperable conditions. For wall thicknesses of 1.0 m and 1.2 m, maximum drifts between 0.007 and 0.018 were obtained; which may indicate repairable damage or structural elements close to reaching their ultimate limit state.
The results imply that for each particular underground structure there are wall thicknesses that do not provide proper service conditions or that could affect the safety of the structure. It should also be considered that since the structure was analyzed under the hypothesis of elastic behavior, the deformations would actually be greater.
The average moments over the set of earthquakes (hereinafter referred to as average moments) for a 1.0 m wall thickness are 30% greater than the average moments for a 0.80 m thickness. The same situation occurs in the lower portion of the structure for the maximum moments over the set of earthquakes (hereinafter referred to as maximum moments) for a 1.0 m wall thickness when compared to a 0.80 m wall thickness, because a stiffer soil is present there. However, in some intermediate points and at top comers, the maximum moments for a 0.80 m wall thickness can significantly exceed (between 5 and 20%) the maximum moments for a 1.0 m wall thickness.
At middle height and at top corners of the structure the average moments for a 1.2 m wall thickness are greater than the average moments for a 1.0 m wall thickness, but reach similar values at bottom comers. The maximum moments for a 1.2 m wall thickness are similar to maximum moments for a 1.0 m wall thickness at bottom comers, and similar to the maximum moments for a 0.80 m wall thickness at top comers. While at the middle portion of the structure, the maximum values for a 1.2 m wall thickness are between 30 and 40% greater than the maximum moments for other wall thicknesses.
5.2 SOIL TYPE INFLUENCE
A comparison was made of the structure seismic response when placed in uniform cohesive or uniform granular soils, representing a soft and a stiff soil, respectively; and also compared against a stratified soil. The results allow a general understanding on the effect of soil type and quality for a projected or existing underground structure under a severe earthquake event. The soils properties used were shown in Table 1.
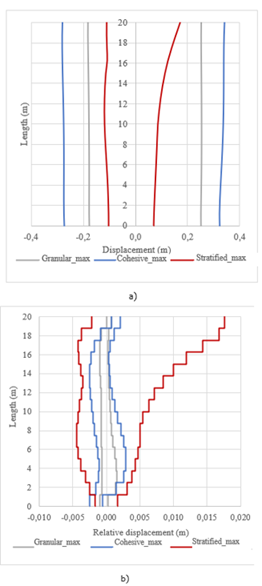
Fig. 10 Deformations for several soil types. (a) Maximum displacement (m), (b) Maximum relative displacement (m).
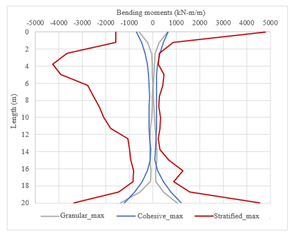
Fig. 10a shows that the structure in cohesive soil experiences greater displacements than those for other soil types; and for the granular soil case results in greater displacements than the stratified soil case. An important difference is observed between the relative displacements for the stratified soil case when compared with the case of uniform soil (Fig. 10b). Thus, the relative displacements in the stratified soil reach ten to thirty times the corresponding ones in uniform soil cases. Also, the structure in cohesive soil experiences relative displacements that are between two and three times those for the granular soil case.
The bending moments for the Moquegua earthquake are shown in Fig. 11. The bending moments for the stratified soil case are much greater and differ in shape from the bending moments for uniform soil cases. Thus, at top comers the moments for stratified soil case are almost seven times those for the uniform soil cases. In the middle portion the moments for the stratified soil case are at least thirty times greater; and at bottom comers, the moments in the stratified soil case are around three times those in uniform soil cases. Bending moments for uniform granular and uniform cohesive soil cases are similar, with differences smaller than 20%.
5.3 EARTHQUAKE INTENSITY EFFECT
This section shows the differences in deformations and bending moments induced in the structure by earthquakes with 475-year, 1000-year and 2475-year return periods. In the context of Peruvian seismic design code E. 030 [21] and for this work purposes, such earthquake return periods are approximated by using factors of 1, 1.3 and 1.5, respectively, applied to the 475-year return period acceleration records from CISMID [20].
5.3.1 Uniform Soil Case
The following results correspond to the Moquegua earthquake. It was observed that the maximum relative displacements show the same distribution along the wall for all return periods analyzed. However, the 475-year return period displacements were 20% to 30% lower than those corresponding to larger return periods. The maximum relative displacements for the 1000- and 2475-year return periods show greater similarity, with differences about 10%.
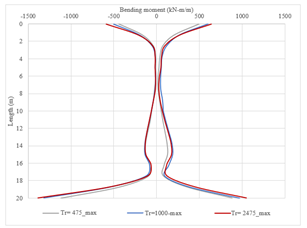
The corresponding bending moments are shown in Fig.12. The 475-year return period bending moments are up to 15% smaller than 1000-year return period bending moments. The moments for the 1000-year and 2475-year return periods differ by less than 10%.
5.3.2 Stratified Soil Case
In this case the structure was analyzed with the Moquegua, Valparaiso, Tarapacá, Geiko-Hiroshima and Kobe earthquakes. Each earthquake was applied three times, using acceleration records corresponding to 475-year, 1000-year and 2475-year mean return periods. Fig. 13 shows the maximum deformations obtained over the set of earthquakes, grouped by return period. Similarly, Fig. 14 shows both the average (solid lines) and maximum (dashed lines) values for bending moments over the set of earthquakes for each return period.
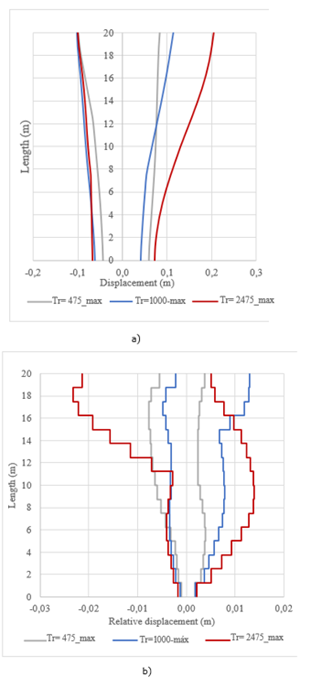
Fig. 13 Deformations for several earthquake return periods. (a) Maximum displacement (m), (b) Maximum relative displacement (m).
The 475-year earthquake displacements near the top corner were slightly smaller than those corresponding to the 1000-year return period; in other parts of the structure the displacements were similar. The largest displacements corresponding to 2475-year return period were about twice the displacements for the other return periods.
The relative displacements for a 475-year return period were smaller, particularly at top corners. The relative displacements for 1000-year and 2475-year return periods were similar for the lower half of structure. However, at the top corner the relative displacement for a 2475-year return period were at least 70% greater than those for the 1000-year return period. Maximum drift for a 475-year return period was 0.006, which indicate a nearly undamaged structure. Maximum drift for a 1000-year return period was 0.01, which would indicate a repairable damaged structure. Maximum drift for a 2475-year return period was approximately 0.018, which would indicate structural elements close to their ultimate limit state.
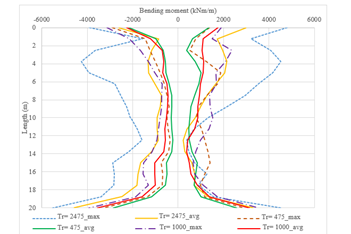
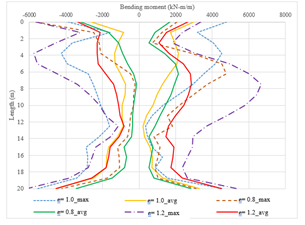
Fig. 14 Comparison of bending moments (kN-m/m) for several earthquake return periods in stratified soil.
The maximum moments over the set of earthquakes (hereinafter referred to as maximum moments) for both a 475-year and 1000-year return periods, in most of the structure were between 30% and 40% greater than the average moments over the set of earthquakes (hereinafter referred to as average moments); but at bottom corners were between 10% and 20% greater. It was observed that the maximum moments for a 475-year return period were of similar magnitude than the average moments for a 1000-year return period. Likewise, the maximum moments for a 1000-year return period show little differences with the average moments for a 2475-year return period. The maximum moments for a 2475-year return period were between 40% and 50% greater than the average moments.
5.4 COMPARISON BETWEEN CONTINUOUS STRUCTURE AND ARTICULATED STRUCTURE
Analyses were carried out for the continuous structure I and the hinged structure I (Fig. 1a and 1b) with wall thicknesses of 0.8 m, 1.0 m and 1.2 m; and for uniform and stratified soil cases. The results were compared with the free field motion, which is referred to as "ff' (in reference to free field)
5.4.1 Uniform Soil Case
The following results correspond to the Moquegua earthquake. The maximum displacements and relative displacements in the structures are shown in Fig. 15 and the related bending moments are shown in Fig.16. It is observed that both structures deform more than the free field, with no significant differences in the maximum displacements (Fig. 15a). However, the maximum relative displacements are similar at mid height but increase towards the comers for the hinged structure, while they decrease for the continuous structure (Fig. 15b). The thickness evaluation for the hinged structure shows little differences for displacement. The maximum bending moments in the hinged structure are between 30 and 40% of the maximum bending moments in the continuous structure. It is also observed that for the hinged structure the maximum moments increased approximately 30% with each 0.20 m increase in wall thickness.
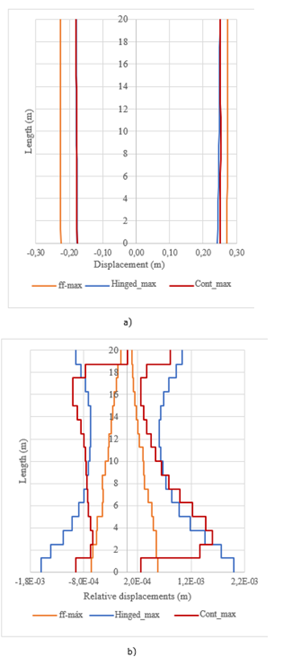
Fig. 15 Deformations for continuous structure I and hinged structure. (a) Maximum displacement (m), (b) Maximum relative displacement (m).
5.4.2 Stratified Soil Case
In this case the hinged structure was analyzed with Moquegua, Valparaiso, Geiko-Hiroshima and Kobe earthquakes for 0.8 m, 1.0 m and 1.2 m wall thicknesses. The resulting maximum deformations for the hinged structure (solid lines) over the set of earthquakes are compared in Fig.17 with those for the continuous structure I (dashed lines), for 0.8 m and 1.0 m wall thicknesses. Displacements were also compared with free field displacements (referred to as “ff”). For both structures the displacements are larger than in the free field and increase at top comers, which is the region of less rigid strata. The maximum relative displacements (Fig. 17b) best represent the structures behavior. For the hinged structure with 1.2 m wall thickness, the relative displacements were around half of those obtained with a 1.0 m wall thickness. Also, for the hinged structure with 0.8 m wall thickness, towards top comers, the relative displacements were twice the corresponding ones for a 1.0 m wall thickness; they are also larger than those corresponding to the continuous structure with the same wall thickness. This indicates that in very flexible structures increasingly larger deformations may occur in the zone of less rigid strata, due to a significant loss of soil stiffness, which can be avoided with a stiffer structure. This is due to the highly non-linear soil behavior.
The maximum drift for the hinged structure with 1.0 m and 1.2 m wall thickness was between 0.008 and 0.016, which would indicate a repairable damaged structure. Maximum drift for the hinged structure with 0.8 m wall thickness was approximately 0.04, which would indicate structural elements in their ultimate limit state or inoperable conditions.
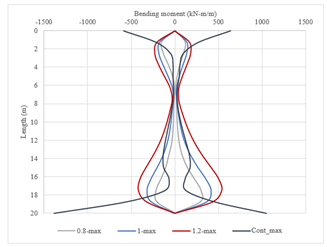
Fig. 18 shows both the average (solid lines) and maximum (dashed lines) values for bending moments over the set of earthquakes for the hinged structure with 0.8 m, 1.0 m and 1.2 m wall thicknesses, compared with average and maximum bending moments for the continuous structure I with 1.0 m wall thickness. The largest moments in the continuous structures are at the top corners, while in the hinged structure they occur at some distance from the top. A similar tendency was observed in values and distribution of average moments for the continuous and the hinged structure with 1.0 m wall thickness.
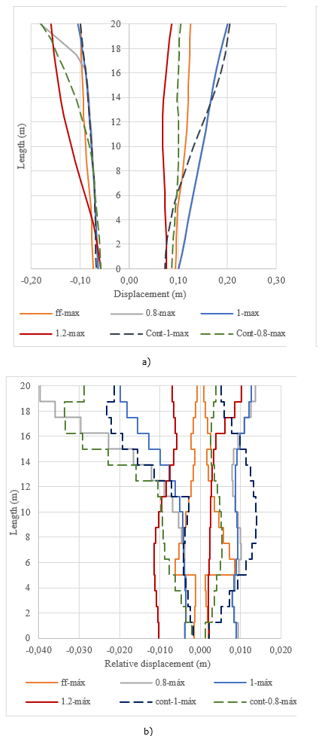
Fig. 17 Deformations for hinged and continuous structures. (a) Maximum displacement (m), (b) Maximum relative displacement (m).
However, the maximum moments over the set of earthquakes (hereinafter referred to as maximum moments) for the hinged structure were larger than the maximum moments for the continuous structure. The maximum moment for the hinged structure with 0.8 m wall thickness exceed the maximum moment for the continuous structure with 1.0 m wall thickness. For the hinged structure with 1.2 m wall thickness, the average moments were similar to the maximum moments for the continuous structure with 1.0 m wall thickness. Maximum moments for the hinged structure with 1.2 m wall thickness were 20% larger than maximum moments for the continuous structure in the region of less rigid strata.
It is worth noting that while in a uniform soil the tendency is for deformations to be similar as the structure becomes more flexible, in a stratified soil the more flexible structures show this tendency only in strata that do not lose too much stiffness. In strata with a significant loss of stiffness the deformations may increase as the structure is more flexible and they can reach levels that result in significant damage or inoperable conditions.
5.5 STRUCTURE WITH SUBWAY STATION TYPOLOGY
This section shows the results of time-history dynamic analysis for a structure with geometry representing an underground mass transit system (subway) station (Fig. 1c). The 7 earthquakes associated to a 2475-year return period indicated in Table 2 were used. The structure was analyzed for uniform and stratified soil profiles. The following figures show the maximum bending moments for one of its walls, obtained over the set of earthquakes.
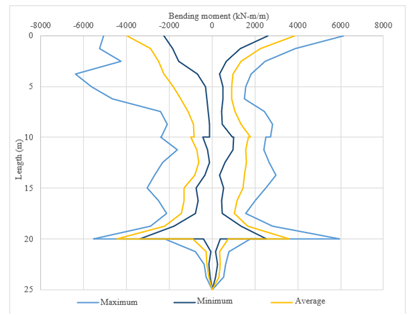
5.5.1 Uniform Soil Case
When the structure is placed in uniform soil, the maximum bending moment for several earthquakes fitted to the same target spectrum show small differences. Fig. 19 shows the maximum, minimum and average values over the set of earthquakes. It is observed that the moments differ 20 to 24% from the average values.
5.5.2 Stratified Soil Case
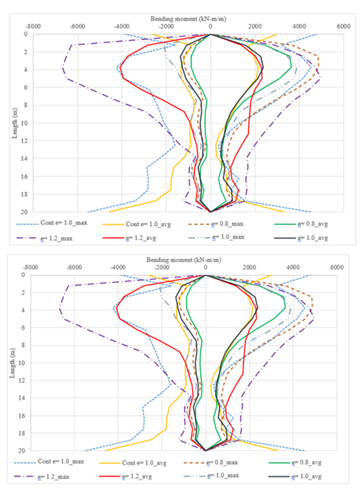
When the structure is placed in stratified soil, the maximum bending moment for several earthquakes fitted to the same the target spectrum shows important differences. Fig. 20 shows the maximum moments for each earthquake and Fig. 21 shows the maximum, minimum and average values over the set of earthquakes. It is observed that at the comers the moments may differ approximately 65% from the average values, while at the intermediate region were between two and three times the average values.
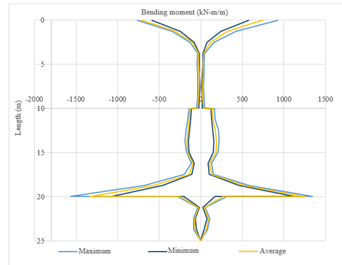
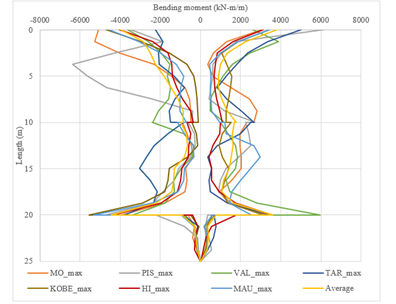
Fig. 20 Maximum bending moments (kN-m/m) using several earthquakes fitted to same target spectrum in stratified soil.
CONCLUSIONS
The authors worked under the hypothesis that underground structures behave in the elastic range. Although an academic approach was considered for analysis in this work, the results provide a better understanding of the relative magnitude and distribution of the seismic demand over the structure. In this way, appropriate flexural strength and ductility shall be provided in an actual design case or rehabilitation.
The seismic response of an underground structure placed in a homogeneous soil differs from that placed in an heterogeneous stratified soil. The homogeneous soil case shows orderly movement (the shear strain does not vary abruptly and is smaller than 0.2%); while for the stratified soil case the difference in strata stiffness results in large shear strains. Therefore, significantly larger deformations and bending moments will occur in the structure (more than three times the corresponding values for the homogeneous soil case).
The structure seismic response in uniform cohesive and uniform granular soils cases studied (soft and stiff soils, respectively) showed the larger displacements for the cohesive soil case. However, small differences in bending moments resulted. The displacements in cohesive soil were also larger than those obtained in the heterogeneous soil case; however, the relative displacements were significantly smaller. For both homogeneous soil cases, the bending moments were smaller (between 25 and 30%) than those for the heterogeneous soil case.
The wall thickness has little influence in the uniform soil case. However, for the heterogeneous soil studied, the wall thickness shows significant influence; so, for a 0.80 m wall thickness the soil experiences an important stiffness reduction and large deformations were observed in the structure (distortions in the order of 2%) that may imply the occurrence of significant damages. Deformations were better controlled with a 1.0 m wall thickness. Walls of greater thickness reduce the deformations and increase the moments due to the increase of stiffness.
The construction sequence for cut and cover tunnels can result in hinged joint connection between slabs and sidewalls; otherwise, when the structure performs beyond yielding point with inelastic behavior, plastic hinges appear at sidewalls corners [6]. Taking this into account, both, a continuous structure and a hinged structure were analyzed in this work; thereby, these cases can be representative of the complex seismic behavior of underground structures
For hinged structures the wall thickness becomes more important. For relatively small wall thicknesses, deformations were amplified (20% greater distortions obtained for hinged 0.80 m walls comparing with the corresponding continuous case), which would indicate significant damage or inoperable conditions; according to underground structures performance observed in 1995 Kobe earthquake [7]. Increasing the wall thickness in a hinged structure has a significant effect in controlling the deformations (distortions were reduced 50% or 70% with 1.0 m or 1.20 m walls thickness, respectively). Therefore, hinged structures with wall thickness that provide sufficient stiffness may be more economical than continuous structures with the same wall thickness; due to the lower bending moment demand.
The underground structure placed in heterogeneous soil shows significant differences when applying several different earthquakes, although fitted to same target spectrum, especially for bending moments, due to the highly non-linear soil behavior under cyclic loading.
By applying sets of earthquakes associated to different return periods, the maximum bending moments, over the set of earthquakes, for a 1000-year return period were similar to the average bending moments for a 2475-year return period. Also, the maximum bending moments, over the set of earthquakes, for a 2475-year return period were between 40% and 50% greater than the maximum bending moments for 1000-year return period.
From the results it can be inferred that if an underground structure does not exceed its ultimate limit state for a 2475-year return period earthquake, thus it would probably remain operative immediately after a 475-year return period earthquake and; it would result in a repairable damage condition after a 1000-year return period earthquake.

