


 Inglês (pdf)
 Artigo em XML
 Referências do artigo
 Enviar este artigo por email
 Citado por SciELO
  Similares em
SciELO
Similares em
SciELO 
 Permalink
1. INTRODUCTION
The soil-water characteristic curve (SWCC) is widely used to estimate the properties of unsaturated soils [1] and has been useful in the implementation of unsaturated soil mechanics in geotechnical engineering practice [2]. However, the determination of SWCC in a laboratory is very expensive due to the equipment and environmental conditions in which they must be performed.
Therefore, this process of SWCC determination is used more for research purposes. An alternative method is the filter paper test, conventionally used to determine SWCC in clay soils. In this test, the filter paper is used as a passive sensor to evaluate the matric and total suction of the soil, in which the variables are controlled to measure the water content of the filter paper that is in direct contact with the soil, or in equilibrium with the partial pressure of water vapor in the air of an airtight container enclosing the soil sample [3]. In this paper, the application of the filter paper test to obtain the SWCC of sandy soils is investigated. As a result of the test, discrete values of moisture content vs. suction are obtained. The set of discrete points obtained from the filter paper test is then fitted to the empirical equations of Brooks and Corey [4], Van Genuchten [5], Fredlund and Xing [6], with which the specific parameters for these sandy soils are obtained.
2. BACKGROUND
The use of filter paper as a moisture sensor to determine SWCC has been progressively developed and investigated. The method is based on the fact that when a soil sample with a certain moisture content is put in contact with another material with the ability to absorb moisture, this material will become wet as water will flow from one to the other until equilibrium is reached [7]. Since filter paper is a highly absorbent material, this mechanism is considered to perform the filter paper test to determine the matric and total suction.
There are factors that can affect the suction estimates with the filter paper test, including absolute temperature, however, it was found to have a small effect on the determination of soil suction. It has been found that the factor that has a large effect on the determination of suction is the temperature fluctuation during the test [8]; therefore, adequate control of the environmental conditions must be taken to ensure that the temperature fluctuation during the test is minimal.
Another important factor is the accuracy in determining the amount of water absorbed by the filter paper. The filter paper is a good indicator of soil suction, however, the small amount of water to be measured with the filter paper requires high accuracy in determining the mass of the filter paper, which should be measured to the nearest 0.0001 g [9]. In addition, the measurement must be performed with extreme care [10].
The filter paper test can be applied to a wide range of soil suction measurements and can be used to measure both metric and total suction. When using the test to measure matric suction, three sheets of filter paper are placed in the soil sample, with the two outer sheets protecting the center sheet. A minimum of seven days is required for the moisture content between the filter paper and the soil to reach equilibrium. At the end of this period, the water content absorbed by the central sheet of filter paper is measured and the value of the matric suction is determined from a calibration curve. In addition, the moisture content of the soil sample is determined to obtain a SWCC point. Several soil samples with different moisture contents are tested to determine the SWCC. In this test, it is important to note that if the soil has a low moisture content, the filter paper will absorb very little water, so its measurement will be affected by the ambient temperature, leading to inaccurate results in the suction measurement.
To measure total suction, two sheets of filter paper are suspended above the soil sample. Water vapor will flow from the soil to the filter paper until equilibrium is reached. Research indicates that the contact (matric suction) filter paper test is more consistent than the non-contact (total suction) method of measuring suction [11]. Therefore, the filter paper test requires further investigation.
Whatman No. 42 filter paper, which was used in this study, is commonly used for filter paper testing. ASTM D5298 [3] presents a calibration curve between absorbed water and suction for this type of filter paper. The equations of the calibration curve proposed in this standard are as follows:
si: w≤45.3%: log10 ψ= 5.327-0.0779w (1)
si: w>45.3%: log10 ψ=2.412-0.0135w (2)
Where:
ψ: suction of soil, kPa
w: Gravimetric water content, %.
SWCC plays an important role in extending saturated soil mechanics to include the behavior of unsaturated soils [2]. SWCC was initially used simply as a fitting relationship between suction and water content to determine in situ soil suction; however, SWCC proved to be invaluable for estimating the properties of unsaturated soils [12]. Consequently, a large number of empirical equations have been proposed to determine the SWCC with a better fit to the laboratory data. In the present paper, the model of Brooks and Corey [4], which divides the SWCC into two zones, the model of Van Genuchten [5], which proposed a SWCC equation with three parameters, and the model of Fredlund and Xing [6] have been considered. The equations for SWCC proposed by these models are reproduced below.
2.1 BROOKS AND COREY MODEL
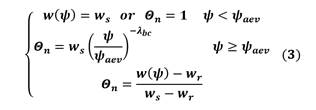
where:
w(ψ): water content at any soil suction, %,
ψ: soil suction value, kPa,
w s : saturated water content, %,
w s : residual water content, % (contenido de agua cuando el aire se encuentra de manera continua en los vacíos del suelo)
λ bc : fitting parameters,
ψ aev : air entry suction, kPa,
Θ n : normalized water content.
2.2 VAN GENUCHTEN MODEL
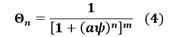
where:
Θ n : normalized water content.
ψ: soil suction value, kPa,
a, n, m: fitting parameters.
2.3 FREDLUND AND XING MODEL
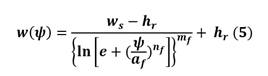
where:
w (ψ): water content at any soil suction, %
w s : water content of saturated soil, %.
h r : water content, % (contenido de agua cuando el aire se encuentra de manera continua en los vacíos del suelo)
a f , n f , m f : fitting parameters,
e: base of the natural logarithm,
3. METHODOLOGY
An experimental study was carried out to determine the SWCC of sandy soils. The filter paper test was performed to determine the matric and total absorption of these soils. Three sand samples were selected from the districts of Villa El Salvador (P3), Miraflores (P4) and Lurín (P5), all located in the city of Lima - Peru.
3.1 MATERIAL
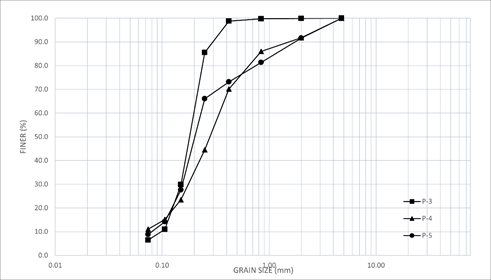
The soil samples selected for testing are classified as sand with silt (SP-SM). Figure 1 shows the grain size distribution of samples P-3, P-4 and P-5, which have grain sizes between 4 and 200 mesh. The specific gravities of samples P-3, P-4 and P-5 are 2.76, 2.70 and 2.81, respectively. In order to determine the compacity of the soil, the natural densities in situ and the maximum and minimum densities in the laboratory were determined, from which the relative densities of each of the samples were obtained. A summary of the soil parameters is shown in Table I.
Table I Summary of properties of the three sandy soils
| P-3 | P-4 | P-5 | ||
| LOCATION | VILLA EL SALVADOR | MIRAFLORES | LURÍN | |
| USCS | SP-SM | SP-SM | SP-SM | |
| GRAVEL (%) | 0.00 | 0.00 | 0.00 | |
| SAND (%) | 93.5 | 88.9 | 91.2 | |
| FINES (%) | 6.5 | 11.1 | 8.8 | |
| LIQUID LIMIT (%) | N.P. | N.P. | N.P. | |
| PLASTIC LIMIT (%) | N.P. | N.P. | N.P. | |
| SPECIFIC GRAVITY | 2.76 | 2.75 | 2.81 | |
| RELATIVE DENSITY | 60 | 50 | 23 |
3.2 SPECIMEN PREPARATION
Before preparing the soil specimens, it was necessary to calibrate the volume of the glass containers. For this purpose, a defined volume of distilled water was used and a mark was placed on the glass surface of the container, which served as a reference level for the reconstitution of the soil specimen.
All soil specimens were obtained by the "moist tamping" reconstitution method, in which dry sand was mixed with a percentage by weight of water that varied from 1% to 22%. The material was placed in layers and tamped until the relative density at which each of the soil samples was found in its natural state was reached. The soil specimen was reconstituted into six layers. Three sheets of filter paper were placed after the third layer (see Figure 2 (a)). Finally, a rubber ring was placed on top of the last layer and two sheets of filter paper were placed on top of the ring for total suction measurement. The glass vessel was hermetically sealed and kept in this condition to achieve equilibrium moisture content (see Figure 2 (b)).
3.3 TESTING EQUIPMENT AND PROCEDURES
Nine specimens of each soil sample, each with a different moisture content, were reconstituted in glass containers for soil suction measurements. The containers were hermetically sealed. To avoid variations in ambient temperature, all samples were placed in 2 containers, a polypropylene container and an expanded polystyrene container (see Figure 2(c)), where they remained for a period of 7 days. A thermohygrometer was used to record the variation of temperature and relative humidity inside the containers during the test (see Figure 2(d)), and it was found that the variation of temperature during the storage period of the samples was within +- 1°C. After the seven-day period, the filter paper sheets were removed and the wet weights of each were regitered.
The matric and total suction values were obtained from the calibration curve used for each sample. Nine suction values were obtained from the moisture contents determined in the filter paper tests. The SWRC Fit program was used to perform a nonlinear fit of the SWCC [13]. This program has up to six fitting models for the SWCC, of which the three models mentioned above were used in the present study.
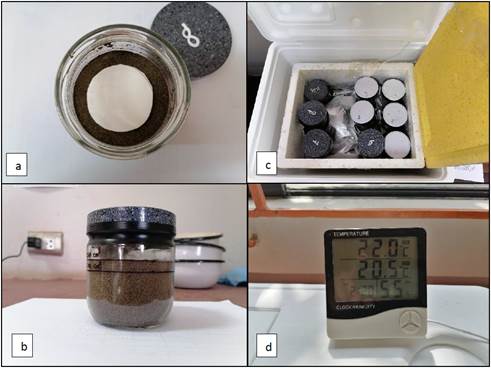
Fig. 2 (a) Three filter papers were placed after the third layer of material. (b) The glass container was hermetically sealed to achieve equilibrium. (c) A polyurethane container and an expanded polystyrene container were used for the containers storage. (d) Thermo-hygrometer used to record the temperature variation inside the containers.
4. RESULTS
The experimental values of matric and total suction obtained from the filter paper test for the three sand samples are shown in Table II.
Table II. Experimental results for Matric and Total Suction
| P-3 | P-4 | P-5 | ||||||
| Matric suction (kPa) | Total suction (kPa) | Grav. Water content (%) | Matric suction (kPa) | Total suction (kPa) | Grav. Water content (%) | Matric suction (kPa) | Total suction (kPa) | Grav. Water content (%) |
| 0.12 | 58.74 | 19.80 | 1487.03 | 2050.79 | 1.9 | 62.048 | 14647.31 | 1.90 |
| 0.18 | 151.33 | 17.48 | 56.45 | 214.21 | 3.94 | 7.934 | 4583.67 | 3.83 |
| 0.40 | 59.6 | 8.18 | 11.94 | 183.68 | 5.78 | 1.226 | 3212.96 | 5.80 |
| 0.44 | 71.89 | 7.85 | 0.93 | 87.74 | 7.7 | 0.692 | 1961.86 | 7.56 |
| 0.65 | 62.69 | 6.20 | 0.41 | 121.1 | 9.734 | 0.402 | 982.78 | 10.55 |
| 0.78 | 76.52 | 5.92 | 0.182 | 131.63 | 12.346 | 0.255 | 829.34 | 13.77 |
| 2.82 | 91.27 | 4.3 | 0.15 | 125.03 | 15.31 | 0.211 | 626.79 | 16.62 |
| 24.45 | 181.84 | 2.59 | 0.116 | 81.82 | 18.209 | 0.120 | 421.54 | 19.50 |
| 491.56 | 736.21 | 1.60 | 0.0238 | 85.86 | 21.187 | 0.095 | 381.90 | 20.09 |
According to the data obtained from the filter paper test, it can be observed that the minimum matric suction was obtained in sample P-4 and had a value of 0.0238 kPa for a soil moisture content of 21.187%. In addition, the maximum matric suction obtained for the same material was 1487.03 kPa for a soil moisture content of 1.9%. This behavior may be due to the fact that sample P-4 has a higher fines content than the other samples
Regarding the total suction obtained for sample P-3, the minimum total suction was 58.74 kPa obtained for a moisture content of 19.80% and the maximum total suction was 736.21 kPa for a moisture content of 1.0%. For sample P-4, the minimum total suction was 81.82 kPa for a moisture content of 18.21% and the maximum total suction was 2050.8 kPa for a moisture content of 1.9%. For sample P-5, the minimum total suction was 381.9 kPa for a moisture content of 20.09% and the maximum total suction was 14647.31 kPa for a moisture content of 1.9%.
All the experimental data were plotted on a semi-logarithmic graph as shown in Figure 3.
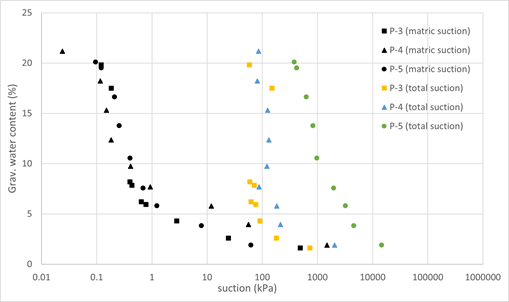
According to Figure 3, the discrete points of matric suction of the three tested samples P-3, P-4 and P-5 show a good trend along the curve, despite the fact that they have different fine content, void ratio and gradation. However, it can be seen that the discrete points of the matric suction of sample P-4 are slightly flatter than those of the other 02 samples (P-3 and P-5). This could be due to the higher percentage of fines present in sample P-4, showing the influence of the fines content on the geometry of the SWCCs. Further research is required to estimate the influence of such factors on the SWCC of matric suction using the filter paper test.
Regarding the discrete points of the total suction, it can be noted that there is no trend that allows to fit the data, this may be due to the influence of the factors that affect the above-mentioned suction measurements; therefore, further research is needed for the use of this test in the determination of the total suction.
The experimental data of the matric suction were used to obtain the fitting parameters of the models shown above. The program "SWRC Fit" was used for this purpose. The fit parameters are shown in Table 3.
Table 3. Parameters obtained from experimental data, for the three evaluated models
| SWCC | P-3 | P-4 | P-5 | ||||||
| Brooks and Corey, 1964 | Van Genuchten, 1980 | Fredlund and Xing, 1994 | Brooks and Corey, 1964 | Van Genuchten, 1980 | Fredlund and Xing, 1994 | Brooks and Corey, 1964 | Van Genuchten, 1980 | Fredlund and Xing, 1994 | |
| w s | 19.797 | 23.626 | 20.172 | 21.19 | 22.346 | 21.391 | 19.800 | 22.579 | 20.859 |
| w r | 2.5167 | 2.7029 | -- | 3.3039 | 3.3213 | -- | 2.3713 | 2.6062 | --- |
| a f | -- | -- | 0.1890 | -- | -- | 0.10417 | -- | --- | 0.1888 |
| n f | -- | -- | 5.7079 | -- | -- | 4.3084 | -- | --- | 2.9894 |
| m f | -- | -- | 0.6023 | -- | -- | 0.48824 | -- | --- | 0.7474 |
| h r | -- | -- | 0.000051 | -- | -- | 0.000069 | -- | --- | 0.000022 |
| ψ aev | 0.15967 | -- | -- | 0.07486 | -- | -- | 0.15882 | --- | |
| λ bc | 1.1124 | -- | -- | 0.5839 | -- | -- | .8076 | --- | |
| a | -- | 5.4111 | -- | -- | 11.665 | -- | -- | 5.375 | |
| n | -- | 2.4492 | -- | -- | 1.6259 | -- | -- | 2.0128 | |
| m | -- | 0.59 | -- | -- | 0.38 | -- | -- | 0.50 | |
| R2 | 0.992 | 0.985 | 0.999 | 0.976 | 0.967 | 0 .984 | 0.996 | 0.993 | 0.997 |
Where:
w s : saturated water content, %,
w r: residual water content, %,
a f , n f , m f : fitting parameters of Fredlund y Xing model,
h r : residual water content, %,
ψ aev, λ bc : fitting parameters of Brooks y Corey model,
a, n, m: fitting parameters of van Genuchten model.
R 2: correlation coefficient.
Each set of matric suction experimental data was plotted on a semilogarithmic graph along with the 03 models. As can be seen in Fig. 4, Fig. 5 and Fig. 6, the fits performed have coefficient of variation (R2) values between 0.96 and 0.999, showing a better fit with the Fredlund and Xing model for all the samples studied.
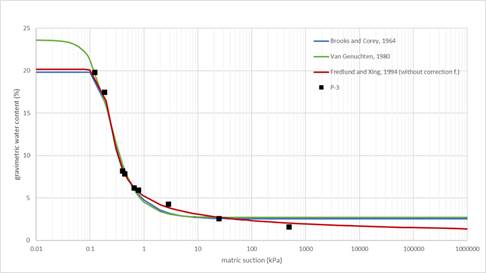
Fig. 4 Matric suction values for the sand sample P-3: coefficient of variation (R2) greater than 0.98 for the 03 models used.
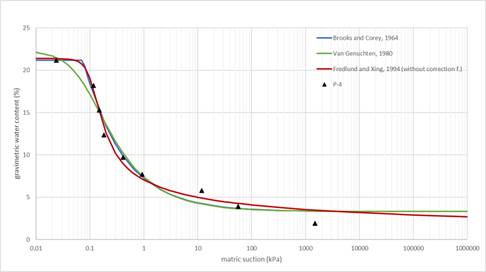
Fig. 5 Matric suction values for the sand sample P-4: coefficient of variation (R2) greater than 0.96 for the 03 models used.
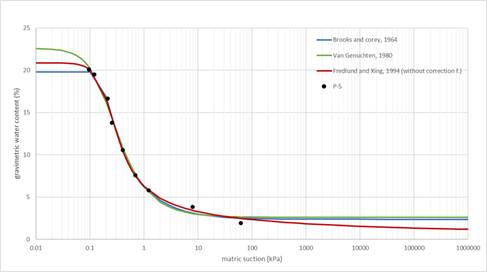
Fig. 6 Matric suction values for the sand sample P-5: coefficient of variation (R2) greater than 0.99 for the 03 models used.
There are several factors that affect the SWCC of sandy soils, such as initial water content, void ratio and grain size distribution [14], [15] and [16]. In addition, the variation of climatic conditions causes the soil to fluctuate in drying (desorption) and wetting (absorption) cycles, making the drying and wetting cycle one of the important factors that can affect SWCC [17]. When a soil goes through the drying and wetting cycle, two different SWCCs are observed; therefore, there is no single SWCC for the same material. The difference between these two SWCCs is known as soil hysteresis [18].
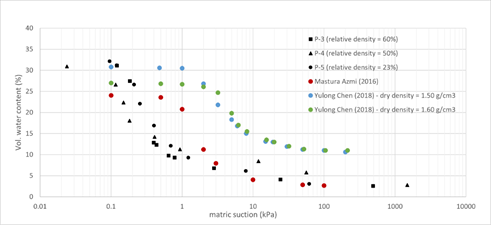
Figure 7 shows a comparison of the SWCCs with the results of other investigations on sandy soils [19], [20]. It is observed that these results are biased to the right with respect to the results obtained with the filter paper test. This different behavior may be due to the procedure followed by each test method. On the one hand, the filter paper test follows the wetting cycle, and on the other hand, the typical tests that determine the SWCC follow the drying procedure, since they start from the saturation of the sample (it reaches the saturated water content) and an ascending suction is applied until the water flow is stabilized for each suction applied, generating a desaturation of the material.
The results obtained from the total suction (see Figure 3) do not have the form of a SWCC, this may be due to many factors, such as possibly a longer storage time required to reach equilibrium, smaller range of variation of the ambient temperature, or others; therefore, the adjustment of the data obtained in these filter paper tests was not performed.
CONCLUSIONS
The filter paper test proved to be a simple method for estimating the SWCC of sandy soils, mainly for matric suction. The test was performed using Whatman No. 42 filter paper, requiring a period of 7 days to reach equilibrium.
The results obtained show that the Fredlund and Xing model provides a better fit for sandy soils, yielding higher correlation coefficient (R2) values (> 0.98) than the other models (Brooks and Corey, and Van Genuchten).
The studies carried out with the filter paper test report tests on unaltered samples of fine soils. In the present study, the test was carried out on sandy samples reconstituted by the "moist tamping" method, obtaining reliable results in accordance with the literature.
By comparing the results of the filter paper test with the results obtained for similar materials in laboratory tests, it can be observed that the values of the filter paper test are slightly lower. This may be mainly due to the hysteresis phenomenon caused by the drying and wetting cycles of the material.
It is observed that the fines content in sandy soils influences the shape of the SWCC, since a higher percentage of fines results in a greater extension or flattening of the SWCC.
The filter paper test has been found to be inaccurate in estimating total suction. This may be due to the need for longer storage time or limitations of the filter paper test.
The standards related to the filter paper test indicate that this test can estimate suction values between 10 to 100000 kPa. However, in the present research it was possible to obtain suction values below 10 kPa, providing a better defined SWCC for low suction ranges.
The filter paper test allows the absorption (wetting) curve to be obtained. This provides a SWCC that is complementary to the desorption (drying) curve obtained from typical SWCC tests.

