


 Inglés (pdf)
 Articulo en XML
 Referencias del artículo
 Enviar articulo por email
 Citado por SciELO
  Similares en
SciELO
Similares en
SciELO  uBio
uBio 
 Permalink
INTRODUCTION
Lake Titicaca is the highest navigable lake in the world, 3810 meters above sea level. It is located in the tropical Andes (northern Altiplan of Peru and Bolivia). Lake waters mainly comes from precipitation on the lake (47 %), and rivers and streams (53 %) (Roche, Bourges, & Mattos, 1992). This lake is an important source of fresh water for the population who lives around it and is home to endemic species (Kroll et al., 2012). Due to its location near important cities and mine activities, this lake evidences the presence of metal pollution in sediments, water and fish (Monroy, Maceda-Veiga, & de Sostoa, 2014) and also, (Archundia et al., 2017) reports the presence of antibiotic residues in water samples on the Bolivian side of this lake. In that respect, there is little information related to the presence of organic contaminants in this lake.
On the other hand, population growth and technological industrial progress have resulted in an increased demand for new products, new technologies and new manufacturing processes, (Elliott et al., 2017), thus generating the presence of POPs that are omnipresent in various components of the environment such as water, sediments and the atmosphere, (Brahushi et al., 2017). POPs are mainly composed of the polychlorinated biphenyls (PCB), organochlorine pesticides (OCP), polybrominated diphenyl ethers (PBDE) and polycyclic aromatic hydrocarbons (PAHs) (Brahushi et al., 2017). PAHs, PCBs and OCPs represent an important group of POPs that have caused worldwide concern as toxic environmental pollutants, since they represent a potential health risk, causing carcinogenic, mutagenic and teratogenic effects, (Christensen & Bzdusek, 2005).
In this respect, water and sediments contaminated with POPs are generally the main origin of the biomagnification of these compounds through the food web (Peng et al., 2016). There for, their presence in sediments is a major concern, (Elliott et al., 2017). Due to their strong hydrophobicity, POPs have their final destination in sediments, which in turn become the repository and source of contamination, (Ramesh et al., 2004). In addition, POPs have a high affinity for organic matter, making them prone to a strong association with sediments, (B. Wang et al., 2016). The resuspension of sediment associated with POPs under certain environmental conditions (such as wind, benthic disturbance, flow turbulence and the event of flooding) makes these sediments become a source of contamination, (Polder et al., 2016).
The presence of POPs in the environment can affect organisms that inhabit aquatic systems, particularly in shallow lakes, (Barni et al., 2016). Eutrophic parameters such as total organic carbon (TOC), total phosphorus (TP) and total nitrogen (TN) influence the distribution, destination and behavior of PAHs and PCBs in an eutrophic lake, (B. Wang et al., 2016). Therefore, the determination of the levels of POPs in sediments can provide basic information about the state of contamination, the sources and the ecological risk of these pollutants in aquatic environments, (Barni et al., 2016). However, in recent years there have been no exhaustive studies on the presence of these pollutants in Lake Titicaca. Therefore, sediments from the Inner Bay of the lake were analyzed, providing data on the concentration and spatial distribution of the POPs and PAHs studied.
MATERIALS AND METHODS
Study area
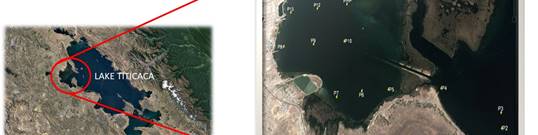
The study was developed in the Inner Bay of Lake Titicaca, Puno (Figure 1), in which 13 sampling points were considered: the stations 1, 2 and 3 were located in the village of Ojherani, at a distance of 14 km from the southern part of the city of Puno. The stations 4, 5 and 6 were located closer to the water intake for drinking water for the city of Puno (EMSAPUNO,Chimú). The stations 7, 8 and 9 located in the area of the bus terminal of the city of Puno and stations 10, 11, 12 and 13 located near the transit route of boats that provide transport services for tourists to the floating Uros Islands, near Isla Esteves and the main pier of Puno. For the sampling process, a Van Veen dredge was used, and approximately 5.0 kg of sediment was obtained from three points in each station. The samples were mixed and approximately 200 mg of it was collected and conditioned in amber glass. After labelling, the samples were stored at -18°C and transferred to Brazil in a cold chain. After being lyophilized, the samples were stored at -70°C for analysis.
Chemical reagents
For the chromatographic analyses, the following reagents were used: ultrapure water (Pura-Q. Brazil), ethyl acetate and toluene HPLC grade (M Tedia, USA), analytical standards of POPs and PAHs with more than 98.9 % purity were purchased from Dr. Ehrenstorfer (Augsburg, Germany) and ChemService (West Chester, PA, USA), and acetic acid P.A. Individual stock solutions were prepared at a concentration of 1 mg/mL in HPLC-grade toluene and stored at -18 °C. For the validation process, a sediment without POPs and PAHs residues obtained from a private area located in the city of Piracicaba, Sao Paulo (State), Brazil was used.
Determination and analysis of POPs
The quantification of POPs. (α-BHC, β-BHC, Heptachlor, Dicofol, α-endosulfan, β-endosulfan, Endosulfan sulfate, p,p̕-DDD, o,p̕ -DDD, p,p̕-DDE, o,p̕-DDE and Mirex), was performed using a gas chromatograph (Agilent, model 7890A), equipped with an electron capture detector (GC-μECD) and Agilent HP capillary column (30 m x 320 μm x 0.25 μm). For the data analysis and the control equipment, the Chem Station B.04.02 software was used. The operating conditions of the GC-μECD system were based on a furnace with an initial oven temperature of 150°C with an increase in temperature up to 210°C at 20 °C/min, maintained for 3 min, then increased to 230°C to 15°C/min maintained for 5 min and finally the temperature was increased to 280°C at 20°C/min, trailing gas (N2) with a constant flow of 1 mL/min; detector temperature 300 °C, make-up gas (N2) of 39 mL/min. Total time of the analytical run was 23 minutes. The quantification of the compounds was performed with calibration curves made in the matrix extract.
Determination and analysis of PAHs
A liquid phase chromatographic system (Agilent, model 1200), coupled to a fluorescence detector (HPLC-FLD) and a Phenomenex (C18) 125 mm x 4.60 mm column with a pre-column (30 mm x 4.6 mm) (Envirosep PP), was used; 2 mL/min of water and acetonitrile 40-60 % was used as a mobile phase in isocratic mode. The total run was 30 min with 5 min of a post run, to determine the presence and concentration of Naphthalene, Acenaftene, Fluorene, Phenanthrene, Anthracene, Fluoranthene, Pirene, Benzo (a) Anthracene, Chrysene, Benzo (b) Fluoranthene, Benzo (K) Fluoranthene, Benzo (a) Pyrene, Dibenzo (a, h) anthracene, Benzo (g, h, i) perylene, Indene (1,2,3c, d) and pyrene.
Preparation of samples for analysis of POPs
1.0 g of lyophilized sediment was weighed, then placed in a Teflon tube with a volume of 50 mL, 5 mL of toluene: ethyl acetate (1:1 v/v), 1 % of acetic acid as extraction solvent was added; the sample was stirred for 1 minute in a vortex, and then centrifuged for 10 minutes at 5000 RPM at a temperature of 10°C; the supernatant was collected and filtered using a 0.2 μm filter. Finally, a total volume of 1 μL was injected into the GC-μECD in the pulsed splitless mode for the corresponding analysis. The validation of the analytical method was carried out using the following parameters: recovery, repetition and uncertainty, Inmetro (2011). The calibration curve for persistent organic compounds was constructed in relation to six points, in the concentrations of 0.0005, 0.0075, 0.075, 0.2, 0.5 and 1 μg/mL, which showed a correlation r2 ≥ 0.999.
Preparation of samples for analysis of PAHs
1.0 g of lyophilized sediment was weighed, placed in a Teflon tube of 50 mL capacity, then 10 mL of acetonitrile was added as an extraction solvent, then it was stirred for 1 minute in a vortex. The tubes were then placed in an ultrasound equipment for 10 minutes, and centrifuged for 10 minutes at 5000 RPM at a temperature of 10°C until the solid-liquid separation was produced. All the liquid was collected in test tubes filters using a 0.2 μm filter to avoid the presence of particulate matter in suspension. The sample tubes were placed in a dryer with nitrogen flow until the sample dried, after which 1 mL of acetonitrile was added. Finally, 20 μL was injected into the HPLC-FLD system for their respective analysis.
Validation of analytical methods
Validation studies were carried out by fortifications in 1.0 g of lyophilized sediment sample without residues of POPs and PAHs, with the solution of the organochlorine pesticide standards in three levels of 0.005, 0.05 and 0.1 μg/g fortification and in the case of PAHs, concentrations of 0.08 and 0.8 μg/g were considered with five repetitions in each level. After the fortification, the samples were left at rest for the period of one hour. Table 1 and 2 show the values of the validation process of the analytical methods used.
Table 1 Validation results of the analytical method for the determination of POPs. (REC = Recovery, CV = Coefficient of variation, SD REC = Standard deviation of recovery, MU = Measurement uncertainty).
| COMPOUND | RECOVERY | REPEATABILITY | UNCERTAINTY OF MEASURING METHOD | |||||||||
|---|---|---|---|---|---|---|---|---|---|---|---|---|
| 0.08 µg/g | 0.8 µg/g | 0.08 µg/g | FORTIFICATIONS AVERAGE | |||||||||
| REC % | SD | CV % | REC % | SD | CV % | REC % | SD | CV % | AVERAGE REC % | SD REC % | VARIATION MU % | |
| Naphthalene | 91.5 | 0.005 | 10.3 | 65.1 | 0.016 | 4.2 | 92.2 | 0.002 | 3.8 | 82.93 | 15.44 | (83 ± 22) |
| Acenaphthene | 93.3 | 0.004 | 7.9 | 78.7 | 0.018 | 4.1 | 97.0 | 0.004 | 7.0 | 89.65 | 9.69 | (90 ± 12) |
| Fluorene | 92.8 | 0.004 | 7.0 | 76.8 | 0.025 | 5.7 | 96.9 | 0.005 | 8.8 | 88.84 | 10.62 | (89 ± 14) |
| Phenanthrene | 97.2 | 0.004 | 7.3 | 76.2 | 0.060 | 13.8 | 100.9 | 0.003 | 5.3 | 91.44 | 13.30 | (91 ± 17) |
| Anthracene | 128.4 | 0.005 | 6.2 | 101.5 | 0.035 | 6.1 | 134.1 | 0.006 | 7.8 | 121.34 | 17.40 | (121±17) |
| Fluoranthene | 97.9 | 0.005 | 8.2 | 84.3 | 0.037 | 7.7 | 104.4 | 0.004 | 7.5 | 95.54 | 10.22 | (96 ± 12) |
| Pyrene | 105.6 | 0.006 | 10.2 | 70.3 | 0.067 | 16.6 | 113.6 | 0.006 | 8.6 | 96.47 | 23.03 | (96 ± 28) |
| Benzo (a) anthracene | 81.2 | 0.007 | 14.2 | 83.8 | 0.089 | 18.6 | 89.8 | 0.014 | 16.8 | 84.91 | 4.39 | (85 ± 6) |
| Chrysene | 96.7 | 0.002 | 3.9 | 87.2 | 0.021 | 4.2 | 96.4 | 0.008 | 14.7 | 93.43 | 5.40 | (93 ± 7) |
| Benzo (b) Fluoranthene | 102.9 | 0.004 | 7.0 | 89.3 | 0.047 | 9.2 | 113.9 | 0.004 | 5.6 | 102.03 | 12.30 | (102±14) |
| Benzo (k) fluoranthene | 94.6 | 0.001 | 2.0 | 92.9 | 0.025 | 4.7 | 100.1 | 0.003 | 4.8 | 95.86 | 3.78 | (96 ± 5) |
| Benzo (a) pyrene | 114.9 | 0.002 | 3.5 | 94.5 | 0.007 | 1.2 | 118.2 | 0.003 | 4.5 | 109.22 | 12.81 | (109±14) |
| Dibenzo (a, h) anthracene | 108.3 | 0.003 | 4.4 | 100.7 | 0.014 | 2.5 | 111.9 | 0.004 | 6.7 | 106.99 | 5.72 | (107 ± 6) |
| Benzo (g, h, i) perylene | 75.5 | 0.001 | 3.3 | 73.0 | 0.018 | 4.3 | 90.2 | 0.012 | 17.4 | 79.54 | 9.31 | (80 ± 14) |
| Indeno(1,2,3-c,d)pyrene | 104.1 | 0.005 | 8.7 | 75.7 | 0.013 | 2.9 | 117.5 | 0.004 | 5.9 | 99.08 | 21.35 | (99 ± 25) |
Table 2 Validation results of the analytical method for the determination of PAHs. . (REC = Recovery, CV = Coefficient of variation, SD REC = Standard deviation of recovery, MU = Measurement uncertainty)
| COMPOUND | RECOVERY | REPEATABILITY | UNCERTAINTY OF MEASURING METHOD | |||||||||
|---|---|---|---|---|---|---|---|---|---|---|---|---|
| 0.08 µg/g | 0.8 µg/g | 0.08 µg/g | FORTIFICATIONS AVERAGE | |||||||||
| REC % | SD | CV % | REC % | SD | CV % | REC % | SD | CV % | AVERAGE REC % | SD REC % | VARIATION MU % | |
| Naphthalene | 91.5 | 0.005 | 10.3 | 65.1 | 0.016 | 4.2 | 92.2 | 0.002 | 3.8 | 82.93 | 15.44 | (83 ± 22) |
| Acenaphthene | 93.3 | 0.004 | 7.9 | 78.7 | 0.018 | 4.1 | 97.0 | 0.004 | 7.0 | 89.65 | 9.69 | (90 ± 12) |
| Fluorene | 92.8 | 0.004 | 7.0 | 76.8 | 0.025 | 5.7 | 96.9 | 0.005 | 8.8 | 88.84 | 10.62 | (89 ± 14) |
| Phenanthrene | 97.2 | 0.004 | 7.3 | 76.2 | 0.060 | 13.8 | 100.9 | 0.003 | 5.3 | 91.44 | 13.30 | (91 ± 17) |
| Anthracene | 128.4 | 0.005 | 6.2 | 101.5 | 0.035 | 6.1 | 134.1 | 0.006 | 7.8 | 121.34 | 17.40 | (121±17) |
| Fluoranthene | 97.9 | 0.005 | 8.2 | 84.3 | 0.037 | 7.7 | 104.4 | 0.004 | 7.5 | 95.54 | 10.22 | (96 ± 12) |
| Pyrene | 105.6 | 0.006 | 10.2 | 70.3 | 0.067 | 16.6 | 113.6 | 0.006 | 8.6 | 96.47 | 23.03 | (96 ± 28) |
| Benzo (a) anthracene | 81.2 | 0.007 | 14.2 | 83.8 | 0.089 | 18.6 | 89.8 | 0.014 | 16.8 | 84.91 | 4.39 | (85 ± 6) |
| Chrysene | 96.7 | 0.002 | 3.9 | 87.2 | 0.021 | 4.2 | 96.4 | 0.008 | 14.7 | 93.43 | 5.40 | (93 ± 7) |
| Benzo (b) Fluoranthene | 102.9 | 0.004 | 7.0 | 89.3 | 0.047 | 9.2 | 113.9 | 0.004 | 5.6 | 102.03 | 12.30 | (102±14) |
| Benzo (k) fluoranthene | 94.6 | 0.001 | 2.0 | 92.9 | 0.025 | 4.7 | 100.1 | 0.003 | 4.8 | 95.86 | 3.78 | (96 ± 5) |
| Benzo (a) pyrene | 114.9 | 0.002 | 3.5 | 94.5 | 0.007 | 1.2 | 118.2 | 0.003 | 4.5 | 109.22 | 12.81 | (109±14) |
| Dibenzo (a, h) anthracene | 108.3 | 0.003 | 4.4 | 100.7 | 0.014 | 2.5 | 111.9 | 0.004 | 6.7 | 106.99 | 5.72 | (107 ± 6) |
| Benzo (g, h, i) perylene | 75.5 | 0.001 | 3.3 | 73.0 | 0.018 | 4.3 | 90.2 | 0.012 | 17.4 | 79.54 | 9.31 | (80 ± 14) |
| Indeno(1,2,3-c,d)pyrene | 104.1 | 0.005 | 8.7 | 75.7 | 0.013 | 2.9 | 117.5 | 0.004 | 5.9 | 99.08 | 21.35 | (99 ± 25) |
RESULTS AND DISCUSSIONS
Table 3 shows the results of the residue analysis for organochlorine compounds. The sediments of 13 samples analyzed show residues of at least one of the monitored compounds. The presence of organochlorine residues in sediments were reported by several studies around the world, such as in the case of, (Q. Wang & Kelly, 2017), who report concentrations of up to 160 mg/kg of DDTs, likewise, (Dai et al., 2011) report concentrations up to 29.61 mg/kg in sediment samples from Lake Baiyangdian in northern China.
Table 3 Results of POPs monitoring in Lake Titicaca's Interior Bay.
| COMPOUNDS | COLLECTION POINT, RESULTS EXPRESSED IN (µg/g) | ||||||||||||
|---|---|---|---|---|---|---|---|---|---|---|---|---|---|
| 1 | 2 | 3 | 4 | 5 | 6 | 7 | 8 | 9 | 10 | 11 | 12 | 13 | |
| β-BHC | 0.0180 | 0.0026 | --- | 0.0030 | 0.0075 | 0.0120 | 0.0120 | --- | --- | --- | 0.0005 | --- | 0.0120 |
| Dicofol (sum) | 0.0065 | --- | --- | --- | --- | --- | --- | --- | --- | --- | --- | --- | --- |
| o,p´-DDE | 0.0011 | 0.0011 | 0.0011 | --- | 0.0011 | --- | --- | --- | --- | --- | --- | --- | --- |
| p,p´-DDE | --- | --- | 0.0007 | --- | --- | --- | --- | --- | --- | --- | --- | --- | --- |
| Endosulfan sulfate | 0.0017 | 0.0020 | 0.0040 | 0.0004 | 0.0040 | 0.0040 | 0.0021 | 0.0061 | 0.0040 | 0.0040 | 0.0031 | 0.0050 | 0.0030 |
| Mirex | 0.0044 | --- | --- | --- | --- | --- | --- | --- | --- | --- | --- | --- | --- |
The presence of organochlorine compounds in sediment samples of Lake Titicaca, which is a source of food and fresh water for a large part of the population of Puno city and the population at its shores, could pose a great risk to the health of people who make use of this lake, because several studies, among them, (Nakata et al., 2005) show the presence of these compounds in human adipose tissue at concentrations of 4.2 to 19 μg/g for DDTs and from 0.0017 to 0.097 μg/g for p,p'-DDE/DDTs.
All sediment samples analysis show the contamination by endosulfan sulfate in concentrations from 0.0004 to 0.006 μg/g, a stable metabolite of endosulfan (Snedeker & Hay, 2012; Bhalerao, 2013), nevertheless, its use was prohibited in Peru since 2012 by the national agricultural health service SENASA. Studies show that the half-life of endosulfan sulfate is approximately 120 days, (Bhalerao, 2013), so the presence of this compound in the samples analyzed shows the constant use of this molecule in agricultural areas near the Inner Bay of Lake Titicaca.
On the other hand, the presence of DDT metabolites has been evidenced, the sampling points 1, 2, 3 and 5 show concentrations of 0.00011 μg/g of o,p´-DDE and 0.0007 μg/g of p,p´-DDE in the point 3. High concentrations of DDT around port regions and bays have been reported by (Nakata et al., 2005) and (Zhang et. al., 2015; Sui et al., 2015). Spatial distribution of DDT indicates that pollution is closely related to human activities, discharge of untreated effluents from industrial and municipal activities, urban runoff, outflow from agricultural areas and atmospheric deposition, (Aksu et al., 2011). Likewise, its presence could be linked to the use of antifouling paints, (Alam et al., 2014). This compound was widely used in Peru as an insecticide due to its low cost and broad spectrum on many agricultural crops. The ratios between the parent DDT compound and its metabolites provide useful information on the time lapse from the use of DDT to the time of analysis, (Arrebola et al., 2015). A ratio of (p,p'-DDE + p,p'-DDD) / o,p'-DDD) greater than 0.5 μg/g indicates the historical entry of DDT, while quantities less than 0.5 imply recent entry, in this study, the o,p´-/p,p´ -ratios of all isomers in the sediments revealed no clear trend, the results being in accordance with (Ricking & Schwarzbauer, 2012).
The (Jiao et al., 2013) study on PAHs presence indicates that research on the sources and distribution of PAHs in sediments is useful in monitoring water quality, and carrying out ecological assessments, so that sources can be eliminated or controlled. Table 4 shows the results obtained from the monitoring of polycyclic aromatic compounds in the Inner Bay of Lake Titicaca. When comparing the PAHs levels in sediments in the present study, with the PAHs levels in sediments of other world surface waters, it can be seen that the PAHs in sediments of the waters of Lake Titicaca are below the levels of waste reported. Moreover, the (Zeng et al., 2018) study reports the concentrations of up to 3140 ng/g in a subtropical lake in China, which may explain that the effluent from the drainage in Lake Titicaca and anthropogenic activities contribute to the increase in the amount of PAHs monitored.
Tabla 4 Results of PAHs monitoring in Lake Titicaca's Interior Bay.
| COMPOUNDS | COLLECTION POINT, RESULTS EXPRESSED IN (µg/g) | ||||||||||||
|---|---|---|---|---|---|---|---|---|---|---|---|---|---|
| 2 | 4 | 5 | 6 | 7 | 8 | 9 | 10 | 11 | 12 | 13 | |||
| Naphthalene | --- | 0.022 | --- | 0.023 | --- | 0.056 | --- | --- | --- | 0.058 | --- | ||
| Acenaphthene | --- | --- | --- | 0.012 | --- | --- | --- | --- | --- | --- | --- | ||
| Phenanthrene | --- | --- | --- | --- | --- | 0.03 | 0.019 | 0.02 | 0.015 | 0.021 | 0.022 | ||
| Anthracene | --- | --- | 0.002 | 0.003 | --- | 0.009 | 0.006 | 0.006 | --- | 0.006 | 0.006 | ||
| Fluoranthene | 0.058 | 0.075 | 0.136 | 0.278 | 0.147 | 0.372 | 0.154 | 0.168 | 0.12 | 0.295 | --- | ||
| Pyrene | --- | --- | --- | 0.029 | --- | 0.039 | 0.025 | 0.023 | 0.023 | 0.03 | 0.036 | ||
| Benzo (a) anthracene | --- | --- | --- | 0.165 | --- | 0.547 | 0.312 | 0.356 | 0.158 | 0.301 | 0.571 | ||
| Chrysene | --- | --- | --- | --- | --- | --- | --- | --- | --- | --- | 0.033 | ||
| Benzo (k) Fluoranthene | --- | --- | --- | --- | 0.004 | 0.024 | 0.015 | 0.018 | 0.005 | 0.01 | 0.022 | ||
| Benzo (a) pyrene | --- | --- | 0.004 | --- | 0.002 | 0.017 | 0.01 | 0.01 | 0.004 | 0.006 | 0.012 | ||
| Dibenzo (a,h) anthracene | --- | --- | 0.003 | --- | 0.002 | 0.024 | 0.013 | 0.013 | 0.004 | 0.008 | 0.015 | ||
| Benzo (g,h,i) perilene | --- | --- | --- | 0.019 | 0.019 | --- | --- | 0.012 | --- | --- | 0.017 | ||
| Indeno(1,2,3-c,d) pyrene | --- | 0.029 | --- | 0.037 | --- | --- | --- | --- | --- | 0.022 | 0.036 | ||
| Total PAHs (µg/g) | 0.058 | 0.104 | 0.143 | 0.528 | 0.174 | 1.023 | 0.529 | 0.6 | 0.314 | 0.672 | 0.742 | ||
Thirteen of the 16 PAHs analyzed were detected at 11 monitoring stations. Station 8 has the highest concentrations of PAHs, reaching a concentration of 1.023 μg/g. On the other hand, it is observed that flouranthene is the compound that is more present in the analyzed samples, reaching a concentration of 0.372 μg/g. The presence of these compounds could be basically due to the fact that this sampling station is very close to the bus terminal of the city of Puno and stations, where there is a high presence of bus traffic, (Almeida et al., 2018). Another considerable source of its presence at all sampling points could be diesel spill accidents at the time of refueling the ships that provide tourist transportation services at this location, (Snedeker & Hay, 2012).
It is known that 53 % of the waters of this lake comes from rivers and streams. (Roche, Bourges, & Mattos, 1992), and these rivers sometimes cross other cities, where there are high rates of diesel engine combustion, traffic emission, which due to surface runoff, cause residues of PAHs to be dragged into the waters of these rivers, so these rivers would be responsible for transporting these pollutants in to the lake, (Snedeker & Hay, 2012) and these compounds in turn, due to their hydrophobicity, are stored in these sediments, (Ramesh et al., 2004). Also, the burning of pastures is a common practice in the highlands of this basin, an activity that is maintained for the purpose of renewing pastures, before the beginning of the rainy season. The Almeida et al., 2018 study shows that the burning activities are an important source of PAHs. The ashes of these burns are dragged by the winds until reaching the rivers that reach the lake as well as being dragged by the first rains that begin in the month of September in this region.
The microorganisms present in sediments are the main degraders of organic pollutants (Polder et al, 2016), but at the same time, these sediments have been receiving important loads of antibiotic residues, compounds that would be affecting the bacterial population in charge of the degradation of other types of organic pollutants (Bhalerao, 2013); causing slow degradation of the organic pollutants to be present in the sediments, impacting the ecosystem that inhabits it; on the other hand, this constant presence of anbiotic residues is facilitating the development of antibiotic resistance genes (ARG) (Mah & Toole, 2001; Cerqueira, Matamoros, Bayona, & Piña, 2019), a greater effect has been evidenced when there is a joint presence of heavy metals, nutrients and organic pollutants that makes the variation and distribution of ARG crucial (Chen et al., 2019), these conditions would be influencing the amount of POPs residues analyzed in sediment samples (Fernandes et al., 2020).
CONCLUSIONS
This study evidences contamination in sediments by POPs due to their use in agricultural activities near the lake area; having detected the maximum concentrations in the following compounds: β-BHC, 0.018 μg/g; o,p´-DDE, 0.0011 μg/g; dicofol 0.0065 μg/g and endosulfan sulfate 0.0061 μg/g.
The presence of PAHs could be mainly due to accidental spills of fuel by the boats that provide transportation services within the Inner Bay of the lake. The maximum concentrations for the following PAHs were: naphthalene, 0.058 μg/g; pyrene, 0.039 μg/g; benzo(a)anthracene, 0.571 μg/g and chrysene, 0.033 μg/g.
The presence of POPs and PAHs in sediment samples from the Inner Bay of Lake Titicaca represent a toxicological risk for the species that inhabit this ecosystem, as well as the human population that makes use of the resources coming from this lake.

