


 Inglês (pdf)
 Artigo em XML
 Referências do artigo
 Enviar este artigo por email
 Citado por SciELO
  Similares em
SciELO
Similares em
SciELO  uBio
uBio 
 Permalink
Introduction
Mayonnaise is characterized as an emulsion of oil droplets dispersed in water, known as an oil-in-water (O/W) emulsion, being emulsified by an emulsifying agent such as egg proteins. The properties of this colloid, as well as its thermodynamic stability, are directly dependent on the constituents of the system (Di Mattia et al., 2015).
Mayonnaise is usually produced in a batch process, in which the oil is slowly added to the aqueous phase under vigorous stirring. The system receives energy and the oil is dispersed in the water, the high content of this dispersed agent gives a thick texture to the emulsion, with the oil droplets having approximately 5 μm in diameter.
Despite its property as a surface-active agent, the egg contains a high amount of cholesterol, if ingested in excess it can cause health problems. Its replacement becomes interesting for the manufacture of mayonnaise in the food industry. Eggs can be replaced by protein aggregates, and such substances are found in whey, and present similar results in relation to the emulsifying effect (Chang et al., 2017). Whey, a by-product from dairy industry, is considered a high nutritional value by-product and can be used as emulsifier.
The use of powdered milk as an ingredient in food products has functional benefits, such as the emulsifier function, bringing advantages such as preventing the fatty globules from forming lumps, improving the appearance of the product, thus, it is possible to apply this raw material from making bread to making sauces (Sharma, Jana, Chavan, 2012).
The aim was to prepare mayonnaises with natural preservatives and higher protein content than the market mayonnaises and verify their structural and nutritional properties.
Materials and methods
Formulations of mayonnaise F1, F2 and F3 Mayonnaise production
The production of mayonnaise was based only on the use of dry ingredients, oil and water. The dry ingredients used in the basic formulation were skimmed milk powder, powdered whey, powdered garlic and mustard, which were stored in a refrigerator at 10 ˚C, while liquid ingredients such as soybean oil and distilled water were stored at room temperature (25 ˚C). The preparation of mayonnaise followed the flowchart in Figure 1, using a Fisatom model 713D (Brazil) mechanical stirrer with power from 70 to 130 W, 115 V/ and 50/60 Hz, with its rotation adjusted between 90 and 5000 rpm. The composition of the formulations can be found in Table 1.
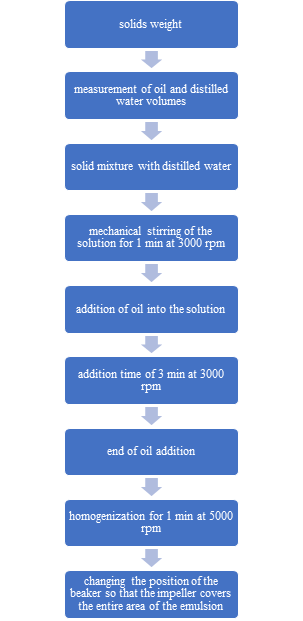
Table 1 Emulsion formulation (mayonnaise) with powdered garlic and mustard as a preserving agent
| Product | Oil (%) | Whey (m/v water) (%) | Powdered milk (m/v water) (%) | Water (%) | Powdered garlic (%) | Powdered mustard (%) | Xanthan gun (%) |
|---|---|---|---|---|---|---|---|
| F0 | 71.0 | 21.9 | 7.0 | 0.1 | |||
| F1 | 71.0 | 20.9 | - | 7.0 | 0.50 | 0.50 | 0.1 |
| F2 | 71.0 | - | 20.9 | 7.0 | 0.50 | 0.50 | 0.1 |
| F3 | 71.0 | 9.5 | 11.4 | 7.0 | 0.50 | 0.50 | 0.1 |
F0 (Control) (whey + without antioxidants); F1 (whey + antioxidants), F2 (powdered milk + antioxidants), F3 (whey + powdered milk + antioxidants).
Methodology
Nutritional value of mayonnaise
The calculation of the nutritional facts label of the samples, with the purpose of showing the amount of proteins and lipids, was based on the Brazilian Table of Food Composition (Tabela Brasileira de Composição de Alimentos, 2011), using a default value of 200 g for each formulation in order to establish, mainly, the concentrations of carbohydrates, proteins, fats and minerals. It is noteworthy that for the powdered whey, the nutritional label provided by the producer was used. The label model was constructed followed RDC Nº 360 (Brasil, 2003) (Table 2).
Emulsion Stability Index
The emulsion stability index (ESI) was evaluated based on the methods reported by Mirhosseini, et al. (2008) and Kupongsak, Sathitvorapojjana (2008) using 20 mL of mayonnaise for each formulation that was placed in a graduated cylinder. The emulsion was stored at 20 ± 2°C for 4 weeks, being analyzed weekly for index. The results of the emulsion stability index were obtained from Equation 1, with measures of initial mayonnaise height (HE), cream layer mayonnaise height (HC) and droplet-depleted serum phase mayonnaise height (HS) being calculated).
pH
The pH analysis of the product was determined by a pH meter of Bench for Aqueous Solutions Mpa-210, model R-TEC-7-MP, (Tecnal®, Brazil)., through calibration using buffer solutions and the dilution of 1 g of the product in 10 mL of distilled water. One sample per formulation was analyzed.
Water Activity (Aw)
The determination of the water activity of the samples was carried out by analyzing 3 samples per formulation at a controlled temperature of 25˚C, being carried out in Novasina LabMaster model equipment (Novasina, Switzerland). The formulated products were stored for a period of 30 days under refrigeration at 10˚C ± 2°C.
Color determination
The color analysis of the products was determined using a Colorquest XE equipment, 0/45° geometry, and the data analyzed using the LEQ7 software (Hunter Lab, Brazil). Three samples were analyzed per formulation for 30 days, stored at 10˚C ± 2°C, with an initial reading being taken (time 0), followed by another analysis after 15 days (time 1) and the last being performed at the end of 30 days (time 2). It is noteworthy that the samples were stored in closed containers, but not hermetically. The variables L*, a*, b* indicating luminosity, red/green and yellow/blue, respectively. The total difference in color (∆E*) a was calculated using Equation (2).
DPPH radical scavenging capacity
The anti-radical capacity was determined by the DPPH (2,2-diphenyl-1-picrylhydrazyl) radical-scavenging method according to the method of Brand-Williams et al. (1995) and Blois (1958). Standard curve of Trolox was determined as: 500 mL sample, Trolox 0,5 mg/mL + 1500 mL DPPH, and after 20 minutes the absorbance was measured at 517 nm using a Spectrophotometer (GENESYS 20, Thermo Spectronic, Thermo Scientific, USA). The control consisted of a methanolic solution of Trolox (6-hydroxy-2,5,7,8-tetramethylchroman-2-carboxylic acid) at different concentrations. Trolox standard curve was made, taking an aliquot for each concentration µg/mL. The 30 and 25 µg/ml Trolox concentration readings were taken from the standard curve to improve linearity. For each sample an extraction with methanol was performed as described above and in addition it was necessary to dilute each extract 10 times. Three aliquots were used for the reaction with DPPH. Results were expressed in µg of Trolox Equivalent per 100 g of sample and in % Inhibition.
Texture
For texture analysis, the A/BE back extrusion probe test was used in a TA-XT2 texture analyzer (Stable Micro Systems, United Kingdom), and the samples were conditioned at 10˚C ± 2°C, in times: 0 (zero), 15 days and 30 days. The analysis parameters: Measure Force in Compression, Pre-Test Speed 1mm/s, Test Speed 1mm/s, Post Test Speed 1 mm/s, Distance 25 mm/s, force 10 g, Data Acquisition Rate 200 pps. Probe back extrusion dimensions: cup inner diameter, 55 mm; cup height, 70 mm and compression plate diameter, 45 mm.
Rheology
Mayonnaise formulations (F1, F2, F3) were analyzed by oscillatory and rotational (combined method) test with a rheometer model Haake Mars II with Rheoscope module (Thermo Scientific, Germany) under controlled temperature of 15°C and cone-plate sensor Ø 35 mm / 2°. The results are presented by Haake Rheowin 6.0 software (Thermo Scientific, Germany) in a computer coupled to the equipment. The parameters used in the rheology tests were: oscillatory (CS): frequency 1 Hz, stress 1 Pa, time 180 s; Rotational (CR): shear rate 0-200 1/s, time 120 s; Rotational (CR): shear rate 200-0 1/s, time 120 s; Oscillatory (CS): stress 1 Pa, frequency 1 Hz, time 180 s.
DSC - Diferencial Scanning Calorimetry
The analyzes of the three formulations (F1, F2 and F3) were conducted in equipment for Differential Calorimetric Analysis (DSC - Differential Scanning Colorimeter), DSC 7020 (HITACHI, Tokyo, Japan), in a nitrogen atmosphere. A sample weighing between 6 to 10 mg was introduced into the calorimeter. The sample was equilibrated at 5°C for 5 min in the DSC cell. After reaching equilibrium the sample was heated at a rate of 2.5°C/min.
Statistical analysis
All analyses were carried out in triplicate and the results were expressed as mean ± standard deviation (SD). The statistical analysis was made using the Statistic software package version 5.0 (StatSoft, Inc., Tulsa, OK). The differences between the means were first analyzed by the ANOVA test and then Least Significant Difference (LSD) test (p < 0.05).
Results and discussion
Calculated Nutritional Information
The results of the samples nutritional composition calculation showed the values obtained for each formulation of the amounts of proteins and lipids. The nutritional information contained on the label to provide consumers with guidance on the constituents of foods, helping to make healthy food choices (Cavada et al., 2020; Food and Drug Administration, 2019).
Nutritional labeling is described to inform the consumer about the nutritional properties of a food, evidencing the energy value and the main nutrients, and such information must be evident and understood by the consumer (Souza et al., 2011).
According to the results showed in Table 2, it was evident that the energy values are approximate for the three formulations (F1, F2 and F3) (1172 kcal/200 g to 1234 kcal/200 g). This fact can be explained by the amount of vegetable oil used in the preparation of the emulsions.
Another point to be observed is the protein content. Milk protein has several functionalities in the human body. Antiviral action, as example antiviral activity of bovine lactoferrin (cow milk) against Zika virus (Flavivirus genus) and Chikungunya virus. Milk as said to cause some positive effects in Parkinson disease and improved sleep and weight loss (Wikipedia, 2023).
Proteins can be found in greater quantity in the F2 formulation (2.8 g/200 g - 1.4 %), F3 formulation (2.5 g/200 g - 1.25 %) and F1 formulation (2.0 g/200 g - 1.0 %), values higher than the market mayonnaises (less than 1.0 % protein content). Could be inferred that the amino acids and short-chain peptides did not enter the protein count. In addition, it is worth emphasizing two more nutritional elements whose results are different between the formulations. Carbohydrates, represented by milk sugar, are more present in the F2 formulation, since the emulsifying agent is basically skimmed milk powder, when compared to the F1 formulation based on powdered whey, with a value of approximately four times smaller. Sodium is approximately four times more present in the F1 formulation (8.9 mg/200 g) when compared to F2 (2.2 mg/200 g), pointing out the characteristic of powdered whey to be rich in mineral salts and compared to milk, it has different amounts and types of proteins (Table 2).
Table 2 Nutrition Facts of the F1, F2 and F3 formulations
| Nutrition Facts of the F1 formulation (whey powder) Serving size: 200 g | ||
|---|---|---|
| Amount per serving | %Daily Value | |
| Calories | 1172 kcal = 4899 kJ | 59 |
| Carbohydrate | 11.0 g | 4 |
| Proteins | 2.0 g | 2,5 |
| Total Fats | 132.0 g | 240 |
| Dietary Fiber | 0 g | 0 |
| Sodium | 97 mg | 4 |
| Nutrition Facts of the F2 formulation (powdered skimmed milk) Serving size: 200 g | ||
| Calories | 1234 kcal = 5159 kJ | 62 |
| Carbohydrate | 4.3 g | 1 |
| Proteins | 2.8 g | 4 |
| Total Fats | 136 g | 248 |
| Dietary Fiber | 0.2 g | 1 |
| Sodium | 2.0 mg | 0 |
| Nutrition Facts of the F3 formulation (whey powder + skimmed milk powder) Serving size: 200 g | ||
| Amount per serving | %Daily Value | |
| Calories | 1234 kcal = 5159 kJ | 2.5 |
| Carbohydrate | 7.0 g | 3 |
| Proteins | 2.5 g | 4 |
| Total Fats | 136,0 g | 248 |
| Dietary Fiber | 0.1 | 1 |
| Sodium | 40 mg | 2 |
Emulsion Stability Index
The emulsion stability index (ESI) measures the resistance of the emulsion over a specific time, after the period of four weeks of storage at a constant temperature of 20˚C ± 2° C.
In the first 15 days of storage, the ESI of the three formulations was 100%, showing the stability of the emulsion at 20˚C ± 2°C. After 30 days of storage, the formulation F2 (87.5%) (powdered skim milk) was the least stable and the F1 (97.5%) (powdered whey) the most stable, the F3 (92.5%) (powdered whey milk + powdered skim milk) with intermediate value, indicating that the presence of whey in the formulation increases the stability of the emulsion.
The formulation without whey (F2) was more stable. The consumption limit for mayonnaise after opening the package is up to 3 months under refrigeration, to maintain its properties. It is necessary to consider the type of processing used to prepare the emulsions, which does not provide a product with high stability.
pH, color, Aw determinations
The determination of pH is important to relate the microbiological stability of the product with the physicochemical factor. Most microorganisms grow at a pH value in the product around 7.0, more specifically between 6.6 and 7.5, so for pH values lower than 4.0 there will be less probability development of microorganisms such as bacteria and fungi.
Acetic acid (vinegar) is the most common acid used in the preservation of mayonnaise, as well as lactic acid, helping to prevent deterioration, maintaining a low pH (between 3.3 and 3.8) (Jay, 2000; Ignácio, Lannes, 2013).
Garlic has important characteristics for preserving food and fighting diseases, having properties that inhibit the growth of pathogenic bacteria (Filocamo et al., 2012). The use of garlic in food formulations favors the fight against the proliferation of microorganisms, due to its antimicrobial properties, in addition to preventing lipid oxidation and not causing sensory losses to the product (Horita et al., 2016). Mustard, which has characteristics like garlic in terms of microbial control, can be used in food formulations in the form of powder or flour which, when hydrated, can produce organic compounds, such as flavonoids, releasing molecules that are capable of curb microbial growth by inhibiting enzymes and proteins released by microorganisms (Lee, Oh, Min, 2015).
The pH results obtained were: F1 (6.60 ±0.01), F2 (6.89 ±0.01), F3 (6.75 ±0.01), pointing out small differences between the samples, low acidity values, normally contributing to microbial growth. Proteins and phospholipids possess charges or have the capability to be ionized. Then, pH values can modify their surface-active behavior and hydrodynamic interactions between oil droplets in emulsions.
The measurement of color in foods serves as a point of quality analysis, since natural foods tend to change their color and appearance over time, on the other hand processed foods are formulated to maintain their physical chemical characteristics, in addition to color during the product's shelf life. The colorimetric analysis of a food is intended to understand the behavior of particles, droplet dispersion and oxidation reactions.
The results obtained in the color coordinate system (Table 3) evidences the variations that occurred in L*, a* and b*. The impact of light diffusion over time, confirming a decrease in this diffusion in the formulation containing only whey proteins (F1), along shelf life of 30 days, suggesting that in this formulation there may have been rancidity of the oil present in the formulation, as well as change in relation to the size of the dispersed droplets. The variation in the a* value is since the F1 formulation only contains whey proteins, in addition, it is possible to visualize a small variation in the F3 formulation, which also contains whey proteins. Emulsifying agents play a key role in the stability of the emulsion and maintenance of the size of the dispersed oil droplet, indicating that whey, when present alone in the sample (F1) as an emulsifying agent, presents a lower-than-expected result in terms of structure maintenance of the emulsion when compared with the other formulations.
Table 3 Color results of the mayonnaise formulations F1, F2 and F3 during 30 days of storage
| Formulation | Time 0 | Time 1 (15 days) | Time 2 (30 days) | ||||||
|---|---|---|---|---|---|---|---|---|---|
| L* | a* | b* | L* | a* | b* | L* | a* | b* | |
| F1 | 79.83 ±0.04a | -7.16 ±0.02a | 37.16 ±0.13a | 74.66 ±0.06a | -6.29 ±0.02a | 41.17 ±0.04a | 70.40 ±0.02a | -6.18 ±0.03a | 43.32 ±0.03a |
| F2 | 82.19 ±0.16b | -7.52 ±0.01b | 30.24 ±0.03b | 81.37 ±0.24b | -7.48 ±0.09b | 31.41 ±0.28b | 81.16 ±0.02b | -7.37 ±0.05b | 32.68 ±0.03b |
| F3 | 81.87 ±0.22c | -7.60 ±0.06c | 31.19 ±0.13c | 81.27 ±0.19c | -7.32 ±0.04c | 32.16 ±0.15c | 81.04 ±0.03c | -7.11 ±0.02c | 32.53 ±0.02c |
* n=3 F1 (whey powder); F2 (powdered skimmed milk); F3 (whey powder + skimmed milk powder). Different letters in the same column indicate a significant difference (p<0.05) in Tukey's Test. Results are expressed in mean of triplicate ± SD.
Delta E (the total color difference) is based on delta L*, delta a*, and delta b* color values, all of which provide a complete numerical descriptor of the color in a rectangular coordinate system. Regarding the results, the closer to the value 0, that is, the smaller the difference, the closer to the selected standard. It is possible to observe with the result of the color difference (∆E*) that the formulation containing only the whey proteins (F1) presents greater variation results, evidencing a change in the emulsion structure (Table 4).
Table 4 Color difference (∆E*) using L*, a*, b* space during 30 days of storage of the mayonnaise formulations F1, F2 and F3
| Formulations | (∆E*) |
|---|---|
| F1 | 11.31 ±0.04a |
| F2 | 2.65 ±0.14b |
| F3 | 1.65 ±0.22c |
F1 (whey powder); F2 (powdered skimmed milk); F3 (whey powder + skimmed milk powder). Different letters in the same column indicate a significant difference (p<0.05) in Tukey's Test. Results are expressed in mean of triplicate ± SD.
There were no great variations in the Aw of the three formulations over the period of analysis (Table 5). It was also not observed growth of bacteria, molds and yeasts despite the range of results obtained for water activity being conducive to microbial development. The composition of the emulsion is a good source of nutrients for the development of microorganism, the mayonnaise has salts and sugars dissolved in the aqueous phase limiting the number of microorganisms that can develop.
Table 5 Water activity of the mayonnaise formulations F1, F2 and F3 during 30 days of storage
| Formulation | Time 0 | Time 1 (15 days) | Time 2 (30 days) |
|---|---|---|---|
| F1 | 0.937±0.001a | 0.936±0.001a | 0.934±0.001a |
| F2 | 0.941±0.001a | 0.941±0.001a | 0.939±0.001a |
| F3 | 0.940±0.001a | 0.940±0.001a | 0.938±0.001a |
*Storage days. F1 (whey powder); F2 (powdered skimmed milk); F3 (whey powder + skimmed milk powder). Different letters in the same column indicate a significant difference (p<0.05) in Tukey's Test.Results are expressed in mean of triplicate ± SD.
DPPH radical scavenging capacity
The results obtained from the antioxidant capacity must be compared when the measurements were made by the same procedure, such as using the same type of solvent.
In alcoholic environments, it is easier to donate a hydrogen atom from the alcohol itself (ethanol or methanol), which increases the solubility and the constant rate of hydrogen transfer to the DPPH• radical, especially to the nitrogen atom that is connected to the two aromatic rings. Thus, the electronic charge that was previously moving over the DPPH• radical, is more restricted to the nitrogen atom (N•a) located in the middle of the DPPH• radical, increasing the reactivity of the radical with an antioxidant substance (Souza et al., 2019).
Table 6 DPPH radical scavenging capacity of mayonnaise samples
| Sample | Trolox Concentration Equivalent (mg/100 g sample) | % Inibition |
|---|---|---|
| F0 | 133.42 ± 7.03a | 63.82 ± 3.30 |
| F1 | 151.11 ± 1.89a | 74.13 ± 0.91 |
| F2 | 163.78 ± 0.38a | 77.44 ± 0.18 |
| F3 | 167.69 ± 1.13a | 81.41 ± 0.54 |
F0 (whey + without antioxidants); F1 (whey + 1.0 % antioxidants), F2 (powder milk + 1.0 % antioxidants), F3 (whey + powder milk + 1.0 % antioxidants).
Different letters in the same column indicate a significant difference (p<0.05) in Tukey's Test. Results are expressed in mean of triplicate ± SD.
Different letters in the same column indicate a significant difference (p<0.05) in Tukey's Test. Results are expressed in mean of triplicate ± SD.
According to the findings (Table 6), the antioxidant activity increased with the addition of the natural antioxidant added, and it was observed that the addition of whey protein also caused an increased value. Sample F3 presented higher inhibition percentage and Trolox concentration equivalent.
Hydroxytyrosol and hydroxyl acetyl derivate, from Olive Leaf phenolic commercial extract, improved the antioxidant activity of the mayonnaise samples as confirmed by their correlation with DPPH test (Romeo et al., 2021).
Chritmum maritimum, sea fennel, was demonstrated to be a potential alternative preservative ingredient for salad sauces foods (Pedreiro et al., 2023).
Whey can be used by the food and pharmaceutical industries, since whey proteins are a source of bioactive peptides that have beneficial effects on human physiology, such as antioxidant and antimicrobial function. Bioactive peptides are specific protein fragments and their beneficial health effects are attributed to the presence and/or sequence of amino acids in the protein structure. The antioxidant capacity of peptides is related to the mechanism of action of some amino acids present. Amino acids that donate electrons and/or protons or that contain sulfhydryl groups can act as free radical scavengers (Souza et al., 2019).
Texture analysis
Texture is the set of physical properties that define the structure of the elements of a food, which are related to deformation, disintegration and that can be measured as a function of mass, time, and distance.
The rheological data of an emulsified mayonnaise-type product are directly related to the components present in the formulation of this product, as well as the temperature and storage time items that influence the degree of stability of an emulsion (Ignácio, Lannes, 2013).
It is possible to notice variations as indicated by the red arrows. Such variations can be understood as the presence of air in the sample during the application of the tension force.
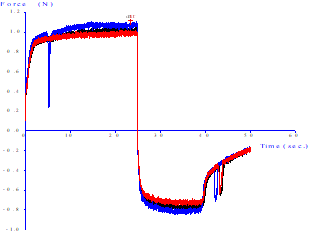
Figure 2 Force versus time curve analysis in tests obtained with the probe back extrusion for mayonnaise-type emulsion samples (F1) at 10˚C ± 2°C
The positive values in the graph (Figure 2) are consistent with the firmness of the emulsion, the higher the firmer values will be the samples, while the negative values of strength can be taken as an indication of the viscosity of the samples, that is, the more negative the value, the more cohesive the sample. It is proposed that the strength results are related to the way the emulsifying agent acts in the emulsion.
According to Ignácio (2005), there are different texture curves, relating tension strength over time, according to the different types of commercial mayonnaise, since the differences observed in the curve patterns are related to the factors such as the amount of present fat in the formulation and the type of emulsifying protein used in the product. Mayonnaise commercially characterized as light had tension values of 2 N in both the positive (firmness) and negative (stickiness) of the texture graph, while mayonnaise classified as traditional reached approximate values 10 N for firmness and 6 N for stickiness. This means that mayonnaise that have a lower hardness may contain starch in their formulation, which interferes with the behavior of the emulsion.
Table 7 Mean force ± standard deviation of extrusion force in texture tests.
| Formulation | Time 0* | Time 1 (15 days) | Time 2 (30 days)* |
|---|---|---|---|
| Force (N) | |||
| F1 | 1.035 ±0.026a | 0.633 ±0.035b | 0.566 ±0.024c |
| F2 | 4.255 ±0.160a | 3.928 ±0.048b | 3.218 ±0.060c |
| F3 | 3.198 ±0.086a | 2.582 ±0.017b | 1.700 ±0.044c |
*Storage days. F1 (whey powder); F2 (powdered skimmed milk); F3 (whey powder + skimmed milk powder). Different letters in the same line indicate a significant difference (p<0.05) in Tukey's Test. Results are expressed in mean of triplicate ± SD.
In Table 7, it is possible to visualize the decrease in texture strength over the storage time, especially in the F1 formulation sample.
Thus, it is possible to observe the fact that the powdered whey proteins present in the F1 formulation cannot transmit to the emulsification formulation like the market mayonnaise, and even to the formulations made with powdered whey and mixing of powdered whey with skim milk powder. Furthermore, the texture strength decays more rapidly over storage time in formulations containing powdered whey as an emulsifying agent.
Ignácio (2005) obtained texture results for light mayonnaise like the F2 and F3 formulations verified in the present work. In Table 3, it is possible to observe the decrease in the firmness force.
The result of the texture reinforces the hypothesis that the texture of an emulsified product is related to the type of emulsifying agent used in the formulation, making it possible to suppose that proteins with short chains and secondary structures are less effective information and maintenance over time of an emulsion, as per the F1 formulation results.
It is possible to verify that proteins with amphipathic characteristics, as in the case of casein, are characterized by the presence of a phosphate group and a protein chain, present better comparative results for the formation and maintenance of the emulsion, as evidenced by the results of the F2 formulation.
The F3 formulation presents texture results like those of commercial mayonnaises classified as light, and it is possible to consider that a formulation containing a mixture of powdered whey and skimmed milk powder as emulsifying agents, in addition to ensuring a texture result already known by the consumer market, it can provide a product containing essential amino acids for human development as well as mineral salts from powdered whey that are important in food.
Rheology
The study of rheology can be carried out through rotational tests where a force or shear stress is applied to the sample, which can characterize it in relation to its viscosity as well as its flow behavior (Rao, 1999).
On the other hand, oscillatory tests have the advantage of not destroying the sample, simulating a steady state. With this feature, it is possible to verify the behavior and evaluate the stability of the product in relation to its ingredients, making a study of the shelf life of the formulations (Rao, 1999; Steffe, 1996; Cho et al., 2005; Lannes, 2017).
Tests can be conducted through variations in amplitude with constant deformation and frequency, varying the stress; frequency scan under constant stress and with information on the region of viscoelastic behavior performed as a function of time. They can be conducted at a frequency of 1 Hz to determine the viscoelastic region, in addition to obtaining the limit stress value (yield stress), and this parameter is important to verify the maximum stress applied to the sample before its restructuring (Rao, 1999; Steffe, 1996).
Three stages can be performed a rheological test, being the first and third oscillatory, and second rotational. This routine analysis allows for more accurate verification of sample destruction and recovery. The existence or not of thixotropy is verified, which is observed by the unevenness of the initial and final plateaus, here it is represented in Figures 3 to 7.
The use of oscillatory testing has the advantage of characterizing the product's thixotropy, as it can graphically observe the product's recovery in relation to its initial state, in addition to observing the time required for this action to occur, comparing the final viscosity with the initial viscosity (Mujmdar, Beris, Metzner, 2002). As in rotational tests, oscillatory tests are not possible to absolutely analyze the thixotropy, however it is possible to measure how much the analyzed product presents this property as a function of the conditions applied in the rheological tests (Mao, Chen, 2006).
Figures 3 to 7 show the product recovery values in relation to its elastic or storage modulus (G’). These values correspond to how much the product absorbs transmitted energy. On the other hand, the viscous or dissipation module (G”) relates how much the product releases from this energy provided by the oscillation applied to the product. This phenomenon is based on the kinetic processes that change the structure of thixotropic materials.
Product recovery is related to how much it manages to return to its initial viscosity and elasticity characteristics and how much it recovers from its structure prior to the application of force (Mujamdar, Beris, Metzner, 2002).
The viscosity of the sample depends on the shape, size and orientation of hydrocolloids, such as the xanthan gum used to emulsify the sample. It is possible graphically observe that the samples presented an elastic value, as the initial viscosity is different from the final value, evidencing a typical behavior for samples with a large protein content. The rheological characteristics of samples F1 (powdered whey), F2 (skimmed milk powder) and F3 (powdered whey + skimmed milk powder) were compared with two commercial mayonnaises (light and traditional) (Figures 3 to 7).
It is possible to note that the rheometric analysis of formulations F2 and F3 presented similar results, but these results are different from those presented in the viscosity of commercial mayonnaise (light and traditional). Thus, the milk protein, even with the help of a hydrocolloid (xanthan gum) to structure the emulsion, does not present similar results to the results obtained in commercial mayonnaise.
Commercial mayonnaise showed better structural recovery, thixotropy, than formulated samples, as the initial and final plateaus are at closer values. Formulation F1 (powdered whey) showed the worst recovery among the formulated samples and cannot be characterized as a mayonnaise-like emulsion structure in relation to comparative rheological results.
Flamminii et al. (2020) found to full-fat mayonnaise, the encapsulated olive leaf phenolic extract affected the viscosity and lubricant properties.
Proteins from skim milk powder and powdered whey may not have the same rheological characteristics for mayonnaise-like emulsion formation when compared to the use of egg protein as an emulsifying agent, especially whey proteins, which have powdered whey proteins less capacity to form an emulsion. However, we must consider the type of processing used to prepare the products.
Thermal analysis - DSC
Oil-in-water (O/W) emulsions are thermodynamically unstable systems. Since many emulsions of this type, such as mayonnaise, are frozen to improve the shelf life of the product (Degner et al., 2014). In DSC analysis, the differences in heat flux in substance and reference are measured as a function of sample temperature.
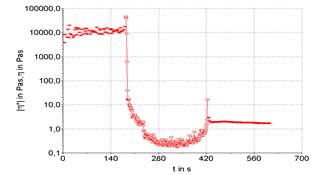
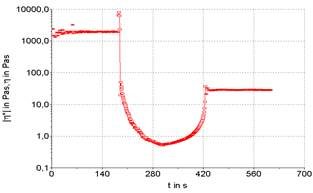
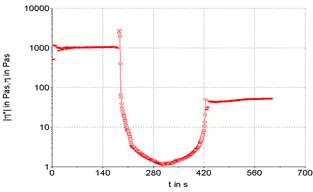
The results obtained from formulations F1, F2, and F3 are illustrated in Figures 8, 9 and 10 respectively.
Figure 8 Thermal analysis curve by DSC (Differential scanning calorimeter) for the F1 (powdered whey) formulation
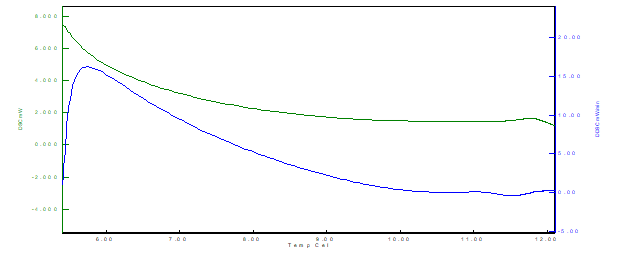
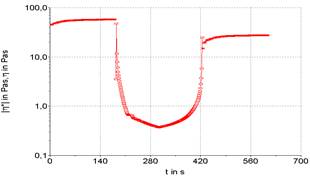
Figure 9 Thermal analysis curve by DSC (Differential scanning calorimeter) for formulation F2 (skimmed milk powder)
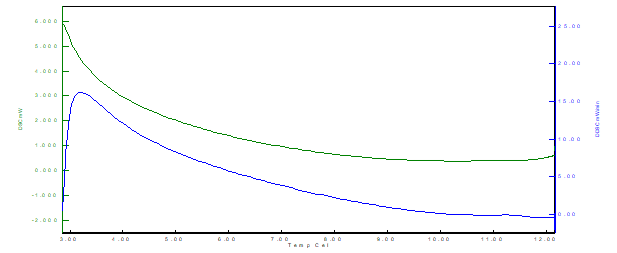
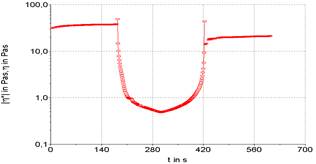
Figure 10 Thermal analysis curve by DSC (Differential scanning calorimeter) for formulation F3 (powdered whey + skim milk powder)
From the results, it is possible to observe that for the three samples there is the presence of an exothermic peak. The exothermic events (latent heat release) occurred at different temperatures for each formulation, being F1 (between 6˚C and 7˚C), F2 (between 5˚C and 7˚C) and F3 (between 3˚C and 4 ˚C), indicating faster crystallization of the F3 sample structure (lipid-protein binding), also observed by the decay and lower values of the curve for the F3 formulation. The cooling rate used in the crystallization of the material directly affects the shape, height, and energy of the exothermic peak in the DSC.
Exothermic events can be crystallization, polymerization reactions, curing, oxidation, oxidative degradation, adsorption, among others. Second-order transitions are characterized by variation in heat capacity, but without variations in enthalpy. Thus, these transitions do not generate peaks in the DSC curves, appearing as an S-shaped shift from the baseline. Typical examples are the glass transition and thermal stress relaxations of the polymer chain.
When the mayonnaise-type emulsion is stored at negative temperatures, such as -20˚C, the crystallization of water and fat can significantly influence the stability of the ice and thawing of the emulsion (Degner et al., 2014; Gosh, Coupland, 2008).
According to Ishibashi, Hondoh and Ueno (2016), the enthalpy of fusion increases with storage time, indicating a polymorphic transformation of the oil crystals. Furthermore, it is confirmed an increase in the melting point of the oil crystals during the storage and a polymorphic transformation of the oil crystals. In this way, the melting point is changed to higher temperatures with longer storage time and with a polymorphic transformation in the emulsion, the emulsion becomes significantly destabilized.
Conclusion
From the data obtained, it was possible to verify that both the powdered whey and the skimmed milk powder presented characteristics of an emulsifying agent, with differences in the emulsifying capacity.
The tests performed demonstrated that the texture and rheological results obtained in the F1 formulation (powdered whey) did not reach the standards of commercial mayonnaise, however the results obtained in the F2 formulation (powdered skimmed milk) reached standards equivalent to products sold, as the F3 formulation (powdered whey + skim milk powder), which matched the standards of mayonnaise classified as light in terms of texture and rheology.
The results of the water activity analyze confirmed that, as it is an oil-in-water emulsion, the formulations presented a high Aw value without major variations over the 30 days of evaluation. The powdered preservatives (powdered garlic and powdered mustard) favored the coloring of the formulations, making them closer to the color of a commercial mayonnaise. The pH in the neutral range ensured the products shelf life of 30 days at refrigeration temperature.
It was possible to use a mixture of skim milk powder and whey protein powder to improve the texture and rheology of emulsions as mayonnaise, in addition to obtain benefits such as higher protein content than the market mayonnaises and antioxidant activity.

