


 English (pdf)
 Article in xml format
 Article references
 Send this article by e-mail
 Cited by SciELO
  Similars in
SciELO
Similars in
SciELO 
 Permalink
BACKGROUND
Intolerance of uncertainty is a dispositional inability of an individual to withstand the aversive response triggered by the perceived absence of relevant, key or sufficient information, and sustained by the associated perception of uncertainty (Carleton, 2016). Individuals with high levels of intolerance of uncertainty tend to interpret uncertainty negatively (Carleton et al., 2007). Uncertainty may contribute to maladaptive emotional, cognitive and behavioral processes that are associated with emotional distress (Boswell et al., 2013; Buhr & Dugas, 2009). Perceptions of uncertainty may increase avoidance of uncertain situations to prevent feelings of anxiety or discomfort, however, also consequently maintaining negative perceptions of uncertainty, resulting in a vicious cycle (Carleton, 2016).
The concept of intolerance of uncertainty was initially proposed as a specific vulnerability factor for generalized anxiety disorder (Ladouceur et al., 1999). However, a substantial number of studies have provided evidence that intolerance of uncertainty is a transdiagnostic construct, associated with symptoms of multiple disorders. Evidence has demonstrated that intolerance of uncertainty is significantly related to a variety of anxiety and depressive disorders in both clinical and non-clinical samples (Carleton, 2016; Carleton et al., 2012; McEvoy & Mahoney, 2012). More specifically, robust and significant associations have been identified between intolerance of uncertainty and symptoms of generalized anxiety disorder (Gentes & Ruscio, 2011; McEvoy et al., 2019; McEvoy & Mahoney, 2012), social anxiety disorder (Boelen & Reijntjes, 2009; McEvoy & Mahoney, 2012), obsessive compulsive disorder (Holaway et al., 2006; McEvoy & Mahoney, 2012), panic disorder (Carleton et al., 2013), post-traumatic stress disorder (Fetzner et al., 2013), eating disorders (Sternheim et al., 2011), and depression (McEvoy et al., 2019; McEvoy & Mahoney, 2012).
Moreover, researchers have explored whether intolerance of uncertainty could be a relevant target for treatment. Oglesby et al. (2017) examined the efficacy of a cognitive bias modification intervention focused on intolerance of uncertainty. The results indicated significant changes in intolerance of uncertainty from pre-to-post treatment, as well as significant reductions at the one-month follow-up. Likewise, a number of studies found associations between changes in intolerance of uncertainty and reduction in psychopathological symptoms, such as generalized anxiety disorder (Dugas et al., 2003; McEvoy & Erceg-Hurn, 2016; Van Der Heiden et al., 2012), social anxiety disorder (McEvoy & Erceg-Hurn, 2016), anxiety and depression (Boswell et al., 2013; Dugas et al., 2003). Particularly, Boswell et al. (2013) conducted a clinical trial using the Unified Protocol for the Transdiagnostic Treatment of Emotional Disorders (Barlow et al., 2010), and found a significant decrease in intolerance to uncertainty over the course of the treatment as well as reductions in anxiety and depression symptoms post-treatment.
Intolerance of uncertainty has been defined as a multidimensional construct (Buhr & Dugas, 2002; Carleton et al., 2007; Freeston et al., 1994; Norton, 2005). One measure that has been widely used to assess this construct is the Intolerance of Uncertainty Scale (IUS) (Del Valle et al., 2020; Mary E. Oglesby et al., 2016; Paulus et al., 2015; Toro et al., 2018; Voitsidis et al., 2021). The IUS was first developed in French to assess emotional, cognitive, and behavioral reactions to uncertainty in everyday life situations (Freeston et al., 1994). The IUS consists of 27 items representing five different factors; however, one item did not load on any factor and four items loaded on more than one factor. The back-translated English version of the IUS found evidence for a four-factor structure, however six items loaded on multiple factors (Buhr & Dugas, 2002). Subsequent analysis of the IUS factor structure resulted in five and six factor solutions, with multiple factor loadings suggesting redundancy within the items (Norton, 2005). As a result, Carleton et al. (2007) developed a shorter 12-item version that highly correlated with the 27-item version (r=.96), had excellent internal consistency (α=.91), and a stable two-factor structure. The Intolerance of Uncertainty Scale short version (IUS-12) has proven to be a robust and stable measure of intolerance of uncertainty, representing two factors: prospective and inhibitory uncertainty. The prospective factor has an anticipatory cognitive nature and is conceptualized as a desire for predictability of future events (e.g., One should always look ahead so as to avoid surprises). The inhibitory factor refers to behavioral paralysis and impaired functioning due to uncertainty (e.g., The smallest doubt can stop me from acting) (Carleton et al., 2007).
The IUS-12 has been replicated in several studies supporting the correlated two-factor structure in diverse populations. Carleton et al. (2007) analyzed the factor structure in two undergraduate samples (Canada and USA) and found that the 12-item two-factor model provided the best fit for the data with excellent internal consistency (α=.91), and acceptable convergent validity with measures of depression (r=.56), anxiety (r=.57), worry (r=.54), and generalized anxiety (r=.61). Khawaja & Yu (2010) examined the psychometric properties of the IUS-12 in a clinical and non-clinical sample. Results indicated good internal consistency (clinical sample α=.87 and non-clinical sample α=.92), convergent validity with worry (r=.54) and trait anxiety (r=.60), and difference in the total scores of the clinical and non-clinical sample. McEvoy & Mahoney (2011) assessed the latent structure of the IUS-12 in a treatment seeking sample with anxiety and depression. Again, the two-factor solution showed the best fit, the total scale demonstrated good internal consistency (α=.93), and convergent validity with worry (r=.56), neuroticism (r=.55), and depression (r=.52).
Moreover, the IUS-12 has been translated, culturally adapted, and validated in different countries. Helsen et al. (2013) examined and compared both the IUS-12 and IUS Dutch versions. Results indicated that the IUS-12 two-factor model provided the best fit, internal consistency for the total score was adequate (α=.83), and convergent validity with worry (r=.52), and depression (r=.48). Lauriola et al. (2016) back-translated the English version of the IUS-12 to Italian and tested alternative models (two-factor, second-order and bi-factor). Results demonstrated that the bifactor model had the best model fit with an internal consistency of ω=.86 and ωH=.75 for the general factor, ω=.75 for the prospective and ω=.75 inhibitory factor. Kumar et al. (2021) assessed the factor structure of the Hindi version comparing a single-factor, correlated two-factor, truncated bifactor, and full bifactor. The bifactor model provided the best model fit of the data with an internal consistency of ω=.85. Kretzmann & Gauer (2020) translated to Portuguese the IUS-12 for the Brazilian population. The confirmatory factor analysis demonstrated that the original two-dimensional structure had a good fit, acceptable internal consistency (α=.88), and convergent validity with generalized anxiety (r=.58), worry (r=.68), and obsessive compulsion (r=.58). Pineda-Sánchez (2018) translated the IUS-12 to Spanish and examined its psychometric properties in a Spanish sample. Confirmatory factor analysis demonstrated that the correlated two-factor model provided the best model fit, with an excellent internal consistency of (α=.91), and convergent validity with measures of worry (r=.56), obsessive compulsive symptoms (r=.42), and anxiety (r=.38).
The increasing evidence base suggests that intolerance of uncertainty plays a significant role in the development, maintenance, and treatment of various disorder symptoms, highlighting the importance of reliable and valid measures for this construct. However, despite the broad importance of intolerance of uncertainty as a transdiagnostic construct, there is only one study on Spanish versions and no studies to the date were performed in a Mexican population. Therefore, the aim of the current study was to culturally adapt and validate the IUS-12 for the Mexican population. Confirmatory factor analyses were conducted to evaluate the factor structure of the scale in a Mexican community sample. Moreover, reliability estimates and convergent validity were examined. It was hypothesized that the Mexican version would replicate the bifactor structure (Carleton et al., 2007), have good internal consistency and partial invariance. Likewise, intolerance of uncertainty was hypothesized to be positively and strongly related to worry, and moderately related to depression and anxiety.
METHOD
Design
The present study has an instrumental design, as it focuses on examining the psychometric properties of a measurement instrument (Ato et al., 2013).
Participants
The study consisted of a convenience non-probabilistic community sample of 405 adults between 18 and 70 years of age (M=34.19, SD=12.9) recruited as part of the screening for a larger online intervention study for emotional disorders. In this sample, 234 were women (57.8%), while 171 were men (42.2%). Most participants were single (55.6%), while 21.5% married, 12.6% cohabitating, 4.2% separated, 3.2% divorced, and 2.2% otherwise. In terms of education level, 60.0% had completed an undergraduate degree 15.8% high school, 15.1% master’s degree, and 9.1% otherwise. The majority of the participants (84.7%) lived in Mexico City’s metropolitan area. Participants with incomplete data were considered to be dropouts.
Instruments
Sociodemographic data. A sociodemographic data questionnaire was developed requesting information on age, sex, marital status, level of education, and place of residence.
Intolerance of uncertainty scale, short version (IUS-12; Carleton et al., 2007). The IUS-12 is a 12-item self-report measure that assesses individuals’ ability to tolerate uncertainty about ambiguous future events. The IUS-12 includes two factors: prospective intolerance of uncertainty (PIU) (i.e., perceptions of threat related to future uncertainty) and inhibitory intolerance of uncertainty (IIU) (i.e., behaviors indicating apprehension about uncertainty). Individuals rate items on a five-point Likert scale (1=“not at all characteristic of me” to 5=“entirely characteristic of me”). A back-translated version in Spain yielded a two-factor solution similar to the original, with adequate internal consistency for both the total scale (α=.92) and subscales (PIU, α=.89; IIU, α=.91) (Pineda-Sánchez, 2018).
Penn State Worry Questionnaire (PSWQ-11; Meyer et al., 1990). The PSWQ measures the frequency and intensity of worry. The brief version (PSWQ-11) was adapted and validated in Spain in which the 5 items negatively worded were eliminated, thus consisting of 11 Likert-type items (with options from “nothing” to “a lot”) (Sandín et al., 2009). In the Mexican population the PSWQ-11 obtained a better model fit than the original 16-item (PSWQ-16) and obtained adequate internal consistency coefficient with an α=.88 (Padros-Blazquez et al., 2018).
Beck Depression Inventory-II (BDI-II; Beck et al., 1996). The BDI-II is a self-report questionnaire to assess behaviors, attitudes, and feelings that characterize depression within the last two weeks. It includes 21 symptom items that use a 4-point scale (scored 0-3) that reflect increasing symptom frequency or severity. Total scores can range from 0-63 with the following cut-offs points: 0-13 minimally depressed, 14-19 mildly depressed, 20-28 moderately depressed, and 29-63 severely depressed. The BDI-II was adapted and validated in Mexico showing an adequate internal consistency with student (α=.92) and community (α=.87) samples (González et al., 2015).
Beck Anxiety Inventory (BAI; Beck et al., 1988). The BAI is a 21-item self-report measure of the severity of common affective, cognitive, and somatic symptoms of anxiety. Items have four response options ranging from 0 “not at all” to 3 “severely”. The cut-off points are: 0-5 minimal anxiety, 6-15 mild anxiety, 16-30 moderate anxiety and 31-63 severe anxiety. Validation in Mexican population yielded adequate internal consistency, with α=0.84 in the student sample and α=0.83 in the community sample, and a high test-retest reliability coefficient r=0.75. The four-factor structure of the scale is consistent with that reported in previous studies and the original version (Robles et al., 2001).
Procedure
The Mexican adaptation of the IUS-12 was based on the items from the Spanish version (Pineda-Sánchez, 2018). Although the Spanish and the Mexican populations share similarities in language, it was necessary to make adaptations due to cultural differences in expressions and words that vary from one country to another and could potentially cause confusions. For example, in item 6 “No soporto que me cojan por sorpresa” the Spanish version uses the verb “cojan”, which in Mexico has a sexual connotatiom. Therefore, this item was changed to “No soporto que me agarren por sorpresa”. Likewise, other items were adapted to reflect a more colloquial form of Mexican Spanish. Additionally, response options were increased from five to six because psychometric precision has been found to be low with five or fewer options and remain stable after six (Simms et al., 2019). The items were revised by three researchers and university professors from the National Autonomous University of Mexico (UNAM) with experience in emotional and trauma disorders (DeVellis, 2016; Furr, 2011; Rubio et al., 2003). The battery of instruments was set up on the SurveyMonkey online survey platform and the participants were recruited through ads in social media.
Data analysis
Statistical analyses were estimated using SPSS-25 package and AMOS-23. First, an item variability analysis was performed. Second, multivariate normality was estimated with the Mardia’s coefficient that according to Bollen (1989) when Mardia’s coefficient is less than p(p+2), where p is the number of observed variables, the sample shows multivariate normality. Third, to examine the factor structure of the IUS-12 Mexican adaptation a Confirmatory Factor Analysis was performed. Model parameters were estimated with maximum likelihood estimation. This method is applicable when the items analyzed have a minimum of five response options as is the present case in this study (Rhemtulla et al., 2012). This allows a simpler factor model to be applied, rather than a more complex one such as those using polychoric correlations and least squares estimators (e.g., WLSMV). Model fit was assessed considering the following fit indices: Chi square (χ2), relative Chi square (χ2/df), Comparative Fit Index (CFI), Tucker-Lewis index (TLI), Standardized Root Mean Square Residual (SRMR), and Root of the mean square error of approximation (RMSEA). An appropriate model fit was considered when χ2/df was between 1 and 3, CFI and TLI≥.95, SRMR≤. 08, and RMSEA≤.06 (Bagozzi & Yi, 2011; Hu & Bentler, 2009). The estimated sample size considering a CFI of 0.95, significance level (α) of 0.05 and a statistical power of 0.80, was 279 participants (Arifin, 2023). Fourth, to assess the reliability of the scale, we calculated the omega hierarchical for the IUS general factor (ωH) and omega hierarchical subscale (ωHS) for the specific factors (Prospective and Inhibitory). Furthermore, in order to determine whether a bifactor structure with a strong general factor should be represented as a unidimensional or multidimensional (bifactor). Unidimensionality of a scale could be interpreted when Omega hierarchical values for the general factor are greater than .70, the explained common variance (ECV) values are greater than .60, and the percentage of uncontaminated correlations (PUC) values are lower than .80 (Reise et al., 2012; Rodriguez et al., 2016). Next, to assess whether the model was invariant across sexes, a multi-group analysis was conducted, a strong invariance is supported when ΔCFI≤0.01, ΔRMSEA≤0.015 and Δχ2 results with p>.05 (Cheung & Rensvold, 2002). Finally, to assess convergent validity Pearson's correlations were calculated between IUS-12 and the average scores of worry, anxiety and depression symptoms.
Ethics Aspects
This study was part of a larger research project “Suitability, Clinical Utility and Acceptability of an Online Transdiagnostic Intervention for Emotional Disorders and Stress-related Disorders in Mexican Sample: A Randomized Clinical Trial” which was approved by the Ethics Committee of the Faculty of Higher Studies Iztacala UNAM (CE/FESI/ 082020/1363). All participants read and agreed to an electronic consent before completing the self-report questionnaires online.
RESULTS
Preliminary analysis
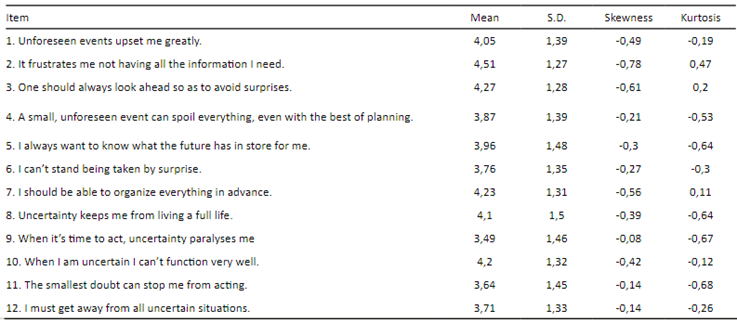
Prior to data analyses, the means, standard deviation, skewness, and kurtosis were calculated. The standard deviations ranged from 1.26 to 1.49, indicating minimal variation. None of the skewness and kurtosis indices were out of range (Tabachnick & Fidell, 2013). Descriptive statistics for the sample are presented in Table 1.
Table 1 Intolerance of uncertainty Scale 12-item Mexican version (IUS-12M) Items means, standard deviations, skewness, kurtosis
Confirmatory factor analysis
Multivariate normality of the data was estimated by obtaining Mardia's coefficient of multivariate kurtosis, which was 35.452, a lower value to cutoff criteria indicated by Bollen (1989) that for 12 observed variables would be: 12(12+2) =168. Subsequently, a confirmatory factor analysis was performed in order to test the factor structure of the scale. Initially, we tested the correlated two-factor model, model fit indices indicated an acceptable model fit (see Table 2). However, correlation between the factors was high (Φ=.77). Therefore, a unidimensional factor model was examined, which resulted in a poor model fit. Finally, a bifactor model was estimated with results that indicated it had the best model fit. As observed in Figure 1, standardized factor loadings for the general factor were positive, while those for the specific factors negative, except for item 8. may occur due to participants interpreting it differently, as it reflects a slightly distinct aspect of uncertainty compared to the preceding items. These results support that the factor structure of the IUS-12M can be conceptualized as a general factor and a prospective and inhibitory specific factor.
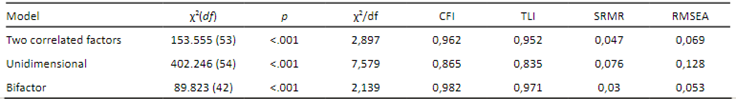
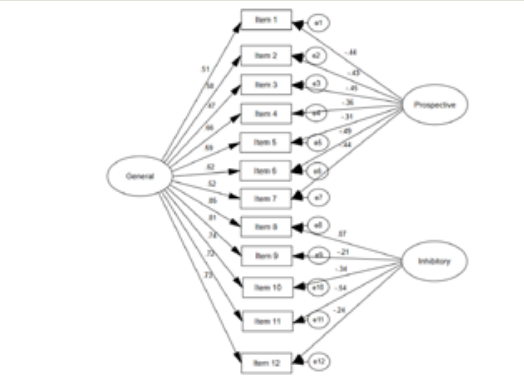
Figure 1 Standardized factor loadings for the bifactor model of the 12-item Intolerance of Uncertainty Scale Mexican version (IUS-12M)
Reliability
Reliability analysis of the bifactor model was estimated through the omega and omega hierarchical coefficients, which are more appropriate index of reliability for bifactor models (Rodriguez et al., 2016). The omega of the scale (ω=0.91) represents the variance in the total score without differentiating variance from the general or specific factors. Additionally, we estimated the omega hierarchical which represents the proportion of the variance explained by the general factor after controlling the variance accounted for the specific factors (ωH=.80). The unique variance of each specific factors after controlling for the variance accounted by the general factor were ωHS=.30 for the Prospective factor and ωHS=.09 for the Inhibitory factor. According to the explained common variance (ECV), 75% of the common variance was attributable to the general factor of IUS-12. Given that an ECV value was greater than .60, the percentage of uncontaminated correlations (PUC=.53) lower than .80, and ωH greater than .70 a unidimensional interpretation of the scale is appropriate (Reise et al., 2012).
Invariance
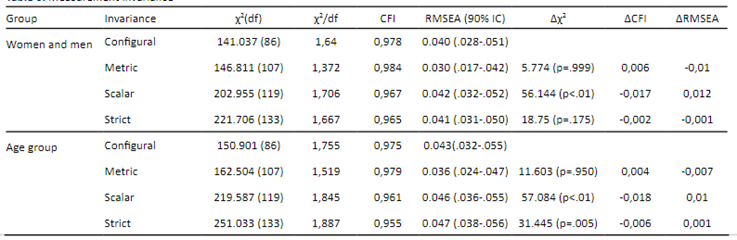
To examine whether the bifactor model was invariant across sexes (women, men) and age (young adults, older adults), a multi-group analysis was conducted. First, the configurational or baseline model that allowed the factor loadings to be freely estimated was compared with a metric invariance model that constrained the factor loadings across the two groups, then this model was compared with a scalar invariance model that constrained the intercepts in addition to the factor loadings, and finally this model was compared with a strict invariance model that also constrained the residuals (see Table 3). The test for sex invariance showed equivalence of the factor structure between men and women, except for one of the parameters of the invariance model. In the case of age invariance, the test showed equivalence in factor loading. In this case, a partial invariance would be assumed (Dimitrov, 2010), however it has been recognized that strict invariance tests are excessively restrictive (Bentler, 2004).
Convergent validity
According to the nomological network of intolerance of uncertainty, this construct contributes to maladaptive cognitions such as worry, and avoidance behaviors present in emotional disorders (Boswell et al., 2013). Several studies have shown that intolerance of uncertainty is a maintenance factor due to its positive associations with a variety of psychological disorders such as depression and anxiety disorders (Carleton et al., 2012). The IUS-12 is expected to have a positive relation to anxiety, depression and worry measures. The IUS-12M was correlated with measures of anxiety (BAI), depression (BDI-II), and worry (PSWQ-11). Results indicated the IUS-12M correlated strongly with PSWQ-11 (r=.685, p<0.001) and BDI-II (r=.582, p<0.001), and moderately with the BAI (r=.439, p<0.001). These results support the convergent validity of the scale.
DISCUSSION
After culturally adapting the individual items, we performed confirmatory factor analyses with competing measurement models (correlated two-factors, unidimensional, and bifactor). First, we estimated the correlated two-factor solution mirroring the English versions with both clinical and non-clinical samples (Carleton et al., 2007; Khawaja & Yu, 2010; McEvoy & Mahoney, 2011), results indicated an adequate model fit. However, given that there was a strong association between the two factors, a unidimensional factor structure was also examined, but had a poorer model fit, also in line with previous studies (Carleton et al., 2007; Shihata et al., 2018). Finally, we estimated a bifactor model, which resulted in the best model fit for the data. The bifactor model solution was also supported in recent findings for the IUS-12 (Kumar et al., 2021; Lauriola et al., 2016; Shihata et al., 2018). Therefore, the results indicated that the structure of the IUS-12M is better explained by a bifactor solution consisting of a general factor and two specific factors (prospective and inhibitory uncertainty).
The IUS-12M had a good internal consistency for the general factor, which explained most of the common variance of the model. The reliability of the IUS-12M was quite similar to previous bifactor models such as the Italian (Lauriola et al., 2016) and the Indian (Kumar et al., 2021) versions. Previous research has suggested the interpretation and assessment of the prospective and inhibitory factors, while other studies indicate that a total score is more appropriate. However, these affirmations have not been psychometrically supported (Hale et al., 2016). The inclusion of bifactor modeling is a method for testing whether the subscales contribute sufficient variance after controlling for a general factor, or if the scale represents a single underlying construct (Rodriguez et al., 2016). Given that the IUS-12M general factor explained a greater amount of common variance and the prospective and inhibitory specific factors were not contributing substantially to the reliability of the total score, the use of the total score is a more appropriate measure for assessments. This result was also in line with other bifactor models of the scale (Hale et al., 2016; Kumar et al., 2021; Lauriola et al., 2016).
Regarding scale invariance, many researchers expect psychometric instruments to assess similar constructs in women and men, therefore rarely testes invariance, resulting in bias in research findings going unnoticed (Steyn & de Bruin, 2020). Particularly for the IUS-12 there is limited evidence testing for sex invariance, however, the existing evidence report partial invariance (Helsen et al., 2013; Kumar et al., 2021; Lauriola et al., 2016). For the Mexican version, despite a slight sex imbalance in the sample, the bifactor model was stable across women and men as indicated by both factor structure and factor loadings. On the other hand, age invariance only demonstrated a stable factor structure, which could potentially indicate differences in comprehension of the items between age groups. However, there is insufficient evidence of age invariance in the construct of intolerance of uncertainty, suggesting a need for further exploration.
To establish the convergent validity, the IUS-12M was correlated with measures of worry, depression, and anxiety. According to the nomological network, the construct of intolerance of uncertainty should be positively and strongly related to worry, and moderately related to depression and anxiety. This hypothesized pattern was supported for all three measures in the present study. However, the correlation was stronger for depression than for anxiety. This could be explained by previous findings that trait anxiety has a stronger relation with intolerance of uncertainty than state anxiety (Khawaja & Yu, 2010). The correlation analyses indicated that participants with high scores of intolerances of uncertainty also had high scores of worry, depression, and anxiety, which is consistent with previous studies (Helsen et al., 2013; Kretzmann & Gauer, 2020; McEvoy & Mahoney, 2011; Pineda-Sánchez, 2018). Overall, correlation patterns between the IUS-12M and worry, depression, and anxiety supported the convergent validity of the Mexican adaptation. Although, we examined convergent validity in this study, it is important to note that future studies should also examine discriminant validity to further strengthen the validity evidence of the measure.
Limitations
The findings in this study should be interpreted in the context of various limitations, mostly concerning the sample characteristics. Despite great efforts to seek diverse sample, the majority of participants lived in the metropolitan area of Mexico City and approximately 60% has an undergraduate degree, Mexico is a culturally diverse country with an overall low attainment of tertiary education (i.e., less than 25% of the population hold an undergraduate degree; OECD, 2019). Further, the sample consisted of non-clinical individuals. Therefore, the present findings might not generalize fully to less educated individuals or those living in other regions. However, concerning the non-clinical characteristics, previous research found stable psychometric properties across clinical and non-clinical samples (Khawaja & Yu, 2010). In contrast, compared to other adaptations based exclusively on young student samples (e.g., Kumar et al., 2021), the results from this study derive from a wider age range sample. Finally, while the bifactor model emerged as the best-fitting model in our sample, its applicability to the Spanish version cannot be definitively asserted. Therefore, future studies should investigate whether the bifactor model remains the best-fitting option for the Spanish version. Despite the limitations of the sample, these findings align well with international research, which may be indicative of robust psychometric properties for the current Mexican adaptation. That said, future research should aim for more representative samples. In sum, the IUS-12M demonstrated evidence of internal consistency, invariance between sexes, and convergent validity.
Clinical implications
The findings of this study hold important clinical implications for understanding and addressing intolerance of uncertainty within the Mexican population. The validation of the IUS-12M in this cultural context provides mental health professionals with a valuable instrument for assessing intolerance of uncertainty, a transdiagnostic factor that plays a significant role in the development, maintenance, and treatment of emotional disorders. Furthermore, the identification of a bifactor model provides clinicians with better understanding of intolerance of uncertainty, which can guide targeted interventions for the diverse facets of this construct. Additionally, the IUS-12M holds promise in offering valuable insights for the development of public health policies and programs dedicated to preventing and treating emotional disorders.
Conclusion
The Intolerance of Uncertainty Scale short version (IUS-12) has proven to be a robust self-report measure to assess intolerance of uncertainty. Previous psychometric analyses of the IUS-12 have demonstrated a stable two-factor structure, corresponding to prospective and inhibitory factors of intolerance of uncertainty. However, recent studies support the bifactor model to best explain the factor structure of the IUS-12. This study culturally adapted and validated the IUS-12 in a Mexican community sample of 405 adults. Confirmatory factor analyses indicated that the bifactor model had the best model fit. Internal consistency of the general factor was excellent ωH=0.80. Invariance testing indicated partial invariance across women and men. With regard to the convergent validity, the results showed that the IUS-12M was related to measures of worry, depression and anxiety. These findings support the reliability and validity of the adapted version of the IUS-12 in Mexican population.

