


 Spanish (pdf)
 Article in xml format
 Article references
 Send this article by e-mail
 Cited by SciELO
  Similars in
SciELO
Similars in
SciELO 
 Permalink
INTRODUCCIÓN
Tal como en el resto del mundo, donde el costo del sector salud representa el 10% del producto bruto interno, los gastos en nuestro país aumentan anualmente en dicho rubro. Durante el presente año la atención para cobertura sanitaria alcanza una proyección total de casi 25 mil millones de soles (Presidencia del Consejo de Ministros, 2022). Los servicios de salud pública apenas se dan abasto para atender a miles de usuarios, los especialistas escasean, sobre todo en el interior del país, y en particular respecto a los que brindan atención en salud mental, solo se les destina el 2 % del presupuesto del Ministerio de Salud (Universidad Peruana Cayetano Heredia, 2022), quedando mucha gente sin la posibilidad de poder atenderse. El tratamiento de quienes pueden acceder tiene que adaptarse a las condiciones de precariedad espacial y temporal, obligando a intervenciones breves y psicoterapias a corto plazo. Esto, evidentemente, atenta contra el óptimo servicio y la adherencia al tratamiento, tanto médico como psicológico.
Definida por la OMS (2003) como “el grado en el que la conducta de un paciente, en relación con la toma de medicación, el seguimiento de una dieta o la modificación de hábitos de vida, se corresponde con las recomendaciones acordadas con el profesional sanitario”, la adherencia al tratamiento es, evidentemente, un concepto que comprende tanto el uso sanitario como psicoterapéutico. Su incidencia muestra una magnitud oscilante entre 25% y 50% en relación con factores relacionados tanto con el paciente, la enfermedad, el fármaco, el entorno y el prestatario del servicio sanitario; como con el acceso a la atención de salud disponible en la región desarrollada o en vías de desarrollo donde ocurre (Reyes-Flores et al., 2016), y su ausencia puede determinar tasas más altas de recaídas, hospitalizaciones, síntomas psicóticos, periodos de remisión más largos, suicidios, deterioros cognitivos, morbimortalidad y mala calidad de vida; además del aumento de los costos referentes al uso de servicios sanitarios (Torras y Tomás, 2018).
Un tema adjunto al fenómeno en mención es la connotación de su significado. Aun cuando “adherencia” es el término oficial de la OMS, según Martín Alfonso et al. (2014), en la literatura utilizada para hablar de ello “se han propuesto muchos otros como: adhesión, cooperación, colaboración, obediencia, observancia, alianza terapéutica, seguimiento, concordancia y conformidad” (p. 227). De hecho, autores interconductuales dedicados al campo de la salud como Piña y Sánchez (2007), se decantan por “adhesión” como la mejor etiqueta para designar lo que consideran:
“Frecuencia con la que el usuario de los servicios de salud práctica, a lo largo de un periodo variable y a partir de las competencias de que dispone, una diversidad de comportamientos que le permitan cumplir de modo eficiente con determinados criterios, en estricta correspondencia con las instrucciones provistas por el equipo de salud” (p. 401).
Lo cierto es que, más allá de la pertinencia o no de los argumentos semánticos esgrimidos por los citados Piña y Sánchez para preferir uno u otro término, desde la óptica del presente escrito no se entrará en esa discusión por ser marginal a la tesis aquí sustentada, continuando con el uso habitualmente aceptado de “adherencia” que se maneja en el campo sanitario.
En el contexto de la atención psicológica, por lo menos en los planos de las corrientes dinámica, humanista y parte de la cognitivo-conductual, se suelen atribuir muchas de las peculiaridades de la falta de adherencia psicoterapéutica al conocido mecanismo llamado “resistencia” (Roudinesco y Plon, 2008), interpretado con ciertas variaciones por cada uno de dichos enfoques psicológicos; constituyendo un aspecto central del trabajo del psicoterapeuta analizar sus causas y superarlas. Una de las estrategias para llevar adelante esa labor es identificar los rasgos de la personalidad del individuo, que se suponen datos básicos para entender sus tendencias generales a actuar, pensar y sentir; por lo cual hay un abundante uso de pruebas psicométricas proyectivas y/o estadísticas dirigidas a “medir” tales rasgos y su grado de presencia. Igualmente, en el caso de las variantes teóricas cognitivas, se añade la apreciación escalar de las creencias sobre la salud que tienen los usuarios de los servicios.
Tradicionalmente, esta clase de estrategias no han sido bien valoradas a nivel doctrinario por el enfoque conductista, sobre todo el radical, debido a su rechazo a constructos como la personalidad y énfasis respecto a la observación de la conducta manifiesta, amén del inductivismo y situacionismo que le son inherentes al análisis funcional skinneriano. Se dice a nivel doctrinario porque, en la práctica y desde hace ya mucho tiempo (Fernández Ballesteros y Staats, 1993), una buena parte de los analistas conductuales no cumplen a cabalidad con semejante mandamiento, utilizando profusamente instrumentos de investigación y evaluación de la personalidad (inventarios, escalas, cuestionarios, encuestas, etcétera). Esto incluso se ha incrementado con el advenimiento de la “tercera generación” de terapias conductuales post-skinnerianas (p. ej. véanse Velásquez et al., 2018; Tomás del Río et al., 2021).
Es un hecho, como dice Bandura (2012), que las pruebas empíricas de una teoría no solo incluyen la teoría central, sino también suposiciones auxiliares e intervenciones psicológicas y medidas evaluativas. Lo dicho pone de manifiesto que se necesita “ventilar” el caudal teórico-procedimental de los clínicos comportamentales, dándole una justificación teórica a la práctica dominante. Esta, según lo visto en párrafos anteriores y, a la luz del uso común en psicología de la salud, tendría que aclarar el papel de las variables de personalidad y las creencias del individuo en relación con las estrategias de mantenimiento de la adherencia del usuario de los servicios sanitario y psicoterapéutico. Es decir, lo que en jerga técnica conductual se ubica como “categorías disposicionales” del comportamiento.
Entonces, con este objetivo, a continuación, se sigue un hilo argumental que primero define las disposiciones desde una perspectiva conductual integrativa, luego relaciona a éstas con los rasgos y las creencias, y, finalmente, juzga si las categorías disposicionales señaladas pueden ser operativamente valiosas una vez reformuladas a partir del enfoque conductual.
LA PERSONALIDAD VISTA POR EL CONDUCTISMO
En el marco histórico de las teorías conductuales, entendiendo por ellas el conjunto de formulaciones que a la sombra de los diversos tipos de conductismo existentes (radical y metodológico), el tema de la personalidad ha sido relativamente elusivo. Definido este constructo de manera expedita en los albores del conductismo por Watson (1945) como “el producto final de nuestros sistemas de hábitos” (p. 308), fue poco menos que desechado por el radicalismo skinneriano (Skinner, 1991), arguyendo que tanto lo que se llama “personalidad” como “el yo” únicamente constituyen locus de convergencia bio-social, más en ninguna circunstancia operan como agentes iniciadores de la conducta.
Por otro lado, las variantes conductistas metodológicas identificadas con el “aprendizaje social” ꟷel grupo representado por Dollard y Miller (1984); Sears (1951); Mowrer (1950); y otras tendencias similares (Rotter, 1964; Bandura y Walters, 1977)ꟷ; así como la comprometida con el factorialismo (Eysenck, 1978); sí entraron al análisis detallado del constructo de personalidad, o bien ateniéndose estrictamente a la lógica de la teoría del condicionamiento (traduciendo principios psicoanalíticos a una conceptuación de aprendizaje), o ampliando el enfoque al introducir numerosas variables intervinientes referidas a la cognición o a la herencia genética.
Ninguna de las teorías mencionadas logró imponerse como opciones válidas para representar de alguna manera al paradigma conductual dentro de los numerosos manuales disponibles referentes a la psicología de la personalidad publicados o reeditados en el presente siglo (por ejemplo, Feist et al, 2014; Di Caprio, 2018; Lester, 2019). Con excepción de la de Cloninger (2003), que le da lugares a Staats y a Dollard y Miller, dichas obras incluyen en su sección de teorías conductistas o “del aprendizaje” solo la de Skinner, connotado más como una especie de contrapunto “antipersonalidad”.
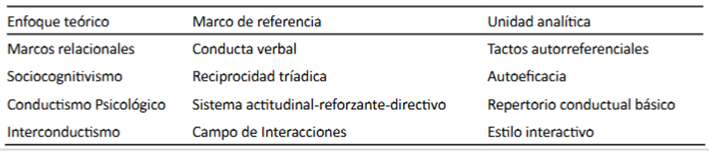
Al cimentarse una postura poco propicia respecto a la asunción comportamental de la personalidad se dejarían de lado importantes categorías taxonómicas, operacionales y representacionales, dificultando tanto el abordaje teórico más profundo de dicho constructo como sus correlatos evaluativos y terapéuticos. De allí que en tiempos recientes hayan aparecido alternativas de gran alcance en la teoría del comportamiento para reorientar el estudio de este campo hacia horizontes más productivos, como las brindadas por el conductismo psicológico (los repertorios básicos conductuales: Staats,1997), el interconductismo (los estilos interactivos: Ribes, 2018), la teoría de marco relacional (desarrollo autorreferencial del yo: Kohlenberg, 2013), e inclusive el sociocognitivismo (repertorios de autoeficacia percibida: Bandura, 2012). Esto se trata con mayor atención en Montgomery (2005, 2017 , 2020), de modo que no se entra aquí en más detalles (Tabla 1). Desde las alternativas mencionadas —especialmente el conductismo psicológico y el sociocognitivismo— es posible hacer un análisis de categorías vinculadas a la personalidad y a las creencias, con el fin de ubicar su utilidad para el examen y modificación de las actitudes del cliente en el marco de sus hábitos de salud, en tanto factores subjetivos que predicen, facilitan o dificultan a los servicios psicológicos llevar adelante tratamientos eficaces.
Tabla 1 Teorías conductistas y conductual-cognitivas recientes de la personalidad, sus marcos referenciales y unidades de análisis (Montgomery, 2020, p. 92).
FACTORES DISPOSICIONALES: RASGOS Y CREENCIAS
¿Cuál es la función de las disposiciones? Ribes y Fuentes (2020) señalan que éstas son de naturaleza histórica y situacional, apuntando a tendencias o propensiones, y así “facilitan o interfieren a la reactividad inicial y subsecuente del individuo durante las interacciones que configuran un contacto funcional determinado” (p. 275). De esta manera, como apunta Ryle (2005), los eventos disposicionales “son (…) inferencias que nos autorizan a predecir, decir, explicar y modificar (…) acciones, reacciones y estados” (p. 125).
Puesto que las disposiciones siempre tienen una configuración doble, es decir la de constituir eventos equivalentes a propensiones psicológicas y a la vez ser sistemas reactivos biológicos, huelga manifestar que tienen un carácter tanto instrumental como respondiente en su contribución a que suceda algo en relación con una contingencia particular. Podría anotarse, siguiendo esta línea, que, en lenguaje de Staats (1997), su ocurrencia conlleva funciones de respuesta condicionada, reforzada y directiva, siendo esta última la que sintetiza el poder de las dos anteriores al servir de “guía” para el comportamiento autónomo (desligado situacionalmente) del individuo. Por tanto, la categoría disposicional en el sentido en que se usa aquí ayuda a situar el comportamiento en términos de potencialidad. Hablar de un fumador no necesariamente connota de alguien que esté fumando, sino de alguien que tiene la propensión a fumar.
Habiendo colocado a los rasgos de personalidad y a las creencias como factores disposicionales, y dado que la diversidad de connotaciones psicológicas que conllevan estos dos planos le dan un carácter conceptualmente ambiguo, es oportuno precisar en qué sentido se consideran dentro de la argumentación presente. Así, de acuerdo con la disquisición de Kantor y Smith (2015):
Puede hacerse una clara distinción entre el uso psicológico y popular del término personalidad al observar que, desde una perspectiva psicológica, personalidad se refiere siempre a conducta. Personalidad psicológica significa las formas en las cuales un individuo interactúa con cosas (p. 144).
No es incompatible con semejante juicio hacer patente que esta clase de conducta puede tener modalidades funcionales que pasan por los aspectos lingüístico-cognoscitivo, emotivo-motivacional y sensorial-motor (Staats, 1997), desde el punto de vista de los repertorios implicados en semejantes interacciones.
Desde un punto de vista de la teoría del aprendizaje, los “rasgos” no son otra cosa que repertorios de comportamiento compuestos de frecuentes respuestas prototípicas de un individuo en relación con ciertos contextos, que hacen inferir al observador una serie de regularidades dignas de etiquetarse con lenguaje coloquial. Es evidente que cierto tipo de repertorios se relacionan con circunstancias particulares: una persona que ríe y alterna socialmente con mucha frecuencia es llamada “extrovertida”, alguien que niega atenciones y se aísla altivamente puede ser llamado egoísta. Quien acostumbra a juzgar o criticar a los demás en base a sus características personales puede merecer el apodo de “fijón”, etcétera. Todo esto se puede sintetizar en agrupaciones cada vez más extensas (Figura 1).
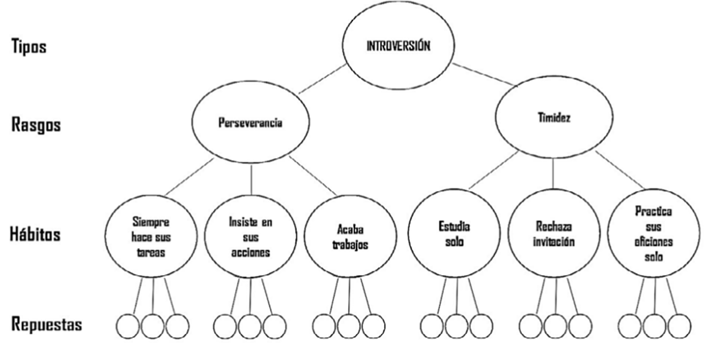
Figura 1 Organización conductual por repertorios progresivamente inclusivos, desde las respuestas prototípicas hasta su síntesis frecuencial de mayor complejidad (adaptado de Feist et al., 2014, p. 263; con referencia al sistema de Eysenck).
Para la óptica de Ribes (2018), este procedimiento de aglutinación de respuestas en agrupaciones cada vez más sintéticas y consistentes para asignarle propiedades supuestamente multicausales al constructo de mayor extensión, es inadecuado, pero lo cierto es que los problemas de la explicación circular (“¿llora porque está triste o está triste porque llora?”) y de la reificación de estas generalizaciones son inherentes al lenguaje ordinario —en tal sentido inevitables—, y en la lógica en que lo asume Wittgenstein (2021), pueden ser aceptables como “juegos de lenguaje”, es decir una manera de referirse a las cosas en términos situacionalmente circunscritos al episodio en que se produce una interacción, sin salirse del contexto.
Lo que no se puede negar es la singularidad del individuo y la generalidad de una parte de su conducta respecto a situaciones diferentes. Si eso se tiene claro, es posible afirmar que lo que se llama “rasgos” en la mayoría de teorías de la personalidad constituyen clases de respuesta (“sistemas de hábitos” según Watson 1945; “repertorios conductuales básicos” según Staats, 1997; “estilos interactivos” según Ribes, 2018) aprendidas sobre la base de condiciones disposicionales (que, ya se ha dicho, son tanto situacionales como biológicas) y expresadas en una contingencia.
En cuanto a las creencias, en un interesante pasaje de su ensayo Ideas y Creencias, Ortega y Gasset (2019), dice:
Las creencias constituyen la base de nuestra vida, el terreno sobre que acontece. Porque ellas nos ponen delante lo que para nosotros es la realidad misma. Toda nuestra conducta, incluso la intelectual, depende de cuál sea el sistema de nuestras creencias auténticas. En ellas "vivimos, nos movemos y somos". Por lo mismo, no solemos tener conciencia expresa de ellas, no las pensamos, sino que actúan latentes, como implicaciones de cuanto expresamente hacemos o pensamos (p. 6).
Sin duda las creencias son, técnicamente hablando, uno de los factores disposicionales más frecuentes en el comportamiento, porque involucran mediaciones convencionales insertas en la cultura de referencia. De allí que se expresen como modos lingüísticos de interacción ꟷdescribiendo y relacionando objetos, eventos o situacionesꟷ, y se configuren en una historia personal que probabiliza ciertas prácticas individuales sobre la base de premisas verbales previas.
Como señala Obregón (1996), las creencias han sido identificadas por diferentes aproximaciones psicológicas con informaciones ligadas a atributos, con opiniones y con estructuras cognoscitivas, equiparándose además a imágenes, ideas, impulsos, actitudes y motivos. El único consenso entre estas aproximaciones podría ser el de que las creencias implican alguna forma de lenguaje, por lo que esto último parece ser la clave de su entendimiento. Así:
El creer, relacionar, se vuelve creencia cuando el individuo es capaz de describir y referenciar las contingencias de las cuales se conduce o realiza el creer (Obregón (1996), p. 46).
El comportamiento, como prácticas del individuo dentro de grupos sociales particulares, debe verse influido por creencias particulares, de forma tal que los objetos y las acciones hacia él puedan ser mediados lingüísticamente, en un sentido funcional, por las relaciones implicadas en las creencias. Dada su naturaleza transituacional, las creencias no prescriben un comportamiento específico efectivo (instrumental), sino una correspondencia con la convención (las reglas o ideales sociales) (Obregón (1996), p. 47).
Puesto que la naturaleza transituacional de las creencias se manifiesta de ese modo, no es extraño que en los reportes verbales del comportamiento no coincidan muy a menudo con las acciones instrumentales del individuo. Creer no significa hacer. Se trata solo de una disposición. Eso presenta un problema al construir instrumentos de autoinforme.
PERSONALIDAD Y CREENCIAS SOBRE LA SALUD
Los constructos de rasgos y creencias son útiles no solo para comprender fenómenos teóricos propios de la psicología, sino también para aplicarlos a la actividad tecnológica. Por esta vía transita la especialidad llamada “Psicología de la salud”, que, como señalan Reynoso y Seligson (2005), (…) puede ser definida como un campo que tiene relación con el desarrollo y conocimiento de las ciencias de la conducta y se vuelve de vital importancia para la comprensión de la salud y la enfermedad física y su aplicación, o sea para la prevención, diagnóstico, tratamiento y rehabilitación” (p. 31).
A lo largo del devenir de la psicología de la salud se configuraron dos modelos (Amigo, 2015): el biomédico, centrado en una concepción dualista cuerpo-mente, donde la enfermedad tiene que ver con reacciones físicas y químicas independientes de predisponentes psicológicos, por lo cual la curación asistencial se da a través de fármacos o placebos; y el biopsicosocial, que busca integrar las influencias biológicas, psicológicas y sociales en la alteración o mantenimiento del equilibrio salud-enfermedad, y le otorga al cliente terapéutico un grado de responsabilidad sobre el manejo de los problemas que complementa el tratamiento estipulado por el profesional de la salud.
Es obvio que la opción preferente del psicólogo clínico conductual entre estas dos alternativas va por la segunda de ellas, porque hoy en día resulta evidente que la incidencia y prevalencia de la morbilidad tiene mucho que ver con los patrones comportamentales y estilos de vida de la gente. La depresión, la ansiedad y el estrés, suelen ser productos de semejante impacto, lo cual se ha revelado aun con más fuerza durante la ocurrencia de la pasada pandemia, incluso entre los trabajadores sanitarios (Osorio et al., 2022). A su vez, dichos estados psicológicos vulnerables pueden tener relación con determinados repertorios de personalidad, y también se pueden expresar a través de las creencias sobre la salud, facilitando o interfiriendo las tareas de rehabilitación.
Existen numerosas propuestas cognitivo-conductuales respecto a la influencia de la personalidad de un individuo sobre su propensión a ser vulnerable a ciertos tipos de dolencias. Por ejemplo, el modelo de Eysenck y Grossarth-Maticek (Orejudo et al., 2004) cuenta hasta seis tipos de personalidad, cada uno de ellos vinculado a la probabilidad de sufrir determinadas enfermedades y a protegerse de otras. Por ejemplo, altos puntajes en las dimensiones de neuroticismo y psicoticismo serían predictores de riesgo para padecer enfermedades cardiovasculares y de resguardo ante el cáncer, mientras que la dimensión de extraversión predispondría al cáncer y protegería de riesgo cardiovascular. Otros constructos disposicionales de la personalidad que se han postulado en el mismo sentido de ligarlos como mediadores frente a conductas de salud son el locus de control, el patrón de conducta tipo A, el estilo atributivo, la autoeficacia y el estilo de afrontamiento. Desde esta lógica, las evaluaciones mediante pruebas de medición estadística acerca de la tipología o el grado de presencia de cada constructo ayudarían a detectar individuos en riesgo, y los tratamientos psicoterapéuticos procurarían modificar las variables cognitivas y conductuales para que éstas, a su vez, cambien las variables emocionales.
Respecto a las creencias sobre la salud, las propuestas implicadas también se hayan predominantemente en el campo cognitivo-conductual. Son los llamados “modelos de cognición social”. La revisión de Amigo (2015) sobre el punto, permite sintetizar en la Tabla 2 las características de tres teorías que consideran que las creencias que tiene el individuo sobre la salud influyen en sus hábitos, y que, modificando actitudes mediante campañas informativas o apelaciones al temor, se lograrán mejorías en el grado de implicación que el cliente asume frente a los riesgos de salud, sea en cuanto a prevención de enfermedades o de adherencia a los tratamientos.
Tabla 2 Tres modelos de cognición social de las conductas de salud (tanto las descripciones como los ejemplos le corresponden a Amigo, 2015, pp. 32-34).

Estos modelos han recibido diversas críticas desde el enfoque conductista ortodoxo porque centran su enfoque en variables mentalistas, y además dirigen sus opciones de solución a través de generalidades que afectan poco el cambio de comportamiento de las clientelas directa y potencial. Las mismas críticas se han ampliado desde el interconductismo (Piña, 2008, 2015), pero en opinión del presente autor no puede dudarse de su parcial utilidad predictiva de los constructos reseñados en términos de planteamientos más o menos exhaustivos respecto a estos temas, que podrían ser refinados utilizando una lógica conductual. Justamente tales constructos pueden ser llamados “disposiciones”, puesto que probabilizan cierto tipo de comportamientos (Obregón, 1996). Entendidos así, designan no estados mentales, sino tendencias a interacciones explícitas o implícitas del individuo con situaciones particulares, posibles de analizarse molar o molecularmente:
“(…) como acciones que propician otras acciones; como desempeños (colecciones de acciones) que producen circunstancias facilitadoras o interferentes para la aparición de otros desempeños; y como acciones o desempeños que afectan el entorno microcontingencial (antecedentes y consecuencias físicas y sociales) de modo que éste, a su vez, modifique dichos sucesos” (Montgomery, 2022, p. 46-47).
USO DE LAS CATEGORÍAS DISPOSICIONALES EN LA CLÍNICA COMPORTAMENTAL
La falta de adherencia al tratamiento sanitario y psicoterapéutico constituye un posible predictor del fracaso de la intervención. Es por eso que hay que tener el máximo cuidado para procurar llevar a cabo métodos flexibles y abiertos a toda clase de posibilidades. La “legitimación” comportamental de los procedimientos que involucran tanto la consideración de constructos vinculados a la personalidad como a las creencias del individuo, es sin duda un tema opinable. Como apunta Lemos (1996):
La polémica relativa a si los sucesos a evaluar deben ser exclusivamente acontecimientos objetivos, presentes en la vida del individuo con independencia de la interpretación subjetiva que la persona hace de ellos o, por el contrario, matizados por dicha perspectiva subjetiva, no ha sido plenamente resuelta (p. 1006).
Por ejemplo, hay intercambios polémicos acerca del punto en la revista Behavior Modification. Para Collins y Thompson (1993), la consideración de los rasgos de personalidad como datos amalgamados con la información obtenida desde una entrevista conductual mejoraría la correspondencia entre el cliente y el tratamiento. Haynes y Uchigakiuchi (1993), en cambio, rechazan dicha integración porque, más allá de que la personalidad y los rasgos recalquen que hay consistencias intersituacionales significativas en el comportamiento, estos conceptos son semánticamente imprecisos, redundantes y rígidos en cuanto a los aspectos dinámicos del comportamiento.<
Sin embargo, hay tres cosas a favor de la primera posición: una, teniendo en cuenta que, como se dijo aquí ut supra, la mayoría de analistas del comportamiento optan por utilizar en su formulación clínica una amplia baraja de procedimientos de autoinforme y otros multimétodos que exceden el análisis funcional; dos, que el uso de aquellos procedimientos opera sobre la base de una concepción diferente a la tradicional, en tanto utiliza instrumentos no tan generales como los inventarios, prefiriendo escalas, cuestionarios y listas de chequeo con reactivos circunscritos a muestras de respuesta con especificidad situacional (Montgomery, 2018); y tres, las pruebas de que ciertos repertorios de personalidad y de creencias sobre salud son predictores del comportamiento real son abundantes (Bandura y Locke, 2003; Back et al., 2009; Welter y Oliveira, 2022).
Méndez et al. (2012) señalan con acierto que las mejores acciones para conseguir incrementar la adherencia son, por un lado, fortalecer el sistema de salud en general y las habilidades de quienes lo integran, y por otro enfatizar el papel de los pacientes como agentes de cambio de sus propias vidas. Juegan un rol en estas tareas la conjunción de esfuerzos institucionales y la adecuada relación entre el usuario y el prestatario del servicio, así como el ejercicio profesionalmente competente de la cantidad de métodos y técnicas que la ingeniería conductual provee no solo a nivel de la evaluación, sino sobre todo de la modificación del comportamiento. El uso de categorías disposicionales en el sentido especificado en el contexto de este artículo debe potenciar esas estrategias.
Así, en base a la teoría del aprendizaje de Staats (1997), que considera como variables que determinan el comportamiento: 1) la historia de aprendizaje (E1); 2) las condiciones ambientales actuales que evocan o controlan la conducta (E2), 3) los repertorios básicos de conducta lingüístico-cognoscitiva (RBC1), emotivo-motivacional (RBC2) y sensorial-motora (RBC3) que son resultado de esa historia; y 4) las condiciones biológicas que contribuyen a la constitución de los repertorios básicos (O1), tanto como las que los facilitan o interfieren (O2), y las que median en el impacto de las condiciones ambientales actuales (O3); Heiby et al. (2005) elaboran un modelo alternativo a los de la cognición social, llamado “modelo de cumplimiento de la conducta de salud” (Health Compliance Model: HCM) que “intenta integrar la literatura empírica, postular variables adicionales relevantes para el cumplimiento que aún no se han investigado y proporcionar una guía para la programación de tratamiento y prevención” (p. 31).
Dentro del enfoque de HCM, el RBC1 incluye el lenguaje ligado al cumplimiento, las imágenes, el conocimiento de los hechos y el procesamiento de la información; el RBC2 se relaciona con las emociones y motivaciones que acompañan este comportamiento, y el RBC3 con las habilidades sensoriomotoras funcionalmente involucradas. Esos RBCs interactúan con las condiciones de condicionamiento facilitadoras de O2 y los estímulos discriminativos y las consecuencias de E2, dependiendo de cuál sea la configuración contingencial, pudiendo convertirse en variables predictoras de los comportamientos de salud. Desde este esquema, la interrelación de tales factores disposicionales debe analizarse en función a las complejidades de cada caso, a fin de establecer la mejor fórmula de empleo de los estímulos condicionados que aseguren adecuadas respuestas de razonamiento, emotividad e instrumentalidad, sin excluir la reorganización del ambiente físico, información temática, el apoyo social y el seguimiento. La idea es lograr que los comportamientos de salud en general provoquen un potencial de afecto positivo (actitud de acercamiento y cumplimiento intrínsecamente reforzante) y los comportamientos no saludables provoquen un potencial de afecto negativo (actitud de alejamiento e insatisfacción intrínsecamente punitiva). Se espera, con ello, reducir las respuestas evitativas.
El valor de estas directivas fue evaluado exitosamente en adultos jóvenes mediante el autoinforme llamado Health Behavior Schedule II (Frank et al., 2007), que incluye 45 predictores de cumplimiento de 12 prácticas comunes de salud: 1) llevar una dieta saludable, 2) ejercitarse regularmente, 3) usar hilo dental diariamente, 4) protegerse del sol, 5) usar cinturón de seguridad, 6) practicar sexo seguro, 7) usar casco de seguridad para bicicletas, 8) no fumar cigarrillos, 9) limitar el consumo de alcohol, 10) tomar los medicamentos según lo recetado, 11) tomarse una prueba de detección de cáncer de útero, y 12) autoexaminarse mamas.
Esto es lo que se propone como el uso de las categorías disposicionales en la clínica comportamental. En suma, un compromiso responsable frente a las situaciones sanitarias y/o psicoterapéuticas para coadyuvar a su mantenimiento en los usuarios. Se declara “coadyuvar” porque, indudablemente, la intervención psicológica solo contribuye, entre otras condiciones, a dicho objetivo.
LIMITACIONES
Debido a las limitaciones de extensión, el presente artículo no ha tocado a fondo la dinámica de los modelos de salud basados en los modelos de creencias de salud mencionados. El hecho es que las políticas de atención de salud deben superar el enfoque de “protección” —más bien pasivo— por el de “promoción”, influyendo decididamente en el cambio de las contingencias que mantienen el nivel de adherencia al tratamiento por parte de los usuarios de los servicios en un nivel escaso, con los perjuicios ya reseñados.
CONCLUSIONES
La clínica comportamental tiene un papel que jugar en ese campo, por lo que se ve beneficiada por la introducción de modelos de salud que cuentan con sólida conexión entre las categorías teóricas (en este caso las disposiciones), la evaluación y la práctica psicoterapéutica. Aquí se han mencionado alternativas conductuales de la personalidad que procuran reunir ese caudal de una manera coherente, en especial la que proviene del trabajo de A. W. Staats, con el potencial heurístico suficiente como para integrar teoría, investigación y aplicaciones.

