


 English (pdf)
 Article in xml format
 Article references
 Send this article by e-mail
 Cited by SciELO
  Similars in
SciELO
Similars in
SciELO 
 Permalink
BACKGROUND
The concept of disability was interpreted based on religious principles (Martin & Ripolles, 2008) that justified mental retardation as a divine punishment. Subsequently, a rehabilitative medical model emerged that considered that the cause of disability had its origin in biological patterns and could be overcome if they were rehabilitated (Velarde Lizama, 2012). They were confined in specialized centers, psychiatric hospitals and orphanages, accentuating segregation, and social exclusion, facing barriers that limited their participation in daily life, education and employment (Palacios, 2008). This conceptualization lasted until the mid-twentieth century, when the medical model of disability began to be questioned, demanding compliance with the rights of social integration and equal opportunities (Belmonte Almagro & García Sanz, 2014). These changes allowed, in turn, that the concept of disability should not be interpreted from a medical perspective, but rather from a social one (Maldonado, 2013).
Despite progress in research and policy implementation in several countries, people with intellectual disabilities (PWID), in contrast to other forms of disability, continue to be victims of discrimination, prejudice and social exclusion (Gurdián-Fernández et al., 2020). This has threatened their fundamental rights and dignity, a problem that has been exacerbated during the COVID-19 pandemic and has hindered their access to the (global/national?) labour market (Silván & Quifes, 2020). Faced with this problem, the International Labor Organization (ILO) has established international standards necessary to promote labor opportunities for people with intellectual disabilities (ILO, 2017). However, the lack of research on this issue and the absence of policies to promote the labor inclusion of this social group are worrying. In this context, it is important to develop diagnostic studies to understand the socio-labor problems of people with intellectual disabilities, through measurement tools that allow the assessment of intellectual disability from a social perspective focused on labor inclusion. This issue has motivated researchers to explore perceptions of intellectual disability in different contexts (Valentini et al., 2019; Shahidi et al., 2023).
The social model recently implemented in the construction of instruments for measuring attitudes seeks to understand that disability is no longer a personal characteristic, but rather a social construct that requires adopting a philosophy of non-discrimination and equality (García-Sanz et al., 2022b).
In order to identify existing instruments, Palad et al., 2016, conducted a review on the scope of instruments measuring attitudes towards disability, finding 31 instruments of which only 6 were associated with the measurement of attitudes towards disability: Attitude to Disability Scale ADS-ID (P) applied to PWID and ADS-ID (G) to General population (Power & Green, 2010), Attitudes Towards Intellectual Disability Questionnaire (ATTID) (Morin et al., 2013), Challenging Behavior Perception Questionnaire (CBPQ) applied to service providers to people with intellectual disabilities (Williams & Rose, 2007), Community Living Attitudes Scale , Mental Retardation Form (CLAS-MR) (Henry et al., 1996a), Intellectual Disability Literacy Scale (IDLS) (Scior & Furnham, 2011), Mental Retardation Attitudes Inventory (MRAI-R) (Hampton & Xiao, 2008).
Table 1 Instruments measuring attitudes towards intellectual disability

Note. EFA= exploratory factor analysis, CFA= confirmatory factor analysis, PCA= principal component analysis
In the analysis of the psychometric properties of the mentioned instruments (Table 1), a diversity of statistical techniques used without sufficient theoretical support is observed, which could lead to imprecise conclusions, jeopardizing data-based decision making (Power & Green, 2010; Morin et al., 2013; Henry et al., 1996); Scior & Furnham, 2011; Hampton & Xiao, 2008; Williams & Rose, 2007). On the other hand, the lack of updated reviews on the psychometric properties of the aforementioned tests raises doubts about their validity. It is suggested that these reviews be conducted at least every 5 to 7 years, based on recommendations from the American Educational Research Association, the American Psychological Association, and the National Council on Measurement in Education (2014).
Likewise, in Singapore, the Attitude Scale towards People with Intellectual Disabilities (Boo & Nie, 2018) was designed considering the cultural particularities of the local population. At the same time, in Spain, the Invisible Barriers Scale: Attitude towards People with Intellectual Disabilities and the Goratu - PG Questionnaire (García-sanz et al., 2022) (Gómez et al., 2022) emerged, both specifically applied in school environments.
Principal Component Analysis (PCA) is a versatile tool that finds applications in various fields, for instance in situations where the bivariate distribution is linear, and the observations are independent (Jolliffe, 2002). Nevertheless, a methodological limitation has been identified in Likert-type scales that measure attitudes towards intellectual disability. It is generally chosen to use PCA rather than Exploratory Factor Analysis (EFA), as evidenced by countless studies (Power and Green, 2010; Morin et al., 2013; Scior and Furnham, 2011; Energy and Green, 2010). However, this preference has led to uncertainties regarding the accuracy of the obtained results. It is generally believed that EFA is more appropriate for exploring the underlying structure of latent variables, such as the measurement of attitudes (Lloret et al., 2017).
Most of the instruments available to evaluate attitudes towards intellectual disability are framed in a multidimensional perspective that encompasses affective, cognitive, and behavioral components (Whittaker, 2007). This approach seeks to comprehensively measure what people think, feel, and do in relation to intellectual disability (Antonak & Livneh, 2000) (Olson & Zanna, 1993). This is fundamental to understand the impact on educational, social, and labor support systems.
On the other hand. It has been shown that attitudes can be modified through cognitive-behavioral processes and social interaction, supported by the principle of neuroplasticity (Rees, 2016) (Lubrini et al., 2018). The establishment of neural networks generates brain changes in their configuration, as well as applying environmental enrichment interventions, significantly improves the adaptation of people with intellectual disabilities (PCDI) (Novak & Morgan, 2019). Increasing participation through inclusion programs facilitates social acceptance (Seccombe, 2007) and optimizes inclusion processes in compliance with their fundamental rights.
In this context, it is important to develop diagnostic studies to understand the socio-occupational problems of people with disabilities, using measurement tools that allow their condition to be assessed from a social perspective focused on labor market integration. Therefore, the objective of the present study is the construction, validity, and reliability of a scale of attitudes towards intellectual disability, to establish its suitability in programs to support labor inclusion.
METHOD
Design
The research employed a psychometric design, involving the creation and validation of the psychometric attributes of the assessment instrument (Ato et al, 2013 ).
Participants
The determination of the sample size was grounded on the Comparative Fit Index (CFI) adjustment index (CFI) established by Kim, according to specific statistical criteria that included a mean factorial loading of 0.6, mean factorial correlation of 0.7, a significance level of 0.05, and expected statistical power of 0.80. Consequently, a minimum sample size of 251 participants was considered essential. Furthermore, various factors were taken into consideration to mitigate the probability of committing a type II error. As an illustration, approximately 20 observations were made for each variable, as advocated by Lloret-Segura et al. (2014). Additionally, the participants engaged in the study were adults devoid of any health conditions. Moreover, a concise scale consisting of 12 items was utilized, which was devised to have two well-defined factors.
The sample comprised 255 laborers, with 35% (n=88) being females and 65% (n=167), males. The average age was 39.17 (SD 11.72). Furthermore, 67.8% (n=173) originated from public establishments, while the remaining 32.2% (n=82) came from private establishments.
Instruments
An analysis of the scientific literature was carried out to conceptualize the study variable. The Focus Group technique (Nassar-McMillan & Dianne Borders, 2002) with the participation of 7 people who worked in various institutions made it possible to validate the emerging dimensions and generate items.
Based on the qualitative procedures used, the underlying theory that supports the understanding of attitudes towards intellectual disability was identified. From a social perspective, it is recognized that the socio-labor inclusion of people with intellectual disabilities can be influenced by the presence of subtle prejudices. In this context, two dimensions were identified in relation to attitudes towards intellectual disability in a work environment: Perception and Social Distance (see Table 2), which have given rise to the formulation of a set of 12 items derived from the indicators.

After developing the instrument, rounds of cognitive interviews were carried out (Estefania & Zalazar-Jaime, 2018) to check the level of understanding and comprehension of each item. Next, the content validity procedure was carried out by expert judgment (Escobar-Pérez & Cuervo-Martínez, 2008 ).
Procedure
The data collection process was executed by utilizing a form in KoBo Toolbox, owing to the challenges encountered in accessing the internet. This form included the provision of Informed Consent. The type of participants' selection was intentional non-probabilistic, utilizing the snowball technique (Biernacki and Waldorf, 1981). This technique facilitated the expansion of the sample size by utilizing contacts and references, thus satisfying the inclusion criteria: individuals employed by either a public or private organization, possessing a minimum work experience of 6 months.
Data analysis
A descriptive analysis of the items was carried out to analyze the behavior and distribution of the scores. To assess asymmetry and kurtosis, it is being considered that their values do not deviate beyond the range of +-1.5, which may suggest the absence of univariate normality (Forero et al., 2009; Shield & Cartwright, 2005). Concerning the corrected homogeneity index that is reported, a value equal to or greater than 0.30 is deemed an acceptable minimum, thereby indicating that the items pertain to and adequately measure the corresponding factor (Kline, 2005). Additionally, the commonality of the items is reported, which denotes the extent to which the factor explains the variability, with a minimum threshold of 0.40 being deemed ideal for an item (DeTrinidad, 2016; Nunnally & Bernstein, 1994). For the Confirmatory Factor Analysis (CFA), the weighted least squares estimator with adjusted mean variance (WLSMV) was used, an estimation method suggested when the measurement scale is ordinal with a sample greater than 200 (Forero & Maydeu-Olivares, 2009). Various fit indices of the data to the theoretical model were tested (Xia & Yang, 2019), such as the Comparative Fit Index (CFI) where the values closest to one indicate to what extent the specified model is better than the null model, accepting values above .90 (Hu & Bentler, 1998). The Tucker-Lewis index (TLI) was found, relevant to generally distinguish the estimated model from the null model that indicates independence between the variables studied. The literature indicates that it is optimal if the value is greater than .90. Likewise, the RMSEA statistic was used, which is the root mean square error of approximation whose value must be less than .05 to be determined optimal (Lai, 2020) and Standardized Root Mean Square Residual (SRMR) whose score must be less than 05 with RMSEA confidence intervals (RMSEA CI 90%) less than .08. Reliability was analyzed using the internal consistency method, considering the model that had greater theoretical and empirical coherence, using the omega coefficient for multidimensional and ordinal categorical scales (Flora, 2020; MacDonald, 1999). The free access program RStudio (R Core Team, 2016) was used, using the libraries "psych" (Revelle, 2023), "lavaan", "EFAtools" (Rosseel, 2012).
Ethics Aspects
The study obtained the approval of the Cesar Vallejo University's Research Ethics Committee (EO41-2022-03) and was carried out following strict research ethics guidelines. During the application of the scale, each participant provided prior informed consent, respecting their wishes and the confidentiality of the information collected.
RESULTADOS
Descriptive analysis
In the descriptive analysis procedure of the items, no response option exceeded 80% marking, indicating that there is an adequate variability. The mean indicates that the frequency of responses is between option 3 and with a standard deviation between .72 and .99. On the other hand, the asymmetry (g1) and kurtosis (g2) coefficients did not exceed the value of ±1.5, except for items 1-2-8-9-10-11 and 12, which is evidence that the data are far from univariate normality.
In relation to the corrected homogeneity indices (CHI), the values were ≥ .30, which indicates the contribution of each item in the measurement of the construct (see Table 3). Likewise, the communalities exceeded the cut-off point (0.40) showing adequate shared variance. However, item 2 did not meet the criterion.
Table 3 Descriptive analysis of the items

Note. M=mean, SD=standard deviation, CHI=corrected homogeneity index, H2=commonality.
Analysis of the internal structure
Table 4 represents the results of the Exploratory Factor Analysis, identifying the consensus of the parallel method, Kaiser criterion and optimal coordinates, which coincided in the presence of two factors. The minimum residual estimation method was used since these are ordinal variables and oblimin rotation, the 2-factor structure explained 70% of the variance and the inter-factor loading was .63. In Factor 2 there is a Heywood case (item 8) “I would help him/her if he/she had difficulties” whose intention is similar to item 7.
Table 4 Exploratory Factor Analysis of the EADI Scale
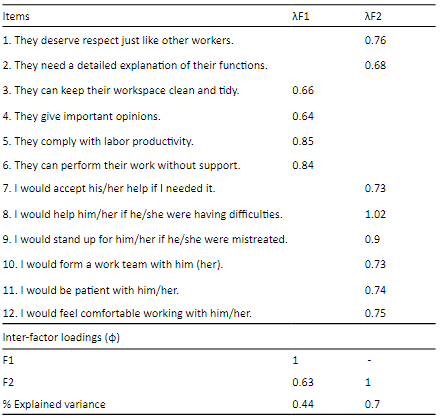
Note. F1: Perception towards intellectual disability; F2: Social distance towards intellec-tual disability
The instrument's structure was assessed using confirmatory factor analysis. We adjusted the model specification through successive corrections. A total of three models were evaluated, and their adjustment indices are presented in Table 5 The first model, retaining the original structure of the instrument, demonstrated excellent values in terms of its CFI and TLI indices. Additionally, it displayed an adequate value in SRMR. However, the RMSEA value was significantly higher than the acceptable minimum (0.10).
Subsequently, a re-specification of the original model was examined, considering the removal of two items with the lowest performance in both their factorial loading and corrected homogeneity index. This re-specified model is referred to as model 2. The second model exhibits notable enhancements across all its indices, demonstrating exceptional values in CFI, TLI, and SRMR. Although the RMSEA has already fallen below the prescribed minimum threshold, it remains comparatively high.
Consequently, a second re-specification is undertaken, drawing upon the modification rate and a careful examination of item content within the second model. As a result, in the third model, item 1 was relocated to the second factor representing social distance. This adjustment ultimately yields a final factorial model characterized by exceptional values in its adjustment indices and a tolerable RMSEA.
Table 5. Validity evidence based on the internal structure of the EADI scale
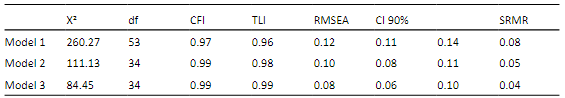
Note. Model 1 = Original model; Model 2 = Model 1+ ítem 2 y 6 removed; Model 3 = Model 2 + item 1 relocated to second factor.
The alteration in the standardized factorial loading of the items in the models are shown in Table 6. Within the initial model, items 2 and 6 possess significantly lower coefficient values in comparison to the other items, which may impede the evaluation of the instrument itself. Furthermore, upon excluding the items (model 2), the coefficients for the remaining items bear a resemblance to those demonstrated in the preceding model.
Despite the presence of three items in the initial factor, the third model demonstrates that the standardized factorial loading of these items experiences a slight increase and maintain values that are near one another. This phenomenon serves to reinforce a consistent evaluation of the factor by its corresponding indicators. Furthermore, the first item exhibits good performance when it is relocated to the second factor. Concerning factorial correlations, elevated values are observed across all three models, with a marginal decrease in the final model. This trend represents an ideal manifestation.

Internal consistency was evaluated with the factor loadings obtained through Confirmatory Factor Analysis (CFA). To establish adequate comparability, 3 decimal values in coefficients Alpha and Omega were used in Table 7. The variations are most evident in the alpha coefficient, where the values in its coefficient increased in the first and second factor, until the second model. As for the omega coefficient, a more conservative behavior is observed, in which factor 1 has barely a negative variation in one thousandth, while in the second factor there is a positive variation in 4 thousandths. All values in the reliability coefficients are considered adequate.

DISCUSSION
The results obtained through the application of the Attitudes towards Intellectual Disability Scale (EADI) were consistent with the underlying theory. However, it required certain modifications. The initial adjustments were centered around eliminating items 2 and 6, which consistently demonstrated insufficient performance in evaluating the instrument, both in terms of factorial loading and the descriptive indices provided. The second edition was implemented in Model 3, entailing the relocation of the initial element ("They deserve respect just like other workers") to the second variable of social separation. Theoretically, this adjustment is rooted in the reciprocal essence of "respect" within an interpersonal bond. Consequently, its placement within the realm of social distancing holds significance.
Despite undergoing two re-specifications resulting in the evaluation of three factorial models, the original configuration of the instrument has predominantly been preserved. Moreover, the assessment of reliability coefficients reinforces the notion that the re-specifications have contributed to an enhancement in the form of the instrument, and that the exclusion of items has not impacted the statistical evaluation of the instrument.
From a theoretical standpoint, each item symbolizes the quantification of variables in a pertinent manner. On one hand, the Perception variable concentrates explicitly on performance within a professional setting: maintaining a tidy and organized work area, providing constructive feedback, and contributing to labor efficiency. Furthermore, adequacy is ensured in the quantification of a variable through the utilization of a minimum of three items (Abad, 2011). Furthermore, it is evident that in the third model, the associations between the variables are below 0.85, which is the customary threshold to eliminate potential issues regarding the overlap of the measurement and/or the lack of differentiation among the variables (Brown, 2015 ). Despite the existence of various instruments that evaluate attitudes towards intellectual disability, most are aimed at the general population (Henry et al., 1996) (Scior & Furnham, 2011) (Morin et al., 2013) (Power & Green, 2010) or health workers (Williams & Rose, 2007). It is important to highlight that none of these instruments are specifically designed to measure attitudes in the work environment.
Moreover, other studies on attitudes towards people with intellectual disabilities were carried out in a school context (García-sanz et al., 2022) (Gómez et al., 2022), further highlighting the lack of tools oriented to labor contexts. In contrast, the Scale of Attitudes towards Intellectual Disability (EADI) focuses exclusively on the evaluation of attitudes in the workplace, with the aim of promoting the socio-labor inclusion of this group.
It has been observed that the tests that assess attitudes towards intellectual disability, apart from their lengthy nature, reveal disparities in the factorial structure when compared to the original theoretical proposal (Morin, 2013; Lena Song, 2017; Scior, 2011). The existing body of literature suggests the adoption of concise investigative tests, aiming to optimize the efficiency of data collection, minimize participant fatigue, and reduce irrelevant response patterns (Johnson, 2005). All of these considerations are methodological in nature and have an impact on the instrument's reliability (Tavakol & Dennick, 2011).
We identified the existence of nine instruments that evaluate discrimination towards people with intellectual disabilities through attitude scales. Of these instruments, seven are in English and come from the following countries: the United Kingdom (ADS - PG and DI) (Power & Green, 2010), Canada (ATTID - PG) (Morin et al., 2013), the USA (CLAS-MR) (Henry et al., 1996a), USA (CBPQ) (Williams & Rose, 2007), China (MRAI-R) (Hampton & Xiao, 2008), USA (IDLS) (Scior & Furnham, 2011) and Singapore (APID) (Boo & Nie, 2018). Two instruments were found in Spanish, both of which were utilized in Spain: The Goratu Questionnaire - PG (Gómez et al., 2022), the Invisible Barriers Questionnaire - PG (García-Sanz et al., 2022).
In light of the literature, a methodological gap has been identified with respect to the psychometric procedures used in previous studies. These problems range from the omission of relevant information to the application of statistical techniques that are not relevant to the psychometric analysis of latent variables. Several authors used Principal Component Analysis (PCA) as the technique of choice for latent factor analysis (Power & Green, 2010; Scior & Furnham, 2011; Morin et al., 2013 and Boo & Nie, 2018). Technique considered inadvisable for the identification of the factor structure of latent variables (Lloret-Segura et al., 2014).
Although the confirmatory factor analysis demonstrated consistency with the underlying theory through its fit indices, other studies (Hampton & Xiao, 2008; Power & Green, 2010; Boo & Nie, 2018) did not report the estimators to calculate the parameters of the model, nor did they fit them to the observed data. On the contrary, assessments assessing attitudes toward intellectual disability show a wide range and report differences in the structural composition compared to the original theoretical proposal (Morin, 2013; Lena Song, 2017; Scior, 2011). The existing literature suggests the adoption of brief survey assessments to optimize the efficiency of data collection, mitigating participant fatigue, and reducing the occurrence of irrelevant response patterns (Johnson, 2005). All of these considerations have methodological implications that affect the reliability of the instrument (Tavakol & Dennick, 2011). However, the assessment of attitudes toward intellectual disability in the workplace environment involves various components that cannot be quantified by a single instrument. The measurement scale presented in the current research only suggests two factors that have a sufficient level of theoretical clarity. These factors are derived from a nomological network rooted in the social model of intellectual disability proposed by the World Health Organization in 2001. In the field of discrimination, the first factor that exerts an influence is the level of understanding we have of the condition of disability and its defining characteristics (Scior, 2011). This research focuses on aspects directly related to these characteristics. To understand the efficient dynamics of interaction and communication that can be cultivated in a professional environment, the dimension of social distance proves to be crucial.
Limitations
We encountered several limitations, such as the limited sample size, which could potentially affect the generalizability of the findings to a broader population. The presence of response bias resulting from how the instrument was administered, where there was a lack of control over the circumstances in which participants completed the survey, undermines the validity of the findings. In addition, selection bias arises from complications in accessing the sample, thereby compromising the ability to apply sampling techniques. Finally, sociodemographic differences within the study cohort may influence the observed variations in the variable of interest. Therefore, it is imperative to exercise caution in interpreting the results and to take them into account in future research.
Implications for working environments
This brief instrument will facilitate inclusion in the work environment. A high rating on the instrument implies a higher degree of acceptance, while a lower rating may imply varying degrees of non-acceptance. These forms of assessment are essential for the identification and ongoing monitoring of work interactions, promoting improvements in the standard of professional existence and organizational effectiveness. Based on the quality standards established by the organization and by ISO 10667, it is essential to regularly carry out valid and reliable assessments to evaluate the performance and well-being of employees ( Muñiz, 2015). In this context, the use of this scale proves beneficial in identifying discrimination in the workplace and in implementing educational interventions that promote an inclusive and healthy work environment. Consequently, the scale not only fulfills the quality expectations of the ISO 10667 standard but also assumes an important role as a valuable tool for continuous improvement in human resource management. Measuring attitudes towards the PCDI will allow us to identify areas of prejudice and stigma that need intervention, and help us to identify and prevent maladaptive behaviors in the social work environment. Its approach requires the collaboration of professionals including psychiatrists, neurologists, rehabilitators, technologists, teachers, psychologists, sociologists, anthropologists, social workers as well as mental health institutions.
Conclusion
The EADI is a brief and accurate tool for measuring attitudes that is valuable in the evaluation of programs and policies aimed at understanding inclusion and equal opportunity. Further studies are recommended that allow for full invariance analysis to generate robust normative data and ensure the applicability of the results to a wider population.

