


 Spanish (pdf)
 Article in xml format
 Article references
 Send this article by e-mail
 Cited by SciELO
  Similars in
SciELO
Similars in
SciELO  uBio
uBio 
 Permalink
INTRODUCCIÓN
Climate change is a natural phenomenon that is occurring faster way due to unprecedented global warming based on the high levels of greenhouse gas emissions. These huge amounts of emissions are coming from different kinds of anthropogenic activities. It is unequivocal that human activity is the main cause of global warming (IPCC, 2021). It is well known that international agreements regarding climate change such as the Paris Agreement under the United Nation Framework Convention on Climate Change trying to hold the global temperature increase to 2 °C and pursuing efforts to limit it to 1.5 °C above pre-industrial levels.
Additionally, being even more relevant for the present study, increasing resilience and the ability to adapt to different impacts of climate change promotes low greenhouse gas emissions development, which, should not threaten food production (UNFCCC, 2015).
One of the most important impacts of climate change is the rise in frequency, severity, and duration of drought and flood events, which damages goes up to $850 M on a global scale (Byakatonda et al., 2020; Keil et al., 2008). Also, elevated locations like the tropical Andes will have a higher temperature than lower areas (Veettil & Simões, 2019).
Being Peru a mega-diverse country, its tropical Andes are the main source of food production since agriculture is one of the most important economic activities in the area. In that sense, the Mantaro Valley located in the Peruvian Tropical Andes (PTA) contributes to national and international food security. Unfortunately, climate impact drivers (CID) due to mean temperature, precipitation, and evapotranspiration pattern changes are threatening food production, reducing water availability, and increasing agricultural vulnerability (Arana-Ruedas & Moggiano, 2022).
(Islam et al., 2021; Meque & Abiodun, 2015) mention that this threat is strongly linked to a complex climate cycle event, drought. Which has difficulties assessing space and time to obtain local or regional information (Vicente-Serrano et al., 2017). For instance, lack of precipitation and high evapotranspiration triggers agricultural drought (Islam et al., 2021). It is a complex, slowly, developing event impacting the environment, and economic and social spheres (Javed et al., 2021; Karatayev et al., 2022; T. Wang et al., 2022; Zhao et al., 2021).
There are solid reasons to provide farmers with timely and effective climate information under climate-changing conditions to ensure their adaptative response (Gubler et al., 2020) in the Mantaro Valley against drought events. Location, where farmers still practice rain-fed cropping systems and are already affected by poverty (Sanabria et al., 2014).
To understand and assess drought events, the World Meteorological Organization (WMO) suggest some index like the SPEI (Byakatonda et al., 2020), which identify dry periods considering the differ-rence between precipitation and potential evapo-transpiration (PET) (Deivanayagam et al., 2022; Islam et al., 2021). In that sense, this study has applied the SPEI method due to its main role in global warming considerations (Meque & Abiodun, 2015).
Furthermore, aside from the climate impact drives (CID), Peru experiences a natural phenomenon called ENSO. (Byakatonda et al., 2020) mentions that ENSO is somehow related to drought severity. Nevertheless, the correlation between the oscillation and droughts depends on the region (Deivanayagam et al., 2022; Islam et al., 2021), making its analysis even more complex, especially in South America regions (S. M. Vicente-Serrano et al., 2017). Subsequently, concern regarding ENSO events has been evidenced in the Tropical Andes of Peru (Manzanas & Gutiérrez, 2019; Veettil & Simões, 2019) refers that during El Niño events a rise in temperature and reduction in precipitation is evidenced, affecting agriculture and ecosystems in remote areas (Sanabria et al., 2014; Wang et al., 2022).
Currently, the Mantaro Valley does not have a monitoring system for drought events which is urgent to understand the location's vulnerability and plan an efficient water management system as well as boost a resilient and low greenhouse gas emission agricultural development under a preventive approach.
In that sense, this study aims to analyze the correlation between the Oceanic Niño Index (ONI) regarding ENSO and agricultural drought events given in a time scale of 6 and 12 months using the SPEI within the Mantaro Valley.
2. Climate Change and The Andes
The Peruvian tropical Andes has a very complex climate system due to its orography, which has been exacerbated by global warming. The Andes region is mostly characterized by wet and dry seasons, starting from October to April and from May to September, respectively.
It is observed that in the central Andes of Peru, precipitation patterns are declining, but intense rainfall and long dry periods are more often which is expected to continue in coming years (Sanabria et al., 2014). Thus, one of the most important components of climate research is the temporal and spatial variability analysis of precipitation pattern changes (Zubieta et al., 2017).
Furthermore, as in most mountain areas worldwide, glaciers are showing an unprecedented loss of mass based on boosted atmospheric warming (Mark et al., 2017). This kind of melting in the Andes region is a serious issue since most of the time glaciers represent a main source of fresh water, which is highly expected to lack during dry seasons once the inflection point is overcome (Kronenberg et al., 2016).
Consequently, if precipitation and temperature patterns are changed as well as a rapid glacier loss of mass, agricultural activity in the central Andes of Peru is highly vulnerable (Sanabria et al., 2014). This vulnerability will lead to food scarcity affecting current and upcoming generations which in most cases are already struggling with poverty. In that sense, it is mentioned by (Carrasco-Torrontegui et al., 2021) that indigenous knowledge coming from the Andean population must be valorized and improved with the implementation of new technology to create an adaptive capacity against climate change and its climate impacts drivers such as soil erosion, drought, hailstorm, frost, and flooding.
3. Drought and Agriculture
A drought is a natural event that has exacerbated its impacts due to climate change mainly affecting the agricultural sector in highland areas like the Peruvian Andes. Vicente-Serrano et al. (2017) mentions that drought occurrence is highly linked with the area’s climate diversity under spatial and temporal characteristics.
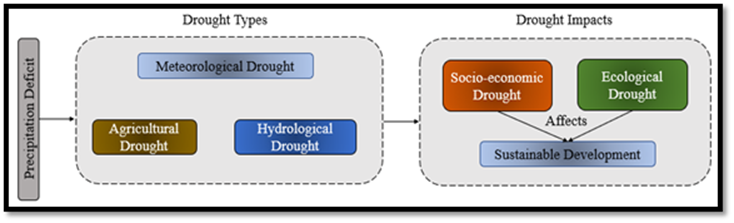
There are several types of definitions for drought in the literature. Also, most of them mention the meteorological, agricultural, and hydrological drought (Nikraftar et al., 2021) with its respective frequency, duration, and severity (Leng et al., 2015). Hence, for this study it will be defined as a complex, slowly, developing event that mostly occurs in many climate regimes with observed trends of warming. It is characterized by below-normal precipitation patterns, reduced water supply, and increased evapotranspiration over an extended period. The drought type and its relation with sustainable development are shown in Figure 1.
Agricultural drought is a consequence where there is a notable reduction in crop production due to a lack of precipitation, below-normal soil moisture, and poor irrigation system during crop forming (T. Wang et al., 2022). All its causes are related to water resources, which are critical for human and ecological normal development.
In that sense, Arana-Ruedas & Moggiano (2022) state that Peru has 31 water and 17 agricultural adaptation measures for climate change by 2050. Nevertheless, a considerable part of them does not have specific targets for the upcoming periods.
Sectors in the Peruvian tropical Andes like the Mantaro Valley do not have a system that let citizens, farmers, policymakers, academia, and other stakeholders know about past and future potential drought events to take appropriate decisions under a preventive approach.
Hence, climate change and agricultural deportment can be analyzed by implementing specific spatial and temporal agrometeorological indices that must involve precipitation, temperature, and evapo-transpiration variables (Vergni & Todisco, 2011) to provide accurate and useful information to increase resilience against climate change events (Javed et al., 2021).
4. El Niño Southern Oscillation (ENSO)
ENSO has two phases, El Niño and La Niña for warming and cooling, respectively; both events show opposite characteristics like severe dry or wet conditions (Deivanayagam et al., 2022; Islam et al., 2021). ENSO can be considered one of the biggest coupled ocean-atmosphere models, which used to appear in the equatorial zone and has a strong influence on weather and climate conditions around the world (Wang et al., 2022). Table 1 shows the Oceanic Niño Index related to La Niña and El Niño.
Table 1 ONI’sValue and Category
| ONI's Value | ONI's Category |
|---|---|
| ONI < -1.4 | Strong - La Niña |
| -1.4 ≤ ONI < -1.2 | Moderate - La Niña |
| -1.2 ≤ ONI < -1.0 | Weak - La Niña |
| -1.0 ≤ ONI ≤ 0.4 | Neutral |
| 0.4 < ONI ≤ 1.0 | Weak - El Niño |
| 1.0 < ONI ≤ 1.7 | Moderate - El Niño |
| 1.7 < ONI ≤ 3.0 | Strong - El Niño |
| ONI > 3.0 | Severe - El Niño |
Source: Estudio Nacional del Fenómeno del Niño, (ENFEN, 2023).
The not usual modification in the sea surface temperature (SST), also related to ENSO, leads to atmospheric circulation variation. It is linked with temperature and precipitation pattern changes which drive events such as drought or flooding worldwide (Liu et al., 2015). Economic, social, and environmental spheres are threatened by climate events like floods and drought exacerbated by ENSO which is one of the biggest concerns in tropical countries like Peru (Manzanas & Gutiérrez, 2019). This area is also affected since its crop production strongly depends on climate variability that is modified by ENSO events (Keil et al., 2008). It has been demonstrated that aside from global warming, annual and decadal variability in SST ENSO has an interaction with the rapid melting of glaciers in the Tropical Andes which was possible due to the rise in the temperature and precipitation reduction strongly evidenced in 1997/98 (Veettil & Simões, 2019).
In that sense, Byakatonda et al. (2020) mention that ENSO weather disaster is likely to continue bringing poverty and suffering. Furthermore, El Niño Southern Oscillation varies in space and time creating inconvenience when forecasters try to analyze its behavior (Wang et al., 2022). Thus, understanding the phenomenon ENSO, its implication from a regional perspective, and its consequences on crop production due to agrometeorological disasters is crucial (Liu et al., 2015). Subsequently, current technology regarding ENSO predictability is helping to mitigate adverse effects to give time to policymakers for their action planification (Manzanas & Gutiérrez, 2019). The inclusion of this accurate forecast will also reduce drought risk and improve water resources management in critical areas (Ganguli & Janga Reddy, 2013).
5. Standardized Precipitation Evapotranspiration Index (SPEI)
Drought analysis in countries like Peru where agricultural activity has clear relevance for food security is crucial and it must be done under a spatiotemporal approach (Javed et al., 2021). Currently exist around 60 drought indexes to understand drought episodes and the most used ones are the Standardized Precipitation Index (SPI), SPEI, and the Palmer Drought Severity Index (PDSI) (Wang et al., 2022).
Vicente-Serrano et al. (2010) stands that the SPEI is based on precipitation and PET considering global warming combining the accuracy of the PDSI with the easiest calculation of SPI under multitemporal characteristics. Table 2 shows these index characteristics. Furthermore, it is important to remark that SPEI was proposed by Beguería et al. (2014) and it also provides the capacity to identify different drought types such as meteorological, agricultural, and hydrological. The calculation procedure is pretty similar to the SPI but under a climatic water balance analysis this is the difference between precipitation and evapotranspiration. In addition, SPEI shows an intensity scale between positive and negative values for wet and dry events for periods from 1 up to 48 months (WMO, 2017). Table 3 specify SPEI categories.
Table 2. Drought assessment index characteristics
| Palmer Drought Severity Index (PDSI) | The Standardized Precipitation Index (SPI) | The Standardized Precipitation Evapotranspiration Index (SPEI) |
|---|---|---|
| Strength | ||
| Enables wetness and dryness values based on water balance taking into account evapotranspiration | It is easy to calculate and can be comparable in different time scales. | Combines the accuracy of PSDI regarding evapotranspiration under changing T° with the easy calculation and the different time scale analysis of SPI. |
| Weakness | ||
| It has a problem with spatial comparability & short-time scale analysis. Also, its calculation is complex. | It does not take warming into account (T°). | Deemphasizes the role of T° in droughts when potential evapotranspiration (PET) = 0. |
6. Mantaro Valley, ENSO, and SPEI
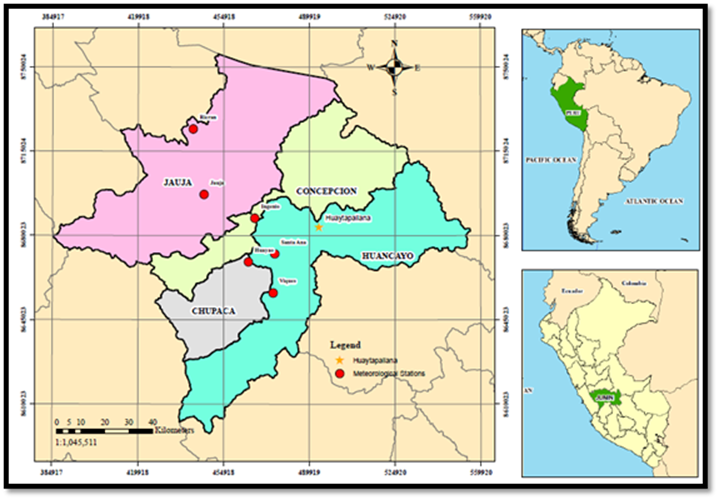
Junin region is in the central area of the Peruvian Tropical Andes (PTA), with 44,329 km2. It represents 3,4% of the Peruvian territory involving two of the three geographic regions, Andes and Forest, with 20,821 km2 (47%) and 23,508 km2 (53%), respectively (BCR, 2020). The Andes area is located in the Mantaro Valley, Figure 2 shows its division into four provinces (Huancayo, Chupaca, Concepción, and Jauja).
On the first hand, for SPEI, data were collected from six different meteorological stations with different data set periods due to availability in temperature and precipitation values, as follows: Chupaca (Huayao: 1990-2021), Huancayo (Santa Ana: 1996-2021 & Viques: 2003-2021), Concepción (Ingenio: 2002-2021), and Jauja (Jauja: 1990-2021 & Ricran: 2003-2021). Daily precipitation and Maximum/ Minimum daily temperature were provided by the Servicio Nacional de Meteorología e Hidrología del Perú (SENAMHI). On the other hand, ENSO-ONI data were collected from the Estudio Nacional del Fenómeno del Niño (ENFEN) for a period between 1990 - 2021.
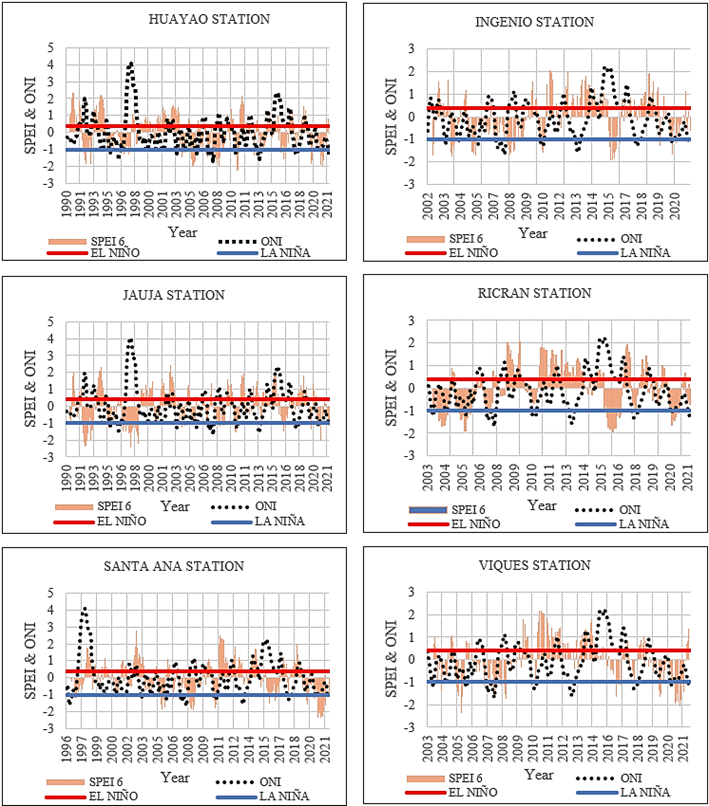
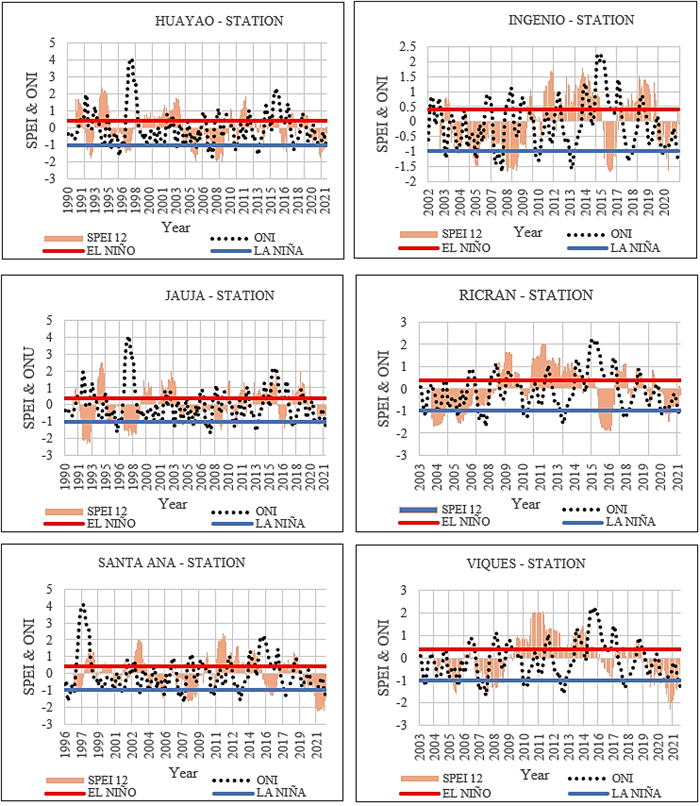
In that sense, SPEI values for 6-12 months (agricultural drought) and ONI graphs are shown in Figures 3 and 4, respectively for each of the six meteorological stations across the four provinces (Chupaca, Concepción, Jauja, and Huancayo).
To clearly explain SPEI and ONI deportment over the years under a spatiotemporal characteristic, Table 4 evidence events occurrence.
The table above describes the percentage of drought events within El Niño, La Niña, or No ENSO events of the analyzed period per each station among the four provinces related to SPEI 6 and 12 months which are linked to agricultural drought. It is important to mention that each “event” refers to “one month” where the phenomenon was taking place over the years.
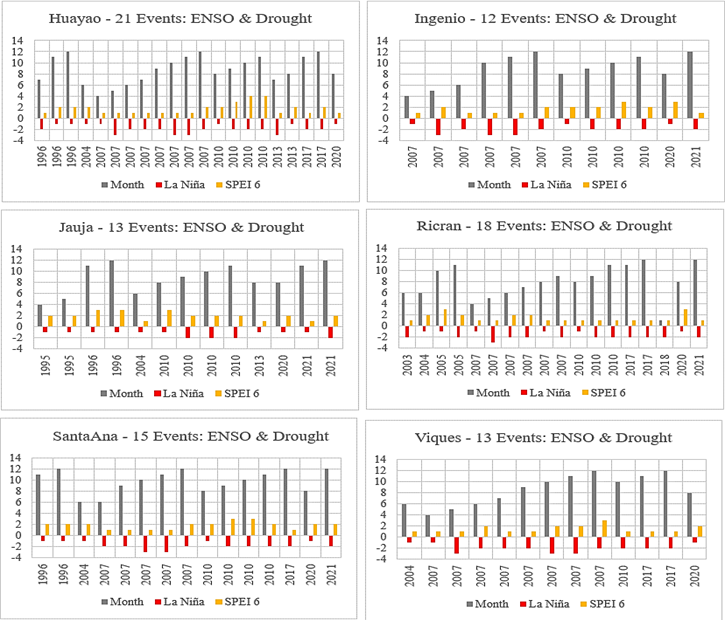
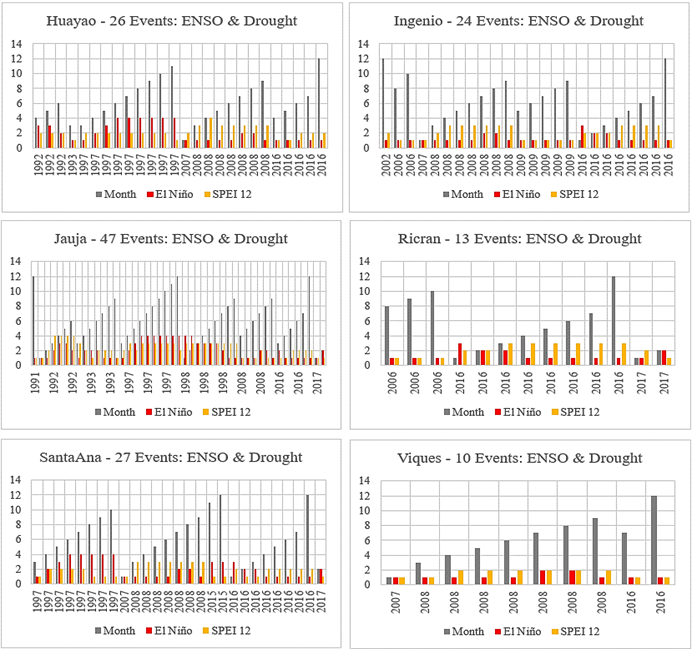
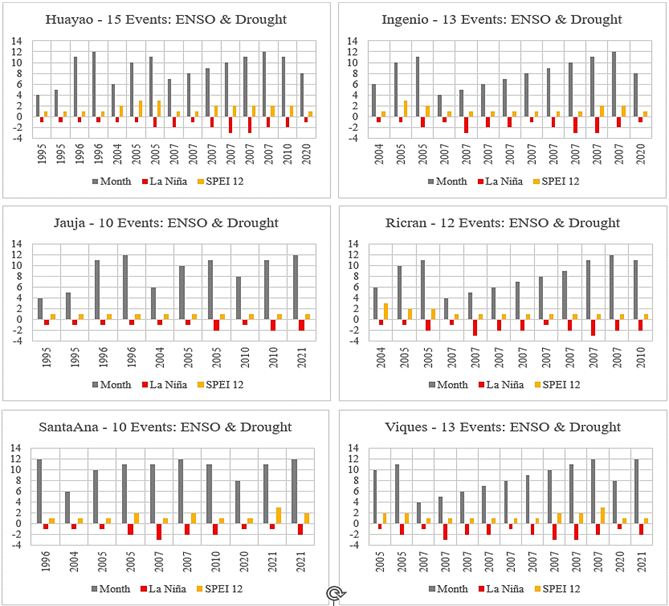
Furthermore, along with Table 4, Figures 5, 6 7, and 8 shows graphs for each station within the four provinces (Chupaca, Concepcion, Jauja, and Huancayo) regarding agricultural drought (SPEI 6 & 12) events among ENSO phenomena (El Niño and La Niña) under a spatiotemporal consideration.
El Niño and SPEI percentage of events with straight positive correlation are described in the following order 33.33%, 40.91%, 25%, 9.09%, 40%, and 50% for Huayao, Ingenio, Jauja, Ricran, Santa Ana, and Viques, respectively. La Niña and SPEI percentage of events with straight negative correlation are described in the following order 14.29%, 33.33%, 53.85%, 33.33%, 20%, and 23.08% for Huayao, Ingenio, Jauja, Ricran, Santa Ana, and Viques, respectively. El Niño and SPEI percentage of events with straight positive correlation are described in the following order 19.23%, 37.5%, 31.91%, 30.77%, 11.11%, and 60% for Huayao, Ingenio, Jauja, Ricran, Santa Ana, and Viques, respectively.
La Niña and SPEI percentage of events with straight negative correlation are described in the following order 60%, 38.46%, 70%, 16.67%, 70%, and 23.08% for Huayao, Ingenio, Jauja, Ricran, Santa Ana, and Viques, respectively.
Table 4 Drought Events Percentage for SPEI 6 and 12 months in El Niño, La Niña, and No ENSO events under different spatiotemporal characteristics over Mantaro Valley
| SPEI 6 Months - Agricultural Drought | SPEI 12 Months - Agricultural Drought | |||||
| Stations | El Niño | La Niña | No ENSO | El Niño | La Niña | No ENSO |
| Huayao-Chupaca (1990-2021) | 31.73% out of 104 events | 47.73% out of 44 events | 29.66% out of 236 events | 25% out of 104 events | 34.10% out of 44 events | 34.32% out of 236 events |
| Ingenio-Concepcion (2002-2021) | 34.92% out of 63 events | 38.71% out of 31 events | 29.45% out of 146 events | 38.10% out of 63 events | 41.94% out of 31 events | 34.25% out of 146 events |
| Jauja-Jauja (1990-2021) | 42.31% out of 104 events | 29.55% out of 44 events | 29.39% out of 236 events | 45.19% out of 104 events | 22.73% out of 44 events | 25.85% out of 236 events |
| Ricran-Jauja (2003-2021) | 19.30% out of 57 events | 58.06% out of 31 events | 31.43% out of 140 events | 22.81% out of 57 events | 38.71% out of 31 events | 33.57% out of 140 events |
| Santa Ana - Huancayo (1996-2021) | 30.49% out of 82 events | 36.59% out of 41 events | 27.51% out of 189 events | 32.93% out of 82 events | 24.39% out of 41 events | 30.69% out of 189 events |
| Viques - Huancayo (2003-2021) | 17.54% out of 57 events | 41.94% out of 31 events | 30.71% out of 140 events | 17.54% out of 57 events | 41.94% out of 31 events | 34.29% out of 140 events |

7. Critical Appraisal
Peru, naturally, is a mega-diverse country since it poses 38 different kinds of climates with 3 notable regions which involve coast, mountain, and forest. Thus, is scientifically understandable that variables such as precipitation which is the main driver of climate and weather events will cause relevant spatiotemporal variability and should be taken into account agreeing with (Zubieta et al., 2017) statement. In addition, Figures 3 and 4 can graphically evidence a notable difference (spatiotemporal variability) for agricultural drought (SPEI 6 and 12) when ENSO (El Niño and La Niña) events occur even in the same valley of a mountainous Peruvian area.
Furthermore, according to a numerical description in Table 4, it can be deduced that El Niño events use to occur more often than La Niña since 1990, but La Niña events were occurring more often than last century. In that sense, it evidences a challenge to forecast this phenomenon since its occurrence has been changing in the last years which can be linked to exacerbated global temperature rise.
Farther, based on the same table, when ENSO (El Niño or La Niña) occurred, 70% of the agricultural drought was evidenced since 1990 within the Mantaro valley. Nevertheless, regarding SPEI 6 months 5 out of the 6 stations revealed that is more likely to have agricultural drought when La Niña occurs. Meanwhile, under SPEI 12 months 4 out of the 6 stations follow the same deportment. In addition, around 30% of agricultural droughts occurred without ENSO events. In both ENSO cases, as (Manzanas & Gutiérrez, 2019) expressed; economic, social, and environmental spheres are threatened by drought events.
On the other hand, Figures 5 and 6 reveal important information regarding ENSO and SPEI severity. In the first place, linked to El Niño events for SPEI 6 and 12 months there is variability evidence among the stations where strong or severe El Niño caused slight or moderate droughts and for weak or moderate ones once severe or extreme drought events were identified. In the second place, related to La Niña events, a relation is more stable talking about severity but not straight correlated. In that sense, the severity correlation between ENSO and SPEI for agricultural drought is quite weak. Subsequently, most of the ENSO events related to drought happen between July and December when rainy seasons start around Mantaro Valley.
Consequently, this study agrees with (S. M. Vicente-Serrano et al., 2017) and their statement that drought occurrence is highly linked with the area’s climate diversity under spatial and temporal characteristics.
Finally, since agricultural drought is highly probable to occur when ENSO events are present, it is important to follow accurate ENSO forecasts as well to improve water management systems, which goes along with (Ganguli & Janga Reddy, 2013) thought and take into great consideration indigenous knowledge from the Andean population to rise adaptive capacity.
8. Conclusions
The Mantaro Valley is a very important agricultural land where climate and weather phenomena should be seriously considered under a preventive approach. Agricultural drought has been occurring and is highly expected to rise its deportment in the next decades, which could be exacerbated by ENSO events. Furthermore, it is crucial to follow ENSO forecasting to implement adaptive measure under indigenous knowledge and integrate it with current technologies, which will guarantee crop production and food security in Peru and the world.
Since water availability is strongly linked with the analyzed events, it is a national challenge to achieve Peruvian measures regarding water and agricultural activities. This kind of analysis can represent an important opportunity to reduce vulnerability since it let us know the probabilities of agricultural drought when ENSO occurs.
Furthermore, is important to take note that most agricultural drought events occurred since 1990 when La Niña happened, but it also when El Niño occurs. In that sense, measures to ensure agricultural activity cannot be delayed when one of them occurs. Especially due to the variable severity correlation between ENSO and SPEI, which are unpredictable based on several climates and topographic national characteristics.
Finally, it is strongly recommended to keep analyzing those stations with few data since its deportment can be changing given a different scenario understanding, as well as to track improved ENSO forecasting methods worldwide which will be useful since it can provide enough time for the formulation, implementation, and monitoring measures.

