


 Inglês (pdf)
 Artigo em XML
 Referências do artigo
 Enviar este artigo por email
 Citado por SciELO
  Similares em
SciELO
Similares em
SciELO  uBio
uBio 
 Permalink
INTRODUCTION
Paraguayan sheep production is growing conti-nuously due to the support provided by the public and private sectors; and the consumers’ prefe-rence for this meat is increasing, becoming an alternative to bovine meat consumption, whose price in the market is high. Currently, sheep farmers plan to increase production to export, so the item presents quite an encouraging outlook and is commercially favored by the low supply and high demand existing at the regional, national, and international markets (Mongelós, 2016).
To increase the productivity, it is essential to intensify production, by using improved genetics, and slaughter younger animals to obtain better carcass and meat quality. To achieve this purpose is necessary to adopt good sanitary management and nutritional program to meet the animal's energy and protein requirements (Carvalho et al. 2014), which implies the use of higher nutritional value feeds and lower costs (Oliveira et al., 2017).
Soybean meal is the most used protein source in ruminant feeding and has excellent nutritional quality (Palmieri et al., 2016), however, it has a high purchasing cost, mainly in areas distant from those soybean-producer regions making diets more expensive and reducing the livestock profitability (Dantas, 2018; Assis et al., 2019), so it is necessary to look for alternatives feeds to replace it to make diets cheaper without reducing the animal's productive performance.
Cottonseed meal is one of the alternatives to replace soybean meal, which is an ingredient resulting from grains oil extraction by physical and chemical methods (Lima-Júnior et al. 2011; Dantas, 2018). This by-product contains high values of protein (34% to 49%) and energy (NDT: 87%) and presents a lower purchasing cost in the market compared with soybean meal (Gadelha et al. 2014).
However, the cottonseed meal contains gossypol that is toxic to animals and, it can alter the flavor of the meat, reducing its commercial value (Gadelha et al., 2014). Adult ruminants are more tolerant to the toxicity (Assis et al., 2019), which suggests that sheep will respond satisfactorily to this by-product inclusion in the diet, although it is necessary to determinate the maximum level it could be included without reducing the animals' performance parameters and meat quality.
This research aimed to evaluate the productive performance, carcass characteristics, and meat quality of confined sheep fed with diets containing different levels of cottonseed meal as a substitute for soybean meal.
MATERIALS AND METHODS
Location and period of investigation
The experiment was carried out in an establi-shment located in the Department of Presidente Hayes, Chaco, Paraguay, latitude: 25°07°15.27° S and longitude: 57°42°38.81° W; between Sep-tember and November 2021. The duration of the investigation was 56 days, subdivided into four periods of 14 days. During the investigation, an average minimum temperature of 18 °C, an average maximum of 33 °C, and total precipitation of 17 mm were recorded.
Animals, diet and facilities
In total, 12 uncastrated male Santa Inés × Dorper sheep with average initial weights of 27.33 ± 0.58 kg and ages of 225 ± 15 days were used. Initially, they were weighed individually (with solid fasting of 12 hours) and identified with caravans placed in the ear and at the same time treated against endoparasites by applying ivermectin at a rate of 1 ml per 50 kg of live weight (LW).
Subsequently, they were housed in individual pens with 2.50 m2 of area per animal and equipped with food and water trays, and had wooden wall, zinc sheet metal roof and concrete floor. For feeding, isoproteic diets were formulated according to the category nutritional requirements by considering the NRC (2007) recommendation, with a forage-concentrate ratio of 30:70 (dry matter basis) (Table 1).
Animals were accustomed to the facilities and diets for 14 days, where supplied concentrates were gradually increased. The amount supplied diet was between 3 and 5% of the live weight (dry matter basis) and, the distribution was 50% at 07:00 am and the rest at 5:00 pm. These ranges were maintained during the experiment and the adjustments were made by daily feeder reading according to Lopes's (2013) methodology.
Tabla 1 Rations used to feed sheep in each treatment and their respective bromatological compositions
| Ingredients | Substitution levels (%) | ||
|---|---|---|---|
| 0% (T1) | 15% (T2) | 30% (T3) | |
| Pangola hay | 30.0 | 30.0 | 30.0 |
| Ground corn | 42.0 | 42.0 | 42.0 |
| Soybean meal | 23.50 | 20.0 | 16.50 |
| Cotton seed meal | 0.0 | 3.50 | 7.0 |
| Lime carbonate | 1.20 | 1.20 | 1.30 |
| Minerals 1 | 3.30 | 2.90 | 2.40 |
| Urea | 0.0 | 0.40 | 0.80 |
| Total | 100.0 | 100.0 | 100.0 |
| Nutritional composition | |||
| CP (%) | 18.00 | 18.00 | 18.00 |
| TDN (%) | 78.51 | 77.59 | 76.68 |
| NDF (%) | 32.67 | 32.91 | 33.16 |
| ADF (%) | 24.13 | 24.69 | 25.26 |
| Fat (%) | 4.57 | 4.50 | 4.42 |
| Ca (%) | 0.11 | 0.11 | 0.10 |
| P (%) | 0.06 | 0.05 | 0.05 |
1Composition of the mineral supplement: vit. A = 135,000 UI; vit. D3 = 68,000 UI; vit. E = 450 mg; Ca = 240 g; P = 71 g; K = 28.2 g; S = 20 g; Mg = 20 g; Co = 30 mg; 119 Cu = 400 mg; Cr = 10 mg; Fe = 2500 mg; I = 40 mg; Mn = 1,350 mg; Se = 15 mg; Zn = 1,700 mg.
Measures of performance and feed efficiency
The animals’ live weights (kg) measurements were carried out at 14, 28, 42, and 56 days with a prior 12 hours solid fasting. From the differences between the initial and final weight divided by the days of each experimental period, it is determined the daily weight gain (DWG, g day-1).
Dry matter intake (DMI) was determined by weighing food before offering, as well as the leftovers from the previous day, and the values were related to each animal live weight at 14, 28, 42, and 56 days. The feed conversion (FC, kg kg-1) was determined by the relationship between the DMI and the DWG for each experimental period.
Slaughter and carcass characteristics
At end of the trial (at 56 days), the animals were fasted from solid food for 12 h, weighed (slaughter body weight - SBW) were stunned for electro-narcosis and then the jugular veins and carotid arteries were sectioned for bleeding, according to the procedures that characterize humane slaughter.
All the non-carcass components were removed, and carcasses were weighed to obtain the hot carcass weight (HCW, kg). After weighing the hot carcasses, they were placed in a cold chamber at 4 °C for 24 h. Then the cold carcass weight (CCW) was determined, and the HCW and CCW were used to calculate the following carcass-related para-meters: hot carcass yield (HCY) = (HCW/SBW) × 100; cold carcass yield (CCY) = (CCW/SBW) × 100, and cooling loss (CL) = [(HCW - CCW) × 100]/HCW (Pérez & Carvalho 2002).
Measures meat quality
To evaluate the quality of the meat, the carcasses were taken to the Meat Quality Laboratory of the Faculty of Agricultural Sciences, National Univer-sity of Asuncion, where they were sectioned with a band saw and then the eye area of the loin (LEA, cm2) was measured in the 12th and 13th intercostal space, using the transparent checkered template with an area of 1 cm2 cell-1, and the thickness of subcutaneous fat (TSF) was also measured with a caliper (Cezar & Sousa, 2018).
Subsequently, two fillets with 2.54 cm thickness were extracted; following the transverse direction of the muscle fibers and, they were weighed and vacuum packed, and cooked in water bath (at 70 °C) for 15 minutes. The samples were removed and weighed again to determine the difference in weight and calculate the percentage loss by cooking (WLC, %).
To determine the shear force (SF, kgf), three sub-samples of the cooked samples were extracted with a 2.54 cm thick and 1.27 cm diameter punch and were positioned perpendicular to the Warner-Bratzler equipment blades (1.1684 mm thick). The equipment was calibrated with a standard weight of 5 kg. The device's descent rate was 200 mm/min (AMSA, 2015).
Statistical analyses
Obtained data were subjected to analysis of variance (ANOVA) using the Fischer test (p ≤ 0.05) using the InfoStat® software (Di Rienzo et al., 2015) adopting a completely randomized experi-mental design, with 3 treatments consisting of cottonseed meal levels (T1: 0%; T2: 15% and T3: 30%) and 4 repetitions (4 sheep). The treatments means were compared by the Tukey test (p ≤ 0.05) and the mathematical model used for the analysis was the following:
Yijk = μ + Gi + εijk (1)
Where Yij: the value of the dependent variable referring to the observation k, of cotton seed meal level i, in the repetition j; μ: the overall average; Gi: effect of cottonseed meal levels i; (i = 1, 2, 3); εij: the random error associated with each observation.
In addition, when significant effects were registe-red in some variables, a regression analysis was carried out at 5% significance for a better description of the treatments behavior and to determine the maximum level of cottonseed meal to be used.
RESULTS AND DISCUSSION
Dry matter intake and feed conversion
No significant effect of the cottonseed meal levels (15 and 30%) was observed on the sheep DMI up to 28 days of experimentation (Table 2; p ˃ 0.05). However, after 42 days, consumption decreased linearly (p ≤ 0.05) and on average was 6.78% (Figure 1). On the other hand, FC was linearly improved by 32% at 14 days; while at 28 days an improvement of 19.91% was observed (Figure 2) only with the inclusion of 15% (T2) and after 42 days, conversion decreased linearly by 32%.
Table 2 Dry matter intake and feed conversion of confined sheep receiving different levels of cottonseed meal with a substitute for soybean meal in the feed
| Variables | Cottonseed meal (%) | S.D. | Regression equation | r2 | |||
|---|---|---|---|---|---|---|---|
| 0 (T1) | 15 (T2) | 30 (T3) | |||||
| Dry matter intake (%LW) | |||||||
| At 14 days | 3.81 | 3.75 | 3.78 | 0.10 | ŷ = 3.78 | - | |
| At 28 days | 4.33 | 4.18 | 4.13 | 0.11 | ŷ = 4.21 | - | |
| At 42 days | 4.94 | 4.47 | 4.38 | 0.13 | ŷ = -1.8667x + 4.8767* | 0.87 | |
| At 56 days | 4.84 | 4.55 | 4.68 | 0.11 | ŷ = -0.5333x + 4.77* | 0.30 | |
| Mean | 4.48 | 4.24 | 4.24 | 0.10 | ŷ = -0.8x + 4.44* | 0.75 | |
| Feed conversion (kg kg-1) | |||||||
| At 14 days | 6.58 | 4.33 | 4.62 | 0.54 | ŷ = -0.98x + 7.1367* | 0.64 | |
| At 28 days | 6.58 | 5.31 | 6.82 | 0.56 | ŷ = 61.778x2 - 17.733x + 6.58* | 0.99 | |
| At 42 days | 4.97 | 7.37 | 6.99 | 0.54 | ŷ = 1.01x + 4.4233* | 0.61 | |
| At 56 days | 5.63 | 8.17 | 8.09 | 0.93 | ŷ = 1.23x + 4.8367* | 0.73 | |
| Mean | 5.94 | 6.45 | 6.63 | 0.22 | ŷ = 0.345x + 5.5967* | 0.99 | |
| * Significant at 5% probability by the F test. S.D.: standard deviation. r2: regression coefficient | |||||||
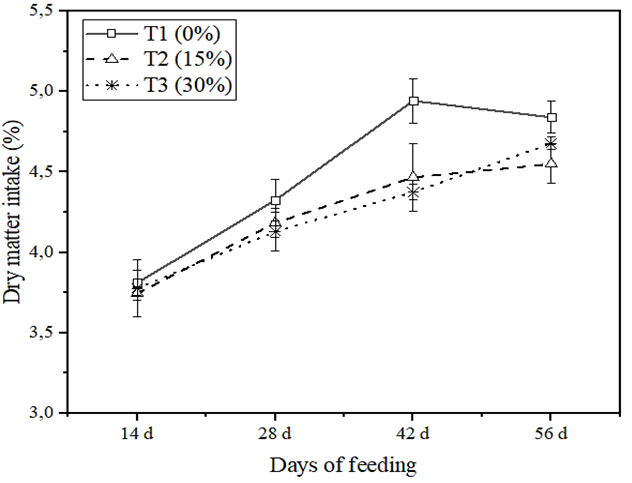
Figure 1 Dry matter intake of sheep (%LW) fed with different levels of cottonseed meal instead of soybean meal at 14, 28, 42, and 56 days.
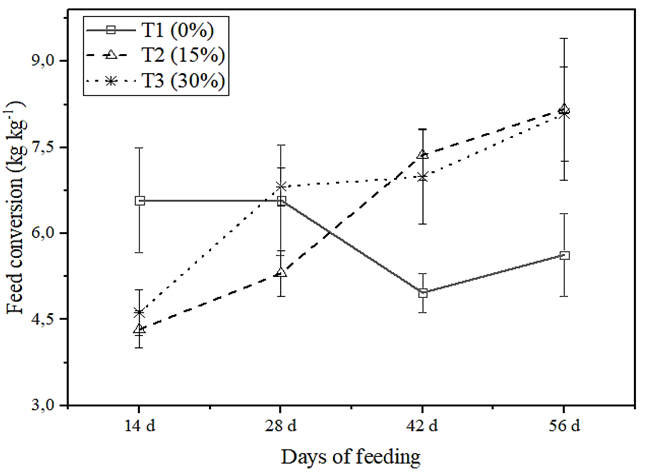
Figura 2 Feed conversion of sheep (kg kg-1) fed with different levels of cottonseed meal instead of soybean meal at 14, 28, 42, and 56 days.
The FC improvement up to 28 days and subsequent decrease in parallel to DMI by including the cottonseed meal, could be a consequence of the cumulative toxic of ingested gossypol effect on the liver and kidney (Kim et al., 1996; Gadelha et al., 2014), in addition to causing anorexia in animals (Velasquez-Pereira et al., 1998); whose degree of toxicity depends on the animal age, with youngsters being more susceptible (Rocha, 2016; Mello et al., 2018) and adults tolerant (Assis et al., 2019). In study, 7.5 months of age were used, which allows us to infer that they are moderately resistant to said toxicity, so they responded well in the two initial periods of the experiment and then decreased ingestion and feed conversion.
Lima-Junior et al. (2011) included the extruded cottonseed meal up to a level of 40% without harming the DMI of sheep without a defined breed. They did not find negative effects on this variable during the 67-day experiment, which does not coincide with observed in this study. Negrão et al. (2020) including cottonseed meal up to 21% instead of soybean meal recorded a decrease in DMI in Santa Inés sheep. On the other hand, Rocha (2016) did not observe significant effects on the FC of lamb when substituting up to 100% of the soybean meal for cotton cake.
Productive performance
The levels of cottonseed meal did not influence (Table 3; p ˃ 0.05) the LW of the sheep during the experimental period. However, they significantly influenced DWG (p ≤ 0.05); with a quadratic behavior until 28 days of experimentation, reaching maximum peaks with an inclusion level of 20%, which coincides with reported by Viana (2011). However, no effects were observed at 42 days, as well as in the average DWG, but a theoretical linear reduction of 3.842 g is recorded for each increased percentage of this by-product at 56 days.
Figure 3 shows that the cottonseed meal levels (15 and 30%) improved DWG by 49.48% at 14 days, meanwhile, at 28 days; the inclusion of 30% of cottonseed meal (T3) already reduced the weight gain in comparison to the first measurement and was similar to the control (T1), while the inclusion of 15% (T2) continues to stand out with a higher value of 34.55%.
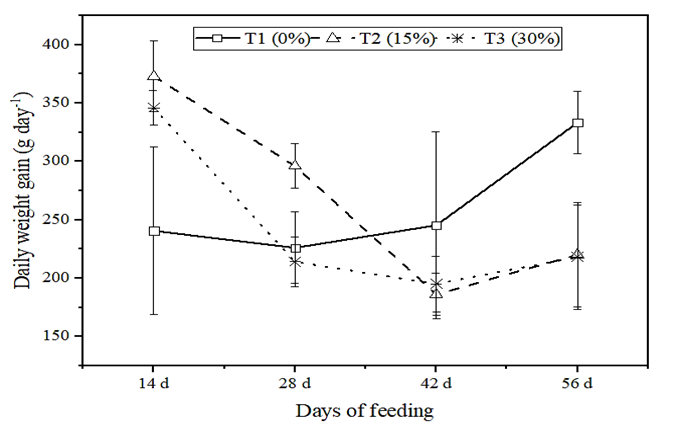
Figure 3 The behavior of the DWG of the sheep (g day-1) fed with different levels of cotton expeller instead of soybean expeller at 14, 28, 42, and 56 days.
Table 3 Live weight and daily weight gain of sheep in confinement receiving different levels of cottonseed meal with a substitute for soybean meal in the feed
| Variables | Cottonseed meal (%) | S.D. | Regression equation | r2 | ||||
|---|---|---|---|---|---|---|---|---|
| 0 (T1) | 15 (T2) | 30 (T3) | ||||||
| Live weight (kg) | ||||||||
| Initial | 27.0 | 28.0 | 27.0 | 1.84 | ŷ = 27.27 | - | ||
| At 14 days | 30.17 | 33.0 | 30.17 | 1.98 | ŷ = 31.11 | - | ||
| At 28 days | 33.33 | 37.0 | 33.33 | 2.07 | ŷ = 34.55 | - | ||
| At 42 days | 36.77 | 40.0 | 36.77 | 2.03 | ŷ = 37.85 | - | ||
| At 56 days | 41.43 | 43.0 | 41.43 | 2.08 | ŷ = 41.95 | - | ||
| Daily weight gain (g day-1) | ||||||||
| At 14 days | 240.50 | 373 | 346 | 38.97 | ŷ = -0.3544x2 + 14.15x + 240.5* | 0.99 | ||
| At 28 days | 226 | 296 | 214 | 23.78 | ŷ = -0.3378x2 + 9.7333x + 226* | 0.99 | ||
| At 42 days | 245.25 | 186 | 195 | 40.75 | ŷ = 208.75 | - | ||
| At 56 days | 333.25 | 220 | 218 | 38.80 | ŷ = -3.8417x + 314.71* | 0.76 | ||
| Mean | 261.5 | 269 | 243 | 18.27 | ŷ = 257.83 | - | ||
| * Significant at 5% probability by the F test. S.D.: standard deviation. r2: regression coefficient. | ||||||||
Although no differences were observed at 42 days, it is already appreciated that the control showed a tendency to outperform the other treatments, confirming this at 56 days, where it registered a higher result of 34.28% at both levels. Based on the behavior of this study, it can be stated that for the category of ovine used, it is possible to replace the soybean meal with a cottonseed meal for no more than 28 days, since it is counterproductive in the long term (Gadelha et al., 2011; Viana 2011; Gadelha et al., 2014). As for the trend of decree-sing DWG reported in the last periods of this study, it is probably due to the lower consumption and conversion presented by the animals (Table 2), since there are 90% correlations between these variables (Mertens, 1994; Dantas, 2018).
As in this study, Rocha (2016) when substituting the soybean meal for cotton cake in confinement sheep feeding observed that up to 68 days after his experimentation, the substitution did not influence on the DWG, while it decreases from then on. The author also reported a linear reduction trend with increasing levels of this by-product (33%, 67% and 100%). Similarly, Absalan et al. (2011) observed DWG in Zandi sheep when using 16% cottonseed meal in the diet, while incorporating 8%; reported significant improve-ment in the values of this variable.
Carcass characteristics and meat quality
No effects of cottonseed meal levels were observed on HCW, HCY, CCW, CCY, LEA, TSF, and WLC (Table 4; p ˃ 0.05). However, significant effects (p ≤ 0.05) were appreciated on the carcass WLc and the TSF, confirming a quadratic trend, where better values were obtained with the level corresponding to 15% (T2) for both variables. The carcass yields (hot and cold) achieved in this study were similar to those obtained by Silva (2017) in Santa Inés sheep but they are lower than those reported by Pompeu et al. (2012) in crossbred lamb (½ Morada Nova Red variety × ½ without defined racial pattern).
Regarding the lower WLc presented by T2, it could be due to the greater TSF presented, although statistically, it was not different from the other treatments, however, the fat in the carcass exerts a protective function against moisture loss (Cunha et al., 2016), and the greater the loss when the TSF is lower (Silva-Sobrinho et al. 2005). In general, the WLc recorded in this study is relatively low compared to the average considered acceptable, which is 2.5% (Martins et al., 2000) and is lower than the losses reported by Cunha et al. (2016), Cesco (2015) and Dantas (2018).
Regarding to the meat tenderness, the results obtained in this study can be classified as tender according to the scale of Hopkins et al. (2006). Therefore, it can be affirmed that the meat obtained in the sheep is of excellent quality and more so with the cottonseed meal level corres-ponding to 15% (T2), this could be due to the greater coverage of FT which prevented cold hardening. The results obtained in this study were better than reported by Urbano (2011) and Silva et al. (2014).
Table 4 Characteristics of the carcass and meat quality of sheep in confinement receiving different levels of cottonseed meal with a substitute for soybean meal in the dietx
| Variables | Cottonseed meal (%) | SD | Regression equation | r2 | ||||
|---|---|---|---|---|---|---|---|---|
| 0 (T1) | 15 (T2) | 30 (T3) | ||||||
| Carcass characteristics | ||||||||
| HCW (kg) | 16.05 | 17.40 | 16.20 | 2.00 | ŷ = 16.55 | - | ||
| HCY (%) | 39.90 | 42.26 | 41.73 | 3.09 | ŷ = 41.30 | - | ||
| CCW (kg) | 16.08 | 17.25 | 16.00 | 2.10 | ŷ = 16.44 | - | ||
| CCY (%) | 38.33 | 41.34 | 40.24 | 2.91 | ŷ = 39.97 | - | ||
| WLc (%) | 1.57 | 0.92 | 1.49 | 0.18 | ŷ = 0.61x2 - 2.48x + 3.44* | 0.99 | ||
| Meat quality | ||||||||
| LEA (cm2) | 19.0 | 19.50 | 19.50 | 3.30 | ŷ = 19.25 | - | ||
| TSF (mm) | 1.25 | 1.0 | 1.0 | 0.16 | ŷ = 1.08 | - | ||
| WLC (%) | 23.82 | 21.87 | 25.19 | 2.83 | ŷ = 26.63 | - | ||
| SF (kgf) | 1.97 | 1.41 | 1.57 | 0.26 | ŷ = 0.56x2 - 2.24x + 3.65* | 0.99 | ||
| * Significant at 5% probability by the F test. SD: standard deviation. r2: regression coefficient. | ||||||||
CONCLUSIONS
Under the conditions in which the present inves-tigation was carried out, it is concluded that the use of cottonseed meal instead of soybean meal in confined lamb feeding improves feed conversion, daily weight gain, and meat tenderness and reduces weight loss by cooling and cooking. However, it did not affect the other variables.
It is possible to substitute the soybean expeller for cotton expeller in the feeding of sheep up to a level of 20% and for some time no longer than 28 days.

